Getting Started: Practical Examples of Using SpreadFighter
Intro
SpreadFighter differs quite a lot from the trading and analytics solutions a retail client is used to.
The platform's models do not give fully ready-made "signals", "entry points", etc. SpreadFighter gives people a good tool for finding inefficiencies / gaining a market edge in an efficient market.
The market is a closed environment and a zero-sum game. If someone makes money, someone else loses it. There is no other way. The model of handing out bare signals, public copy trading, etc. is doomed from the start. If you do not understand this, make sure you find out why.
To realize the full potential of SpreadFighter's trading and analytics tools, you need research skills, namely:
- A basic understanding of the fundamentals and knowledge of market mechanisms
- A basic understanding of how various market phenomena show up in market data (volatility, volume, tape speed, liquidity, open interest, correlation, classic and synthetic spreads, etc.).
Example: "inflation rises → the Fed raises the key rate → loans get more expensive → production shrinks → people are laid off → purchasing power falls → demand falls → prices drop → inflation falls → the Fed lowers the rate", etc.
- The skill of asking the right questions and setting specific tasks.
"Which altcoin should I buy with $ 100 to have a Lamborghini tomorrow?!" is a bad question. "How will the volatility of a specific asset change relative to the broad market during a pump? Which function of the mathematical toolkit can give me an unambiguous answer that volatility has changed?" are good questions.
- A basic understanding of risk management and of the distribution of win rate, profits and losses in different types of strategies.
If you have the competence in the points above, using professional analytics tools will be much more productive, because you will understand:
- what task the user is facing,
- which models and tools can help solve it.
Below are several workspace presets and examples of using the platform for different types of strategies, approaches and timeframes: from short-term inefficiencies to long-term portfolio trades and synthetic positions.
Trade Examples
Layering in the RUNEUSDT Perpetual limit order book
The user looks for layering algorithms, which unscrupulous market participants use to influence prices. The activity of such participants shows up in liquidity, volatility and market depth. The user trades mean reversion to average fair prices after the algorithm is switched off.
On 24 Feb 2024 at 12:15 UTC+3 the Layering highlighter model points to the appearance of a layering algorithm in the RUNE limit order book.
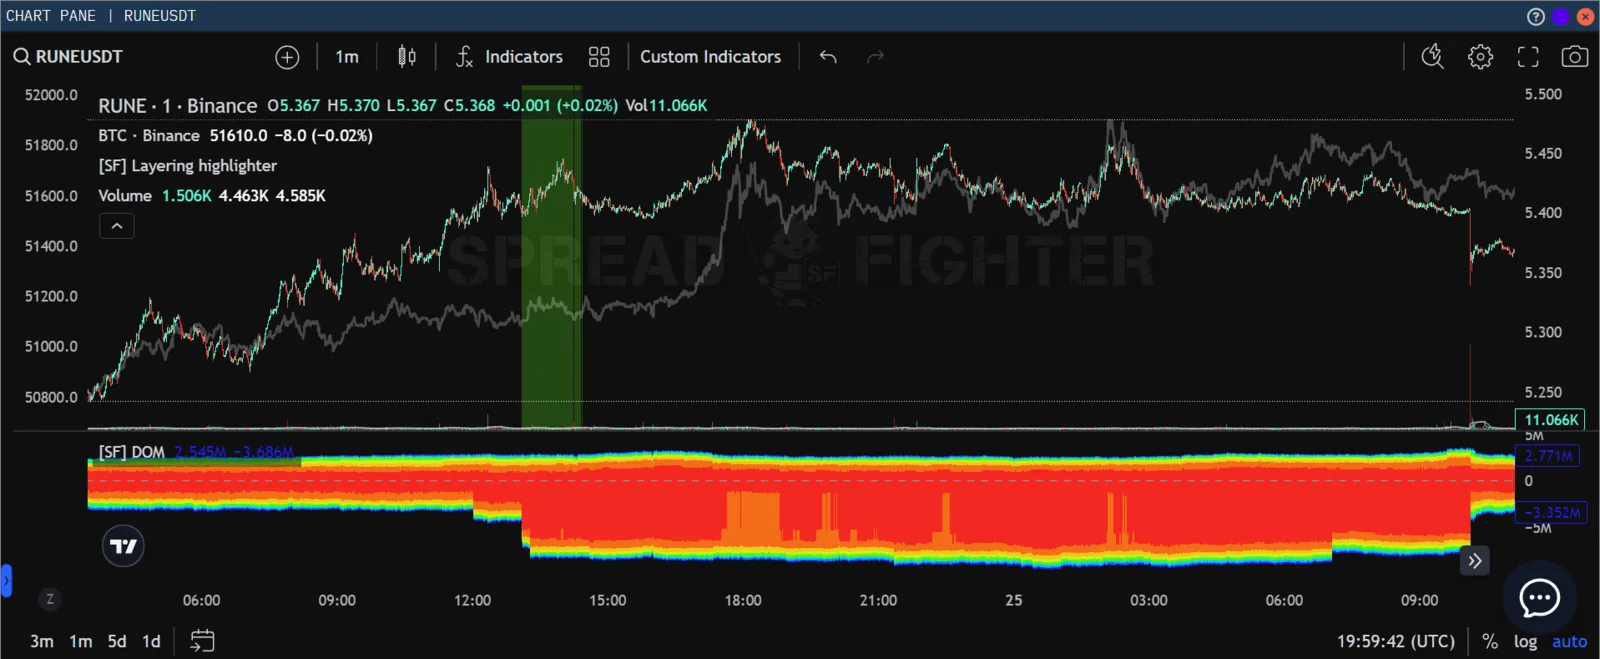
Layering activity indication in SpreadFighter
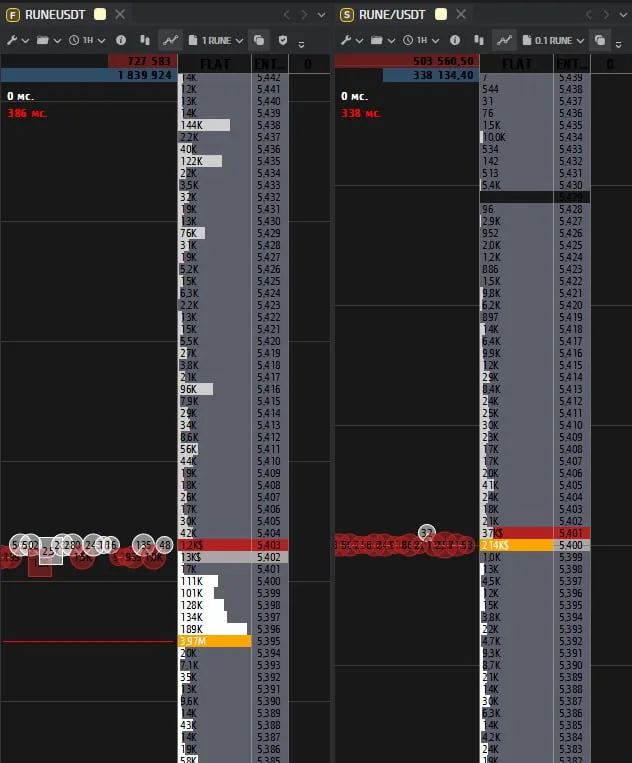
What the imbalance looks like in the limit order book
The trader built a short position during accumulation. On 25 Feb 2024 at 10:00 UTC+3 the placed orders were pulled, and the asset price reacted with a drop of -1.5%.
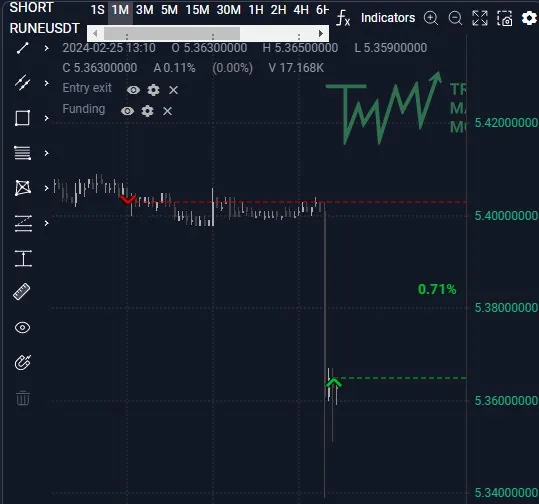
Diary entry
Frontrunning spoofing orders in MAVIAUSDT Perpetual
The user looks for spoofing algorithms, which unscrupulous market participants use to influence prices. The activity of such participants shows up in liquidity, volatility and market depth. The user trades a momentum strategy at the moment the algorithm's activity begins.
At ~10:00 on 8 Mar 2024 a group of limit orders appeared near the current prices on the MAVIA futures contract. The asset was found through the Top manipulations widget.
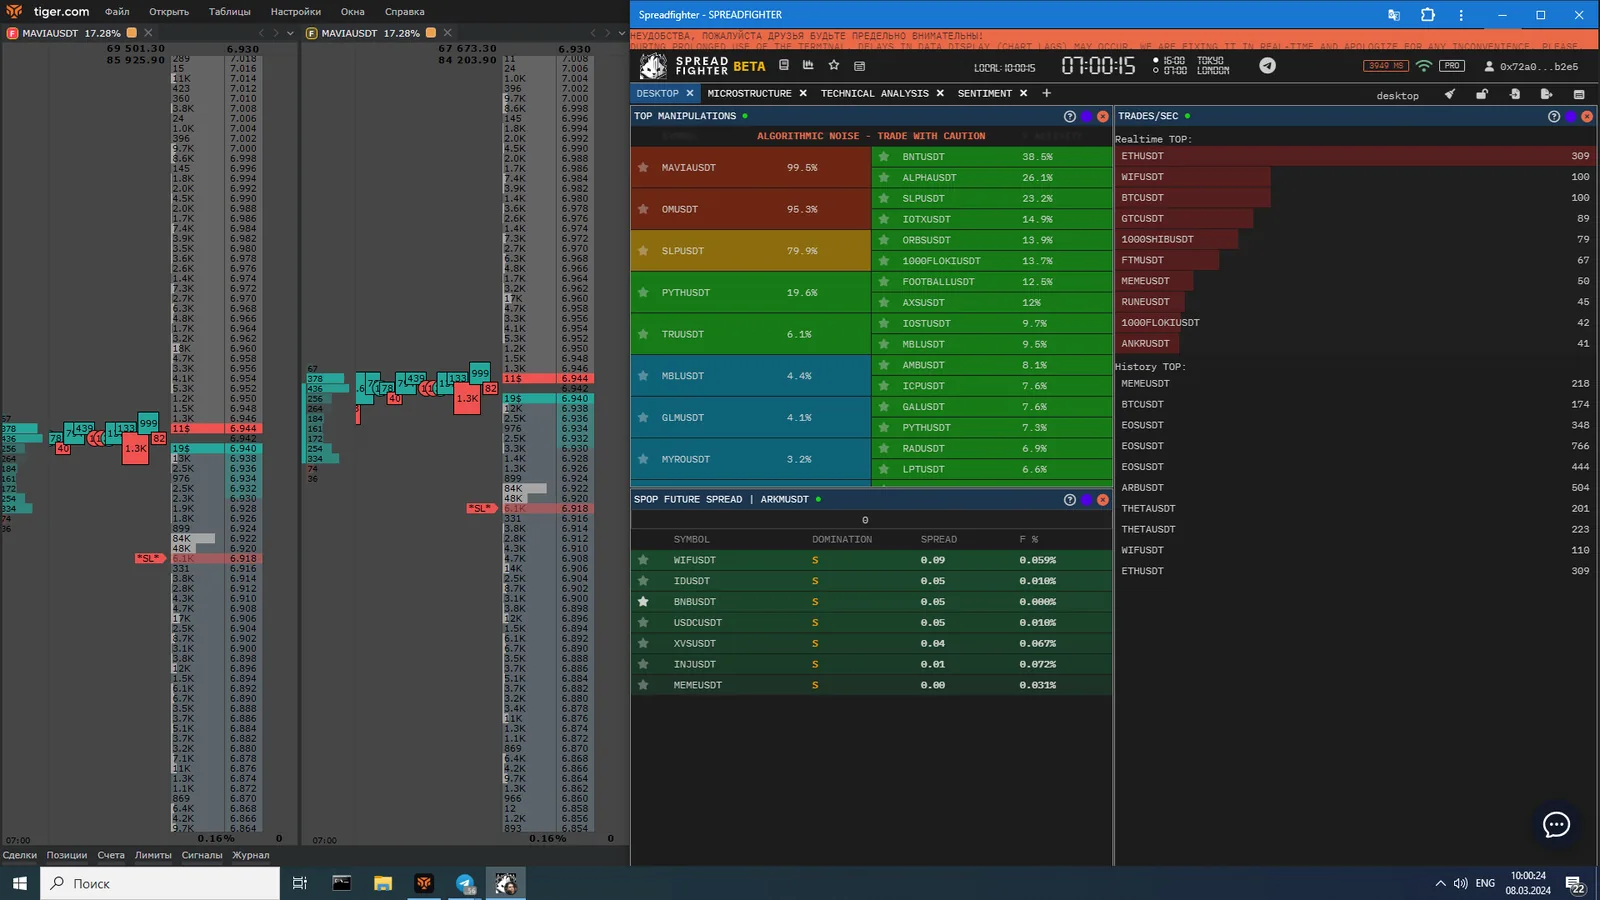
Appearance of the participant
The participant started moving the density higher and higher, pushing the price up.
Note how the DOM indicator reacts to a large limit order: the bid values get larger.
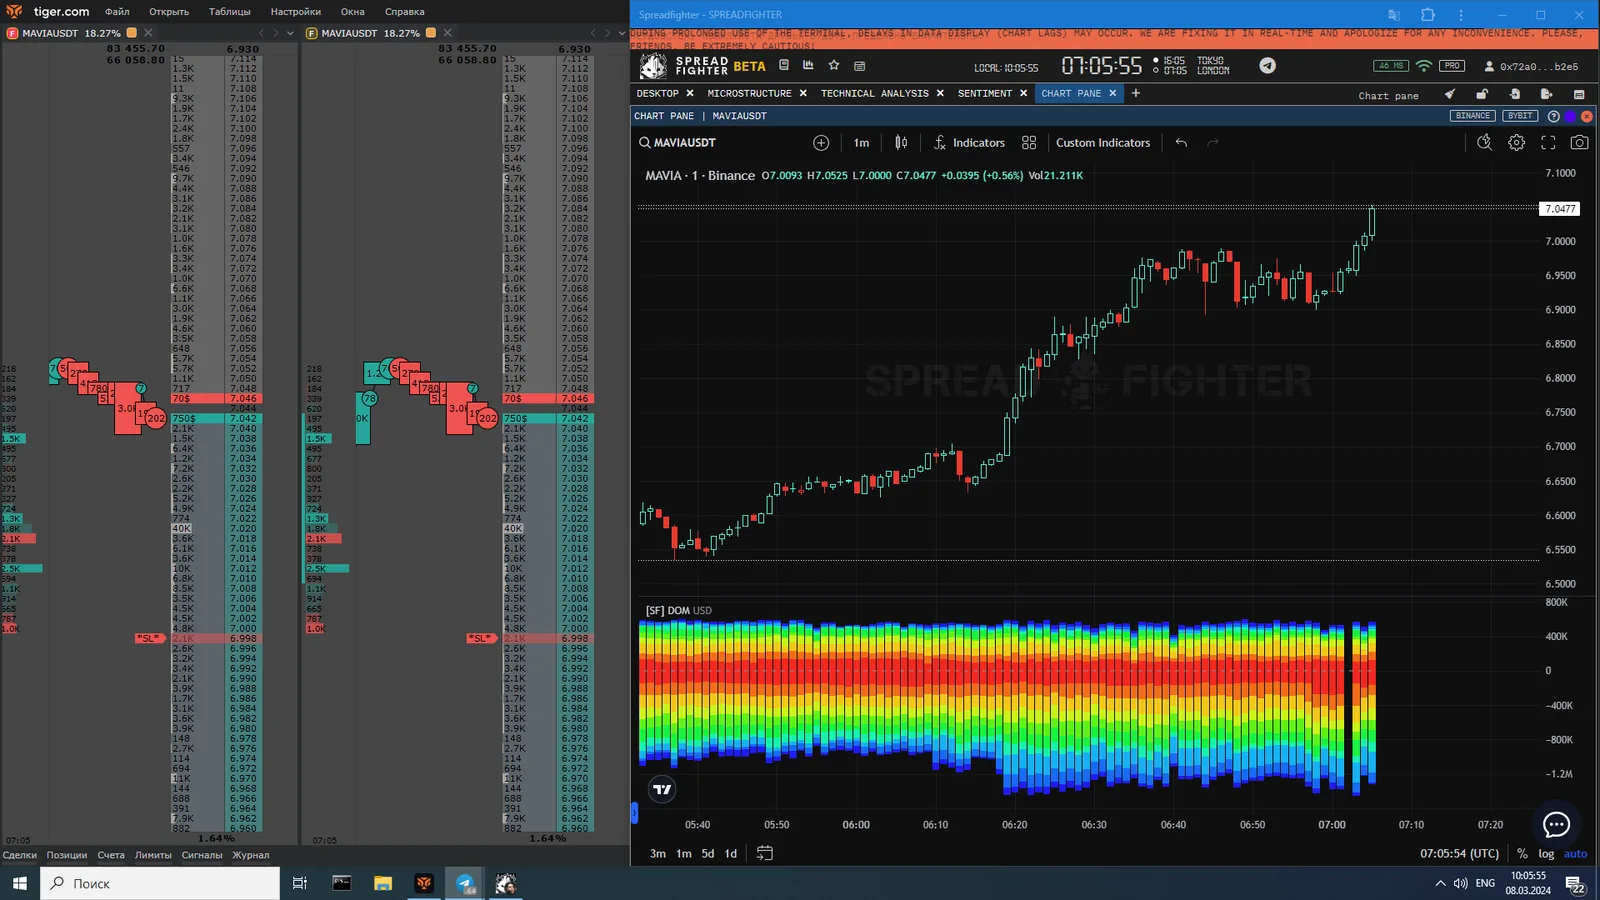
How the situation develops
The density is pulled and the trade is closed at ~2.5%
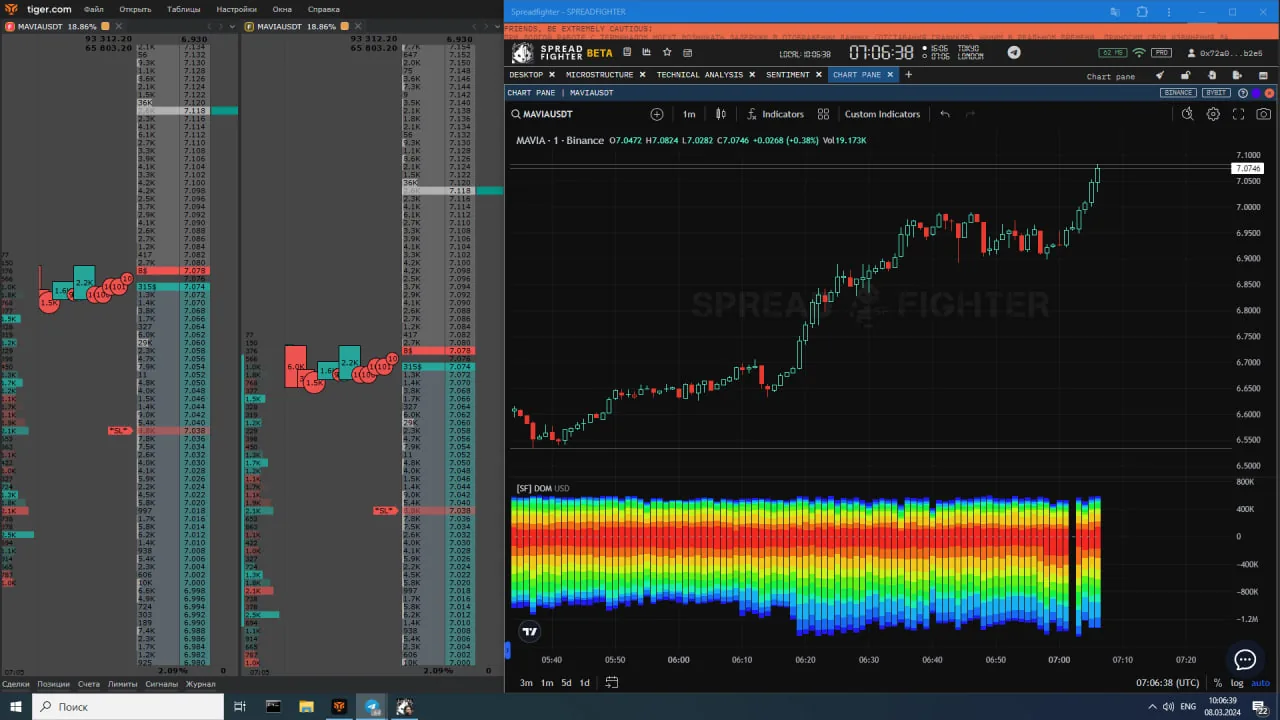
Closing the position
The participant appeared 3 more times.
Frontrunning spoofing orders in POLYXUSDT Perpetual
The user looks for spoofing algorithms, which unscrupulous market participants use to influence prices. The activity of such participants shows up in liquidity, volatility and market depth. The user trades momentum at the moment the algorithm's activity begins.
At ~20:26 on 8 Mar 2024 a group of limit orders appeared near the current prices on the POLYX spot market. The asset was found through the Top manipulations widget.
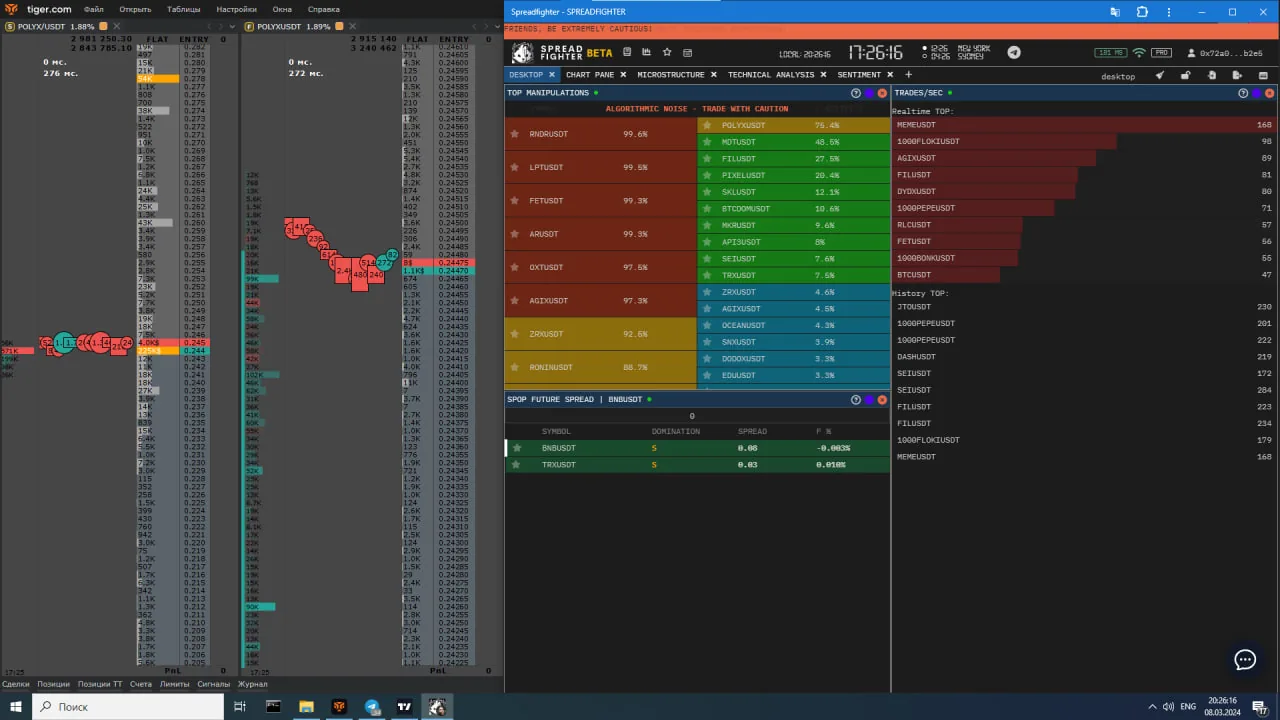
Opening the position
The participant started moving the density higher and higher, pushing the price up.
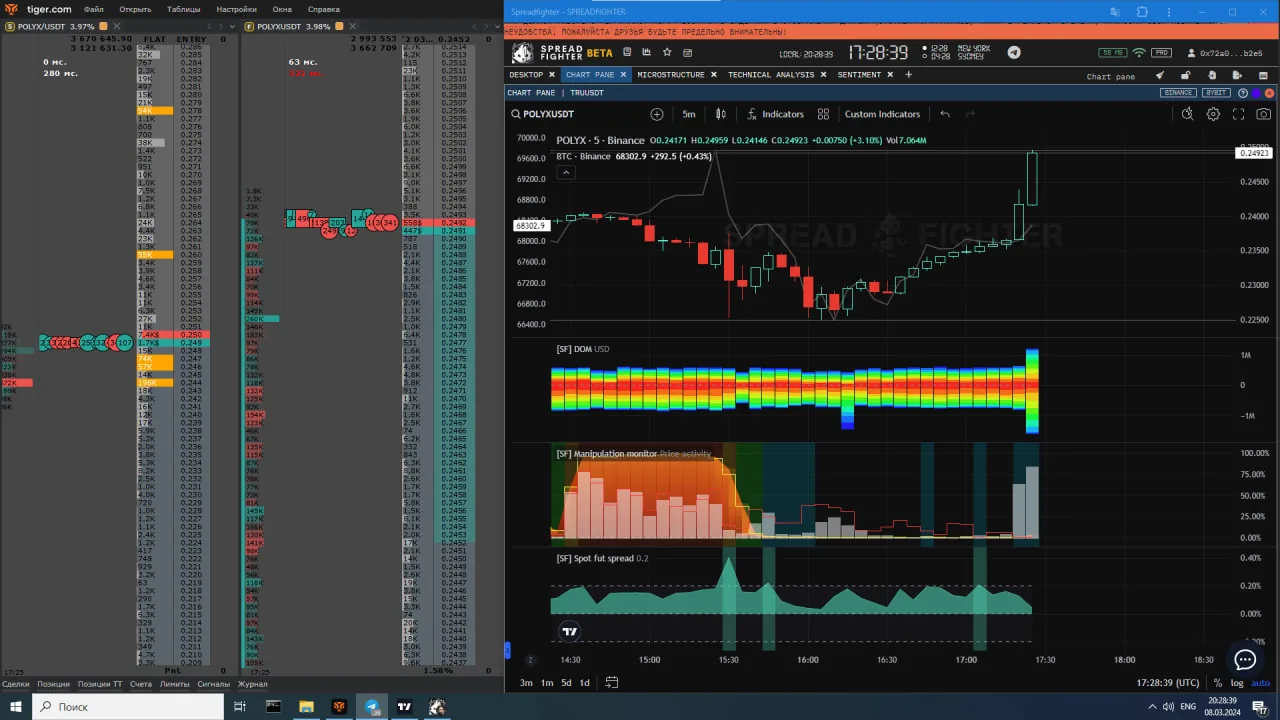
How the situation develops
The density is pulled and the trade is closed at ~1.5%.
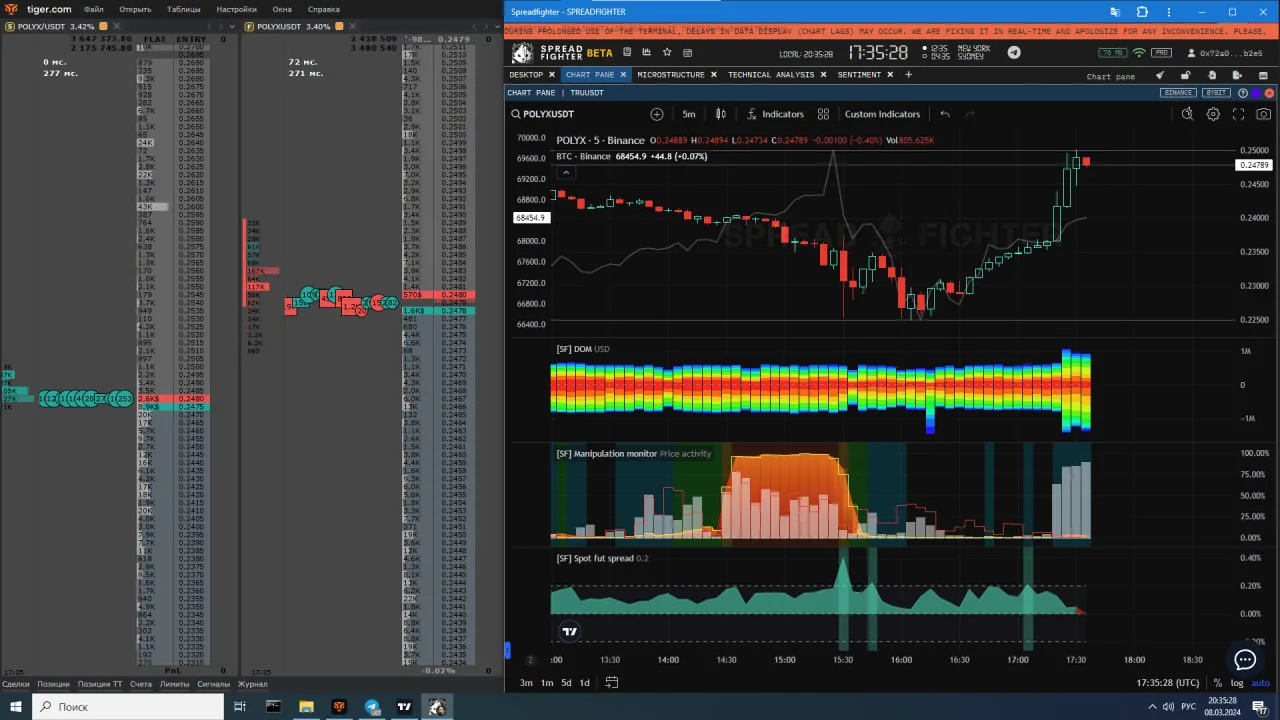
Closing the position
Tracking large-participant activity in BLZUSDT Perpetual
Using deep analysis of onchain metrics, the user looks for assets that large market participants are paying increased attention to, and adds long positions in the coins found to their portfolio, increasing alpha
Bluzelle is a blockchain platform of distributed databases for decentralized applications. It lets you manage data in a secure, censorship-resistant and highly scalable way. Bluzelle runs on the Cosmos SDK and its Tendermint BFT technology, which makes it compatible with various blockchains. As developers keep building Dapps, relying on centralized databases from AWS, Microsoft and other companies means having a centralized point of failure. True freedom requires decentralizing the whole stack, not just part of it. This is where Bluzelle aims to play a critical role in the development of DeFi, supply chains, gaming and other Web 3.0 sectors.
Source: block-chain24.com
$ 100,000 and $ 1,000,000 are not small sums. This is especially true in the crypto market, where such balances can often take a significant share of the total supply and circulating volume. In late summer 2023 the Whale $ 1k. + & $ 1 mln. + transaction count metric recorded a spike in activity. Moreover, the bulk of the transaction volume went to large holders from trading platforms, which is reflected in the Exchanges to whale flow, CEXes to whale flow and Whale balance metrics. After this onchain metric anomaly, the BLZ token rose.
It is worth noting that the whole market was growing in this period. But while the benchmark, BTC, rose 35%, BLZ rose 500%, which is certainly a good result. This is true even despite its higher volatility and risk premium.
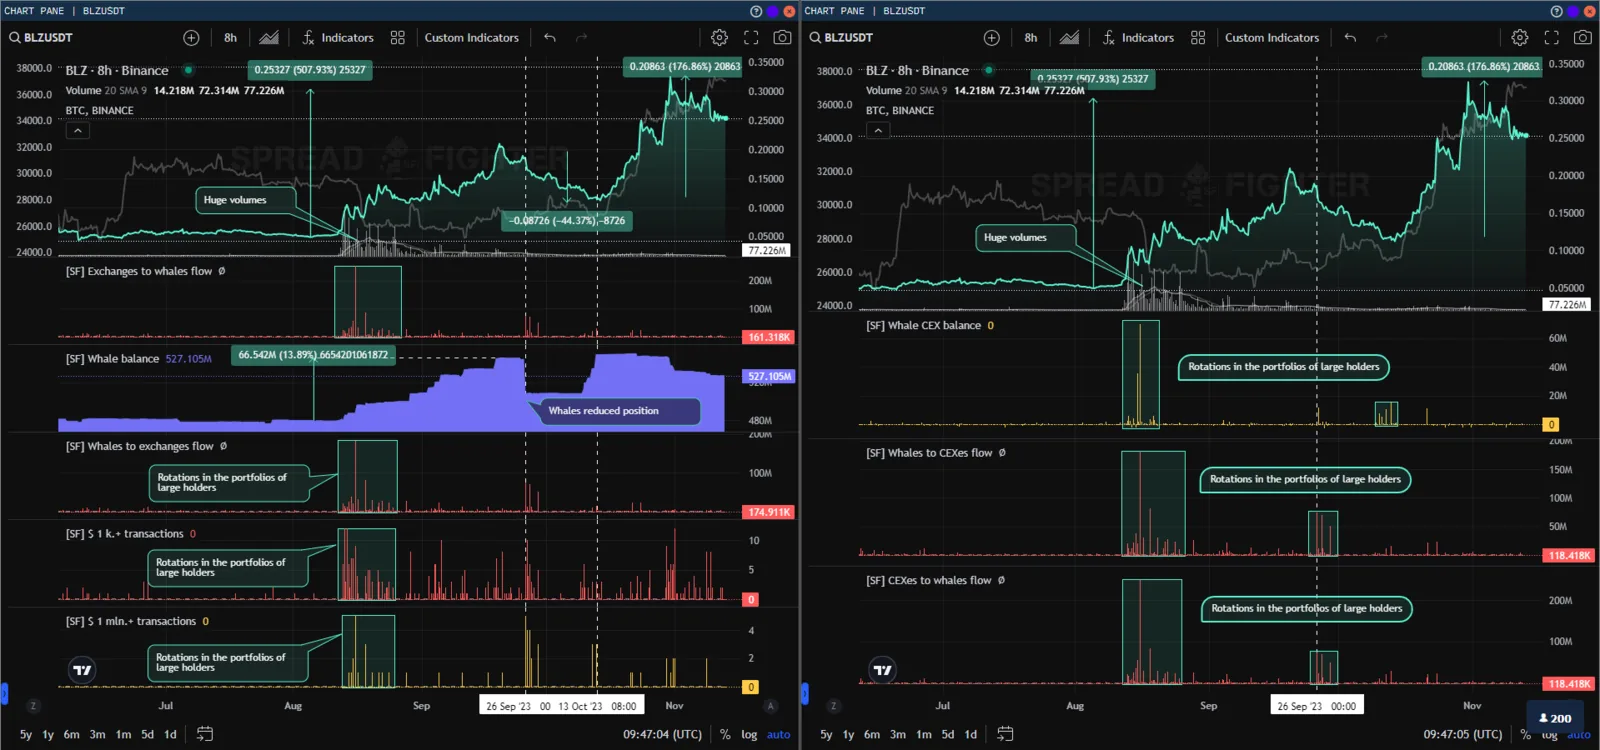
Bluzelle (BLZ)
An important fact: on 26 Sep 2023 the Whale balance model recorded a reduction in the whales' position. After the signal the asset corrected by almost 50%. On 13 Oct 2023 large holders restored their exposure to the asset, followed by a rise of 176%.
The strategy can be implemented on the trader plan
Mean reversion trading of synthetic baskets
Trading idea: using Market ratio, the user looks for the assets that have deviated most from overall market conditions and builds a basket that converges to average fair market prices. The microstructure tools Predict Liquidations and Net open interest are used as a filter. The Broad market indicator is used to find the average fair price. Manipulation monitor is used to control the risk of toxic quoting of the instruments and the appearance of a participant.
A specific feature of the crypto market is the high correlation and regression of the vast majority of assets to market averages. The trading idea is to buy the asset that has deviated down the most and sell the assets that have deviated up the most. But with a deeper assessment of liquidity risks, catalysts for growth/decline and the potential of each individual component of the basket (hereinafter, legs).
Initial selection
First, you need to select the leaders of growth/decline. The Market ratio tool is used for this.
To assess the liquidity of an instrument, the DOM and Net open interest indicators are used, as well as the Predict Liquidations widget:
- Assets where Net taker short clearly prevails over Net taker long, and most of the pending orders are above the current prices, are considered optimal for opening a long position and undesirable for opening a short position.
- Assets where Net taker long clearly prevails over Net taker short, and most of the pending orders are below the current prices, are considered optimal for opening a short position and undesirable for opening a long position.
To assess growth catalysts, the Manipulation monitor model and the DOM indicator are used.
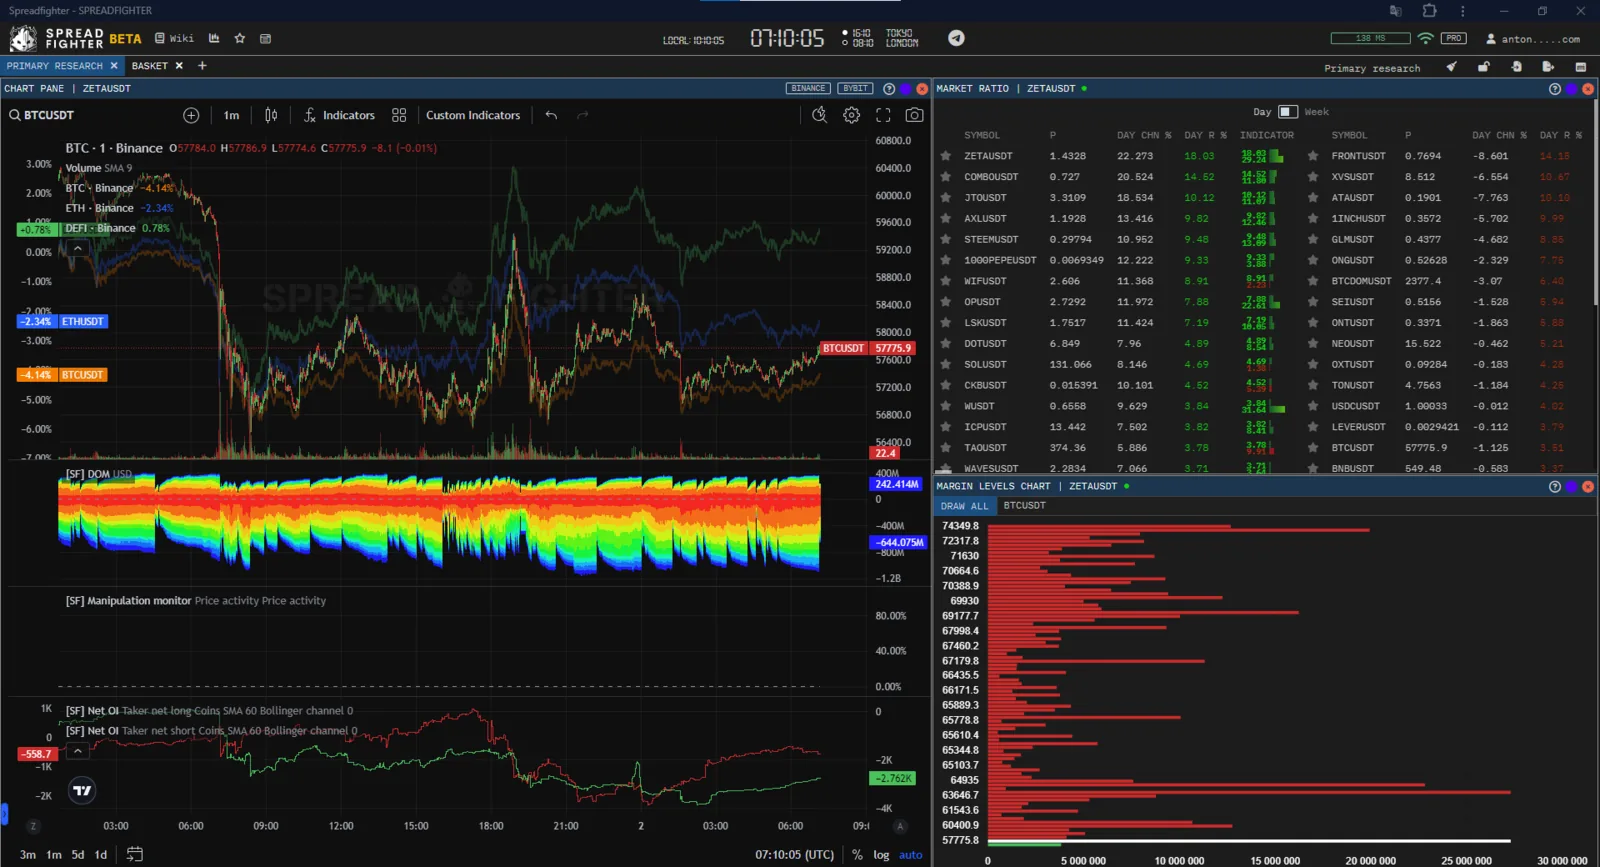
Workspace for assessing assets
The trade date is 2 May 2024.
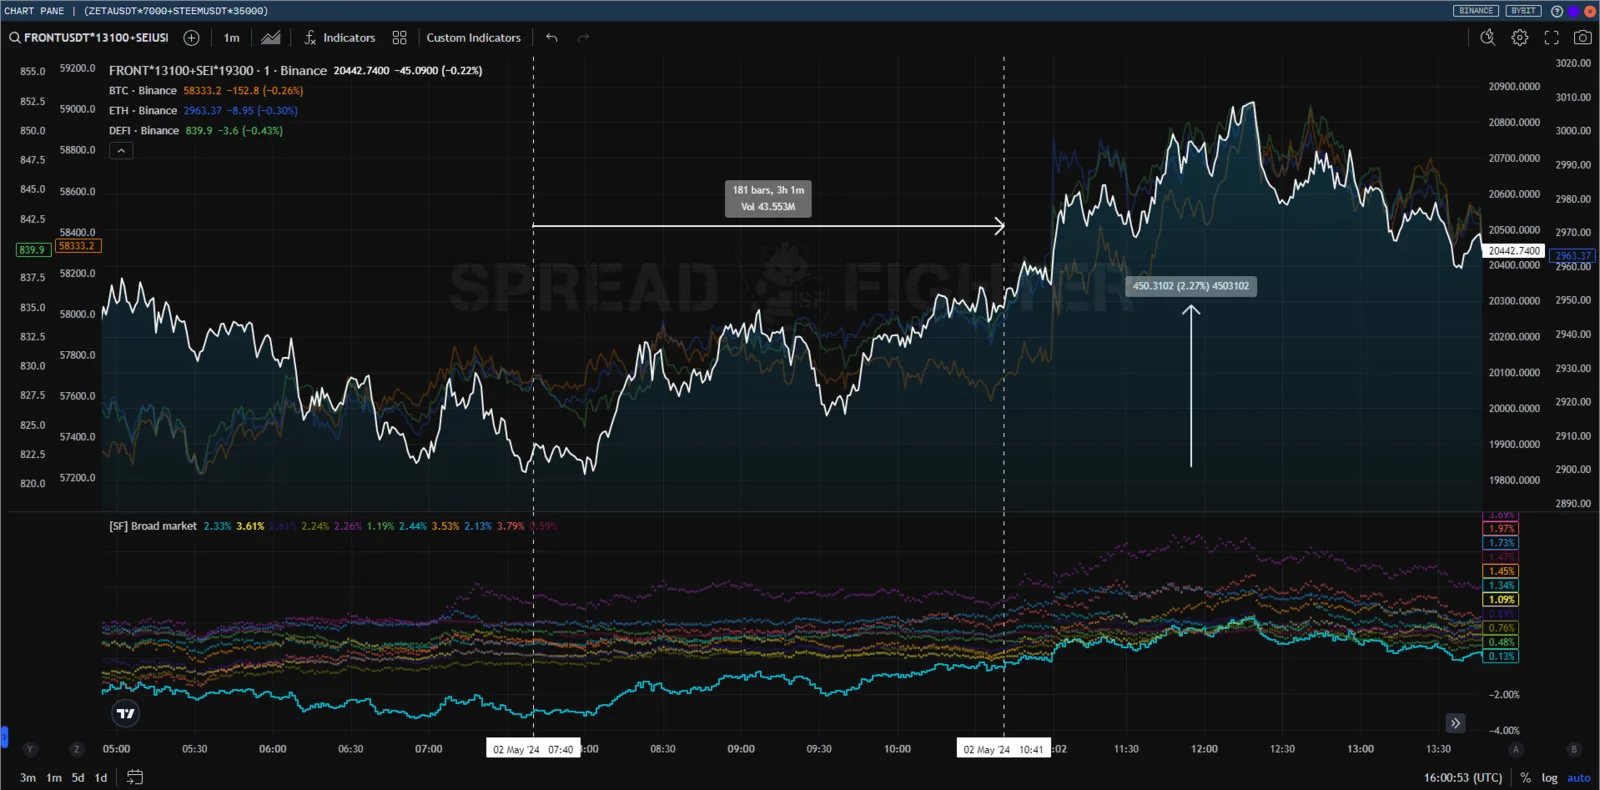
- The growth leaders at that time were: COMBO, JTO, LSK, PEPE, WIF, STEEM, ZETA.
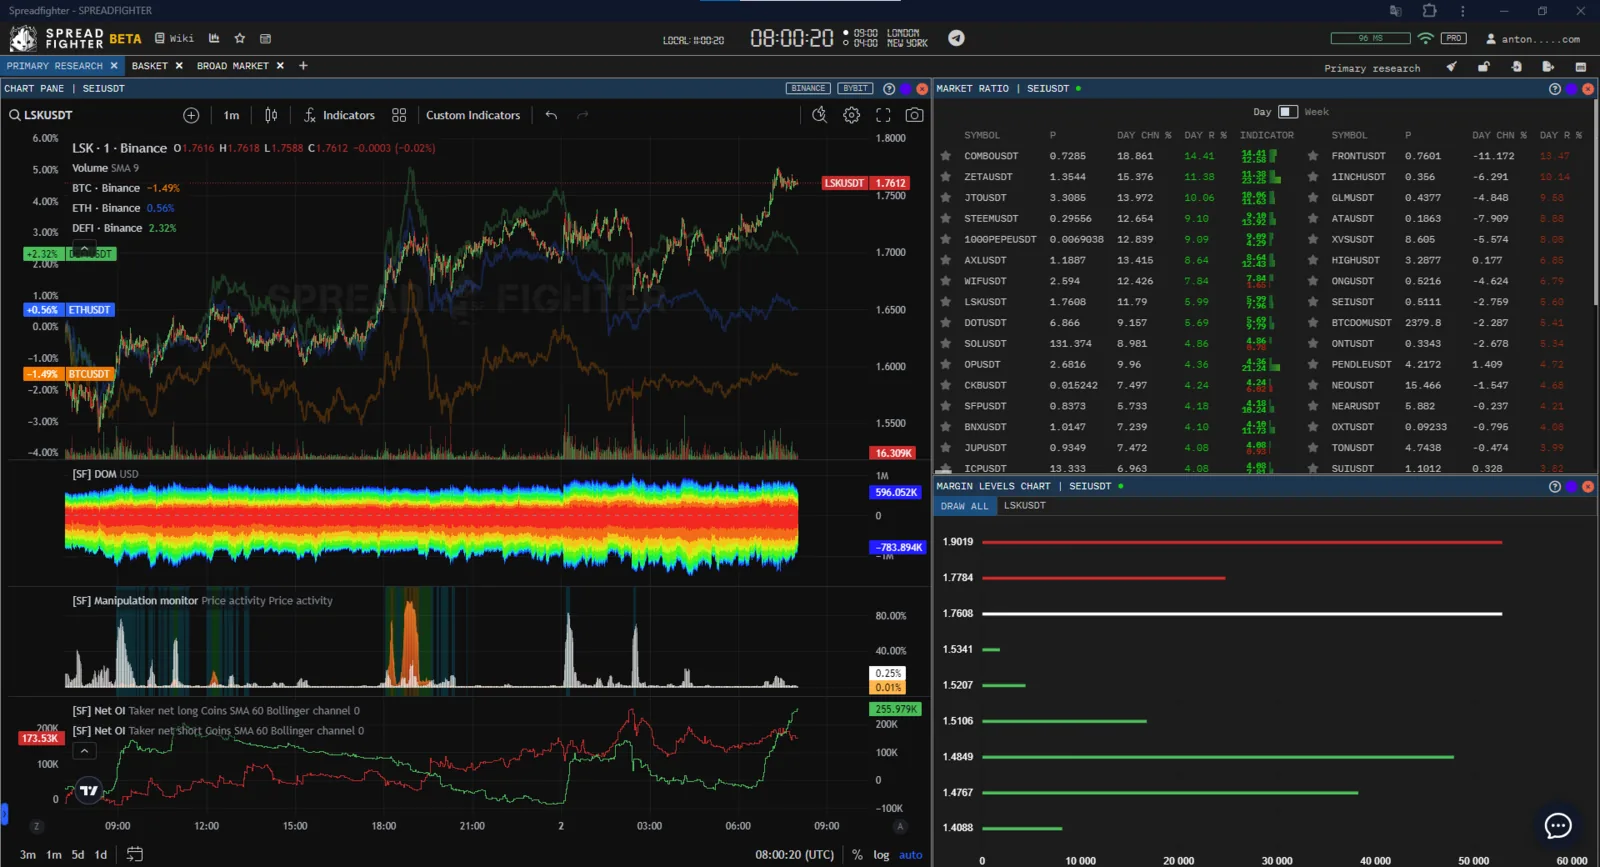
- The decline leaders were: ONG, 1INCH, ATA, GLM, XVS, FRONT, SEI.
Let us analyze each of the selected assets.
COMBO, JTO, LSK, PEPE, WIF - Net taker short prevails over Net taker long, and according to the Predict Liquidations model most of the pending liquidity is above the current prices. Despite the extreme positive deviation from overall market conditions, the assets are undesirable for opening short positions.
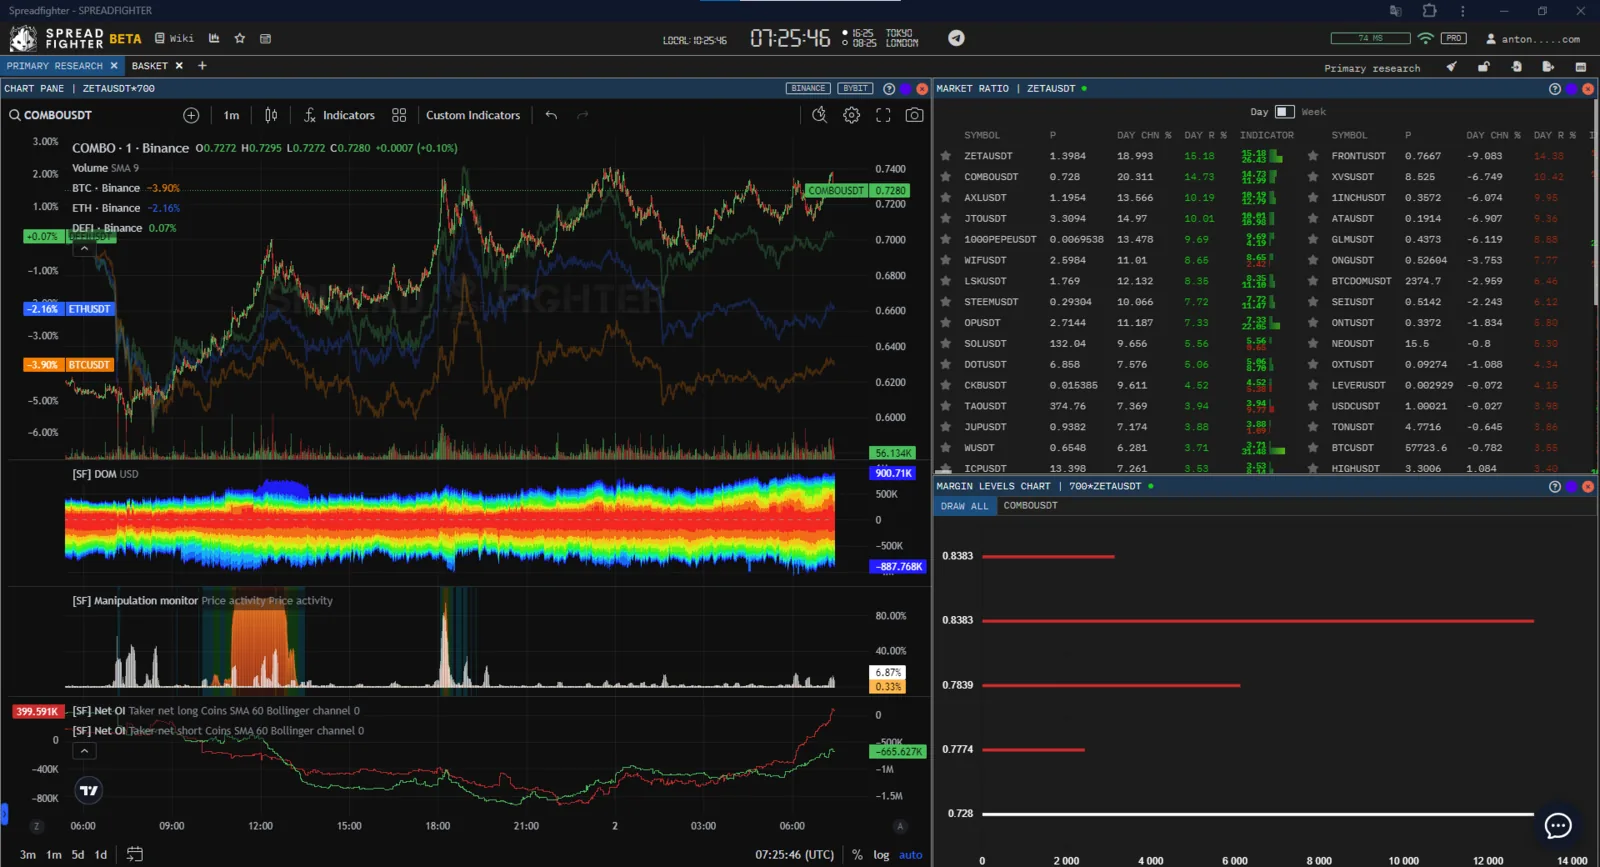
COMBO
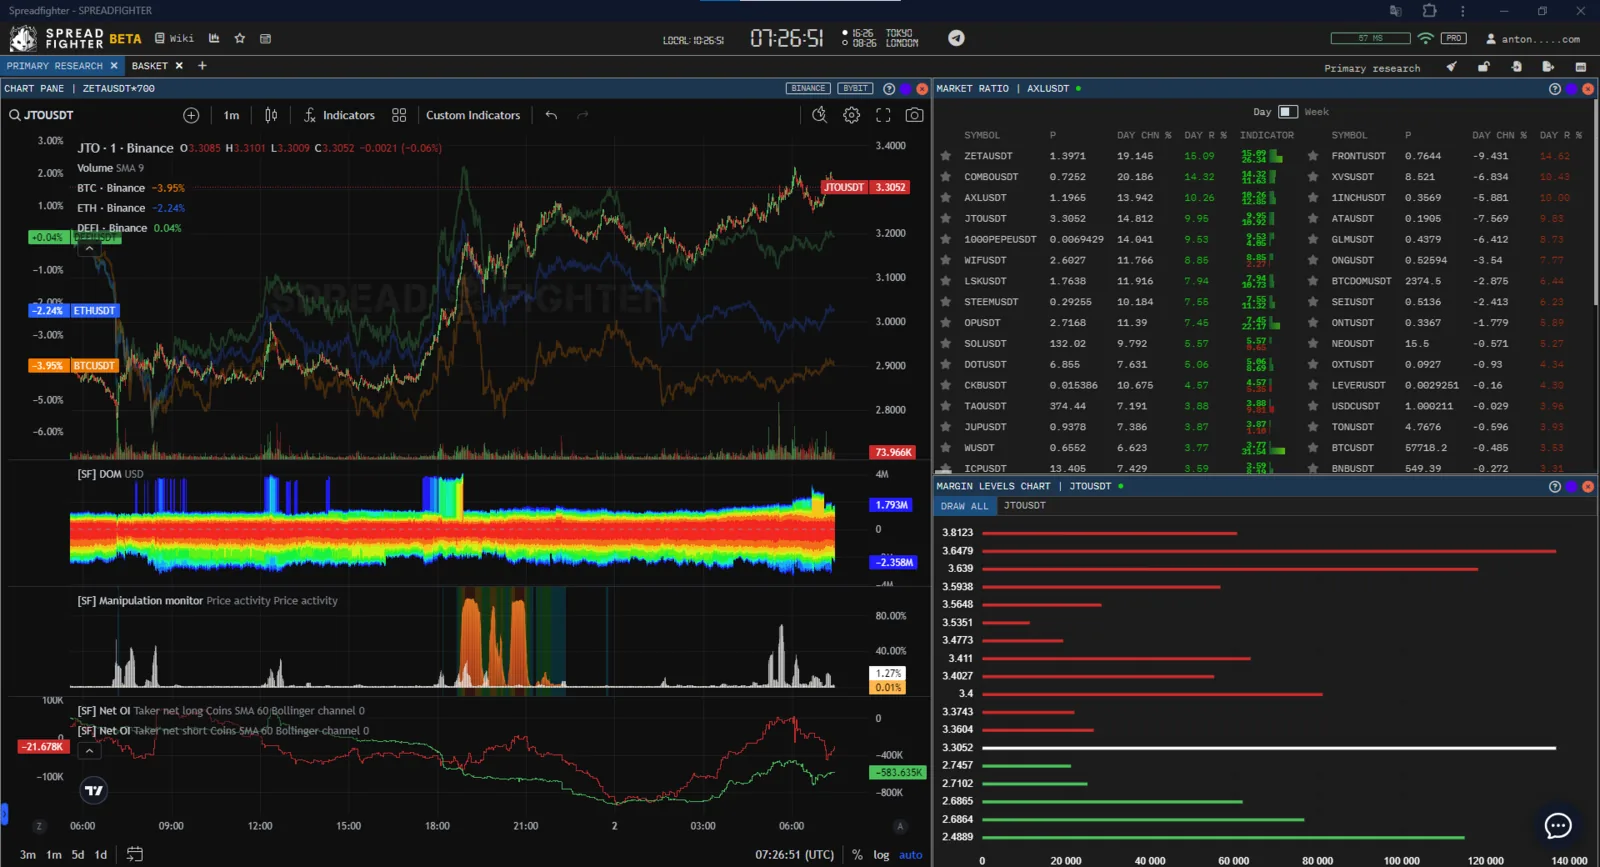
JTO
LSK
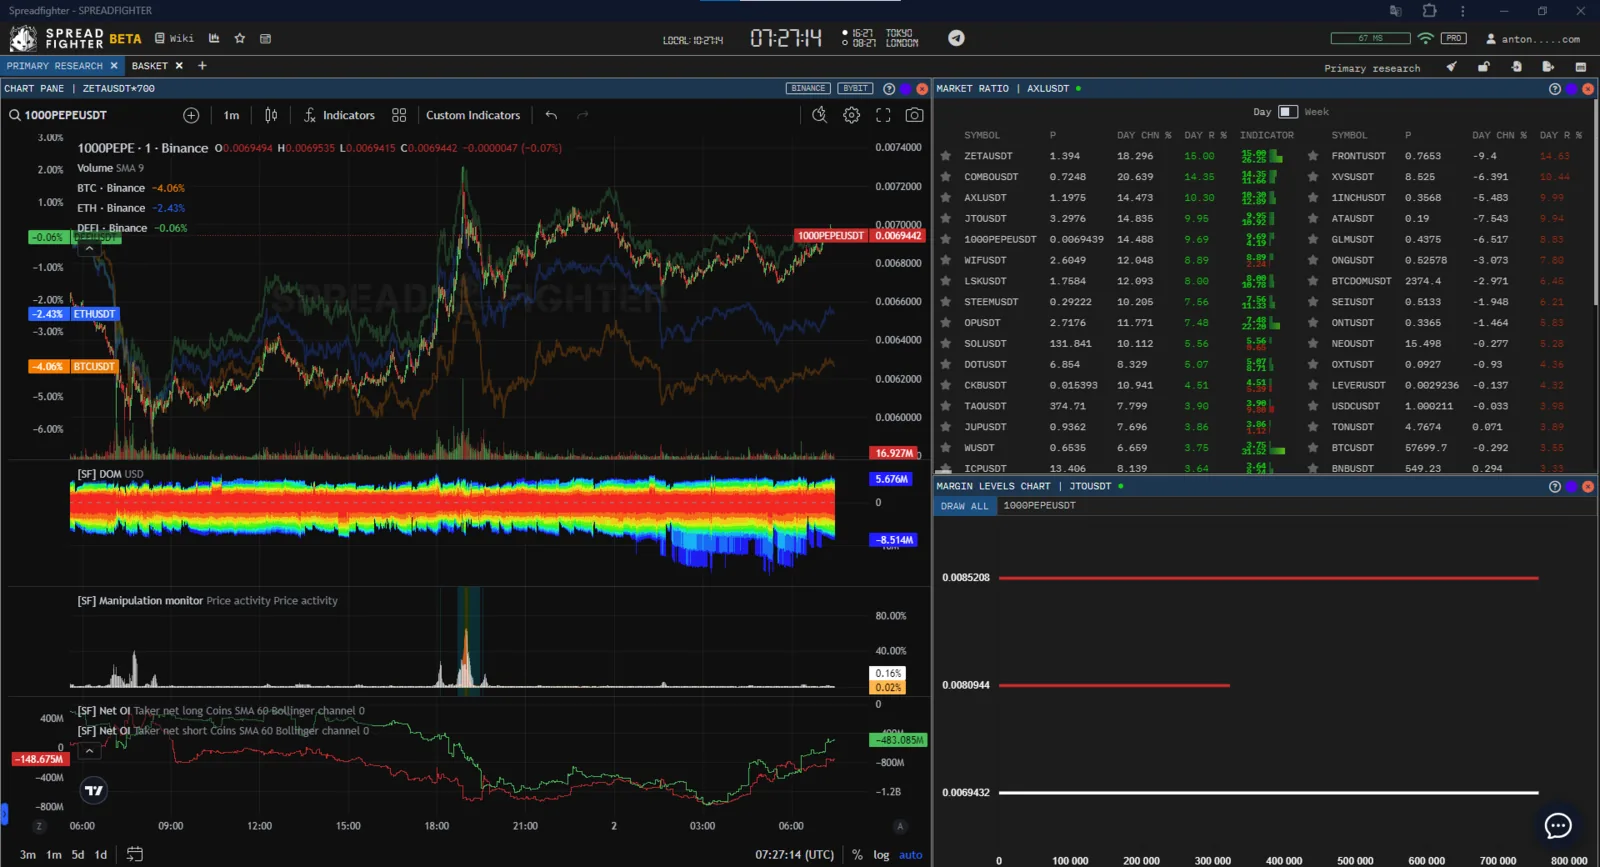
PEPE
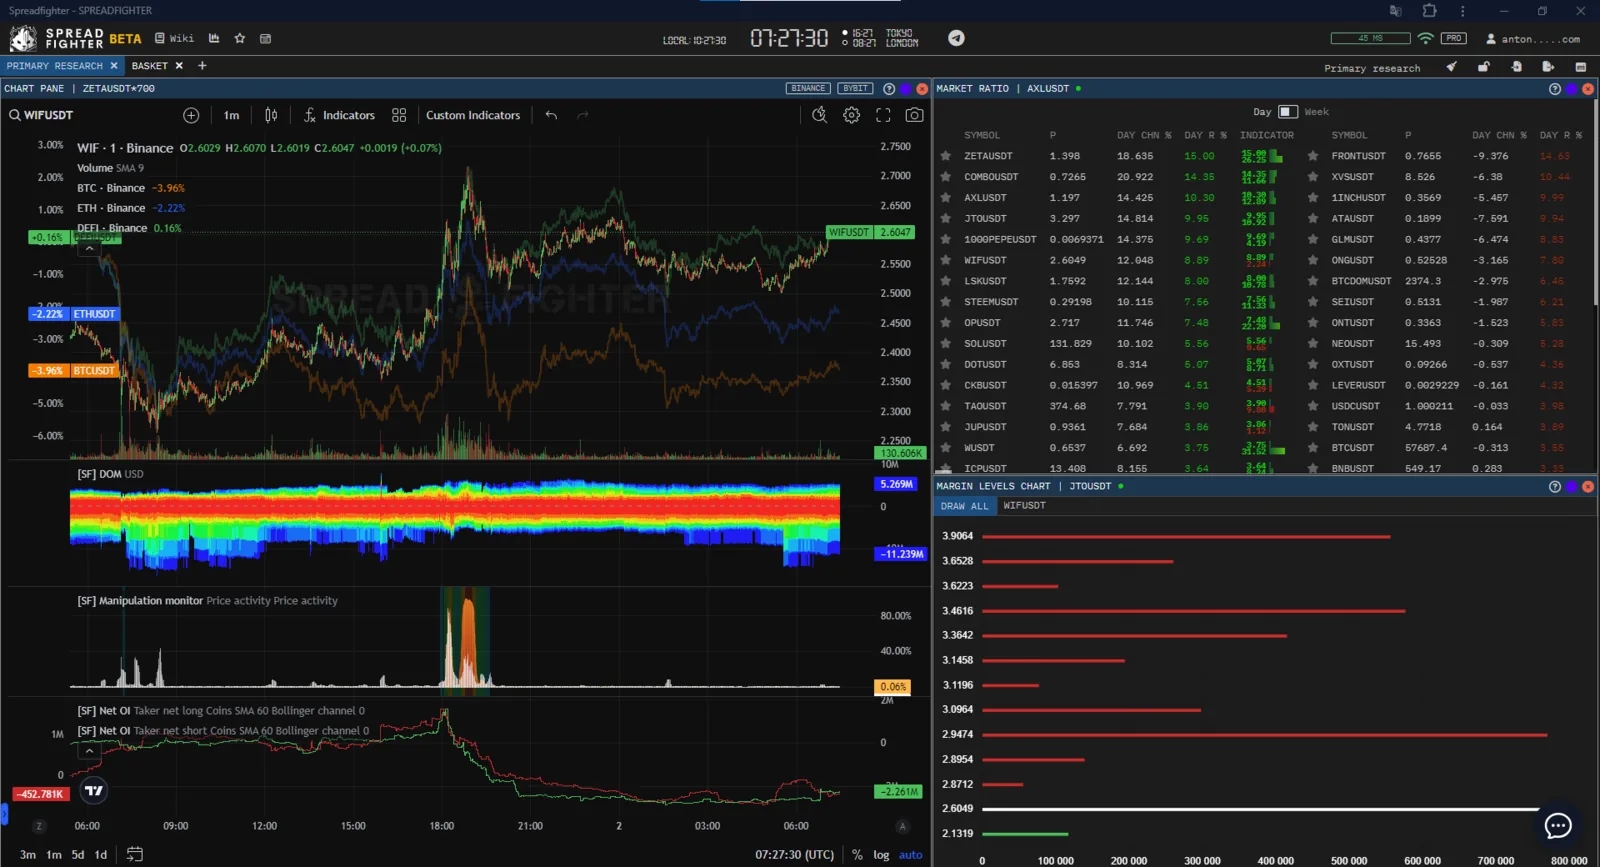
WIF
STEEM, ZETA - Net taker long prevails over Net taker short, and according to the Predict Liquidations model most of the pending liquidity is below the current prices. The assets are suitable for opening short positions.
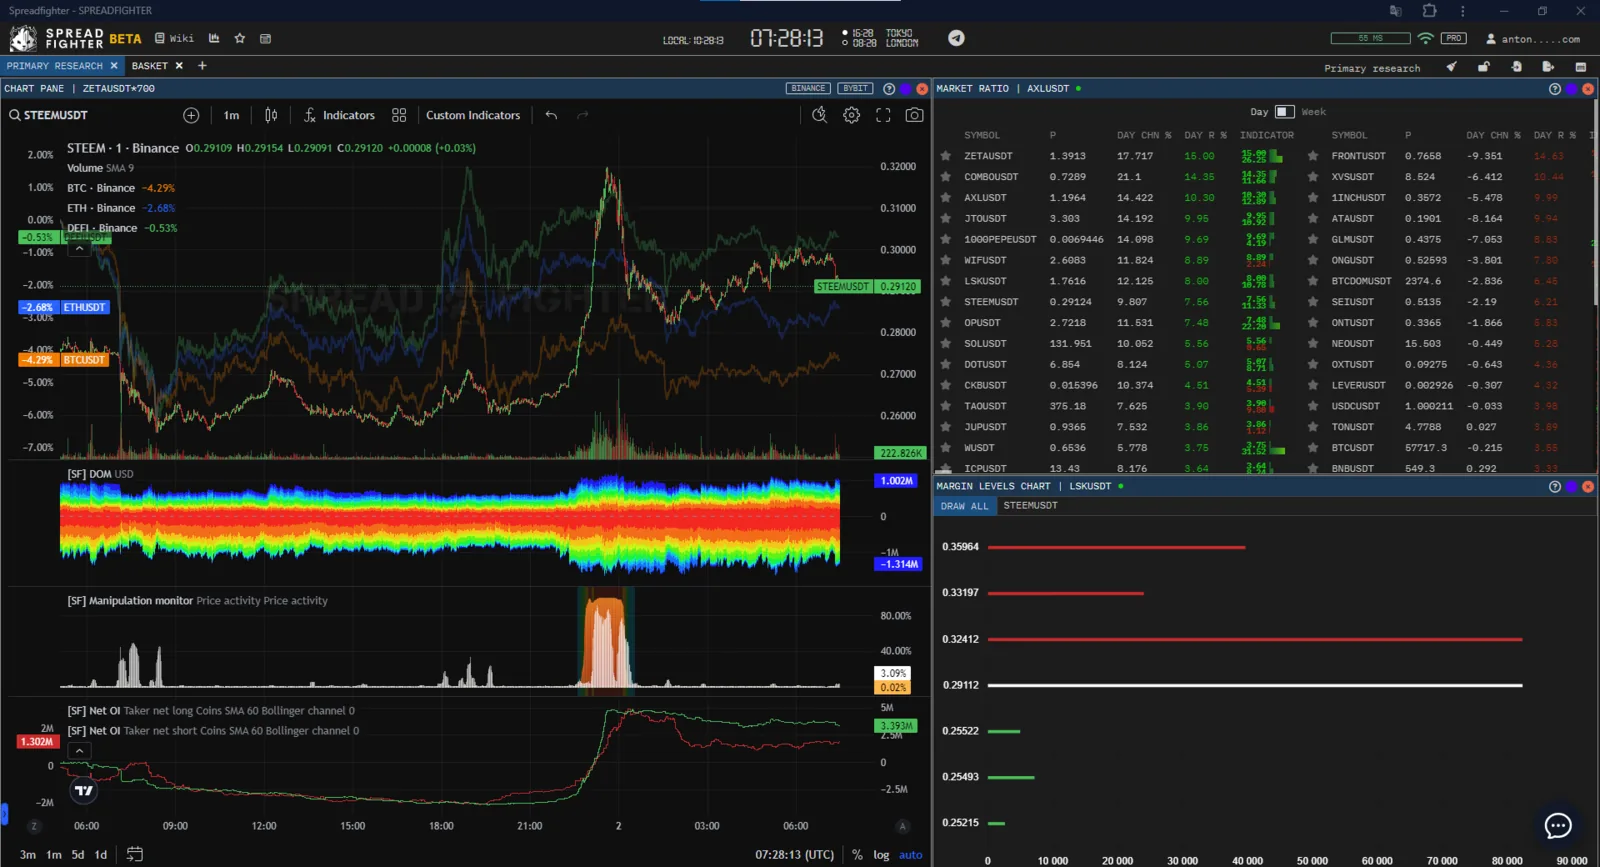
STEEM
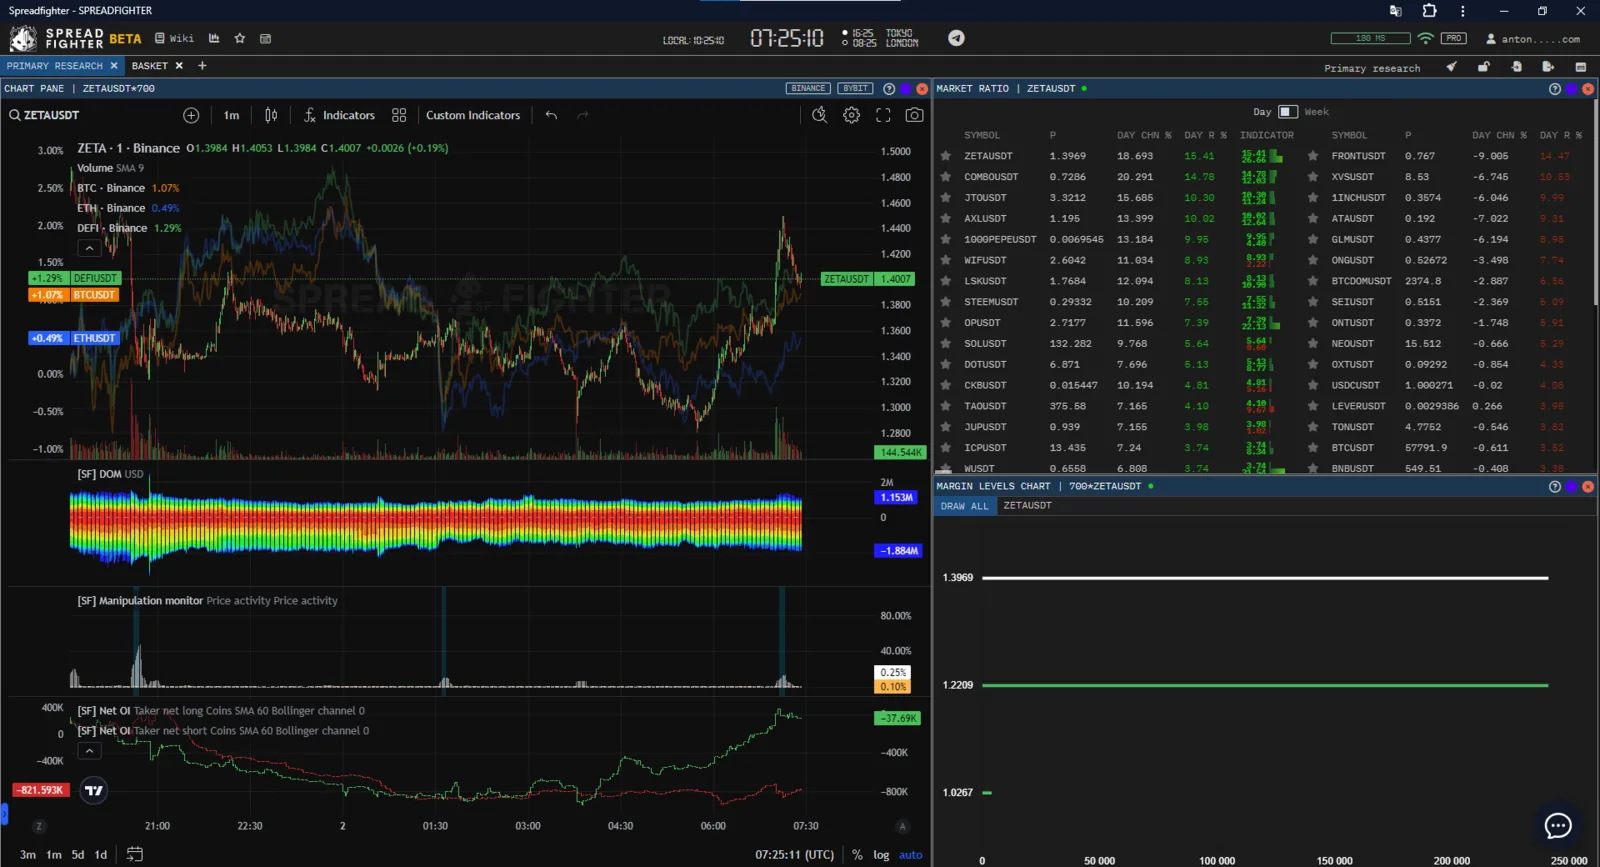
ZETA
ONG, 1INCH, ATA, GLM, XVS - Net taker long prevails over Net taker short, and according to the Predict Liquidations model most of the pending liquidity is below the current prices. Despite the extreme positive deviation from overall market conditions, the assets are undesirable for opening long positions.
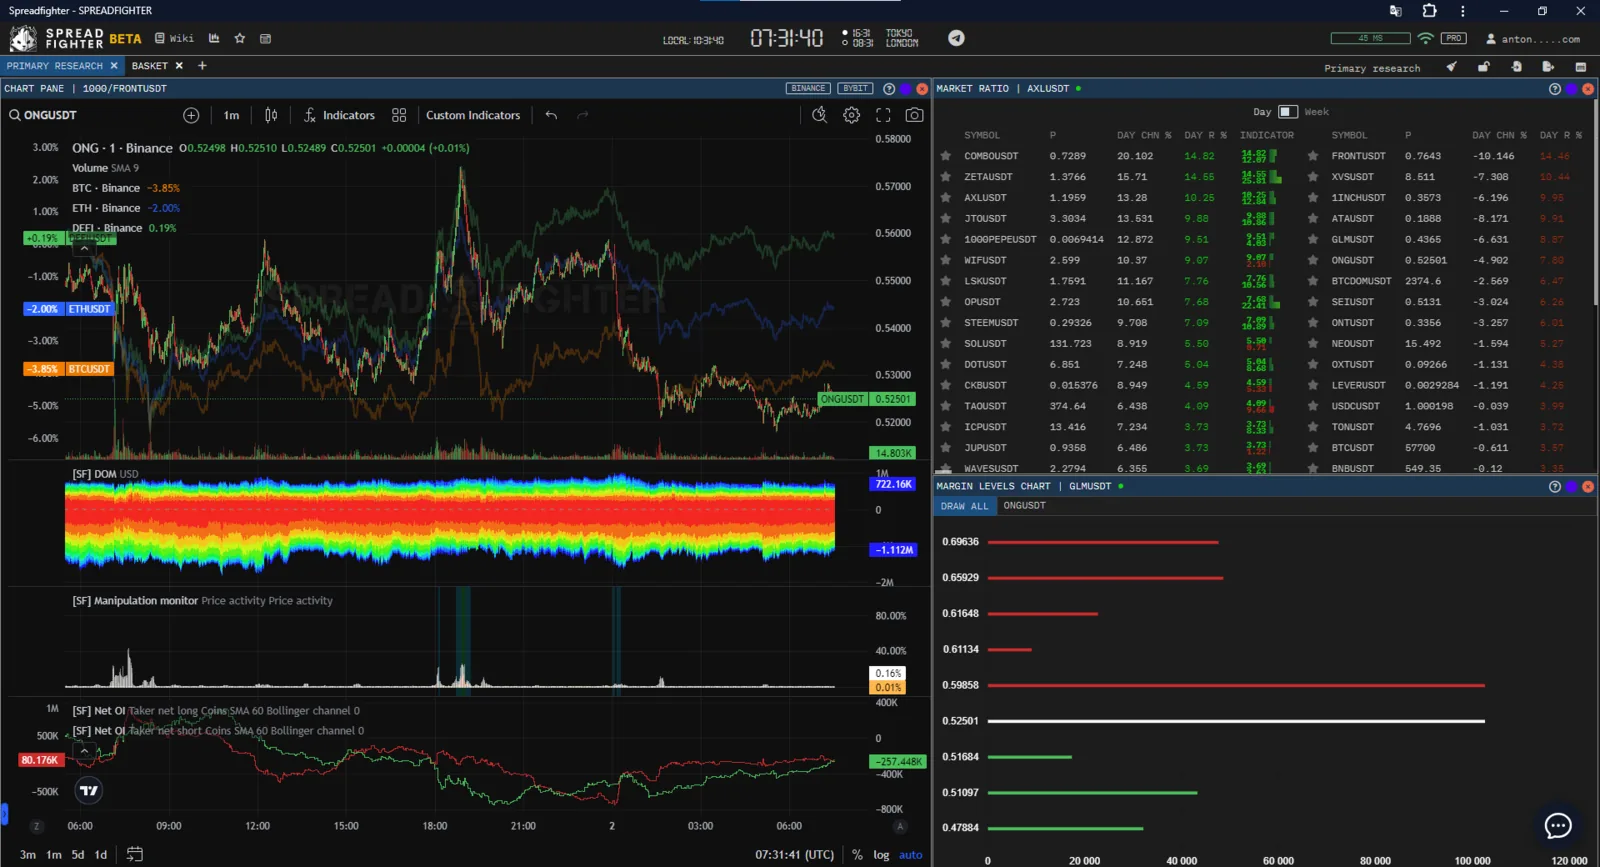
ONG
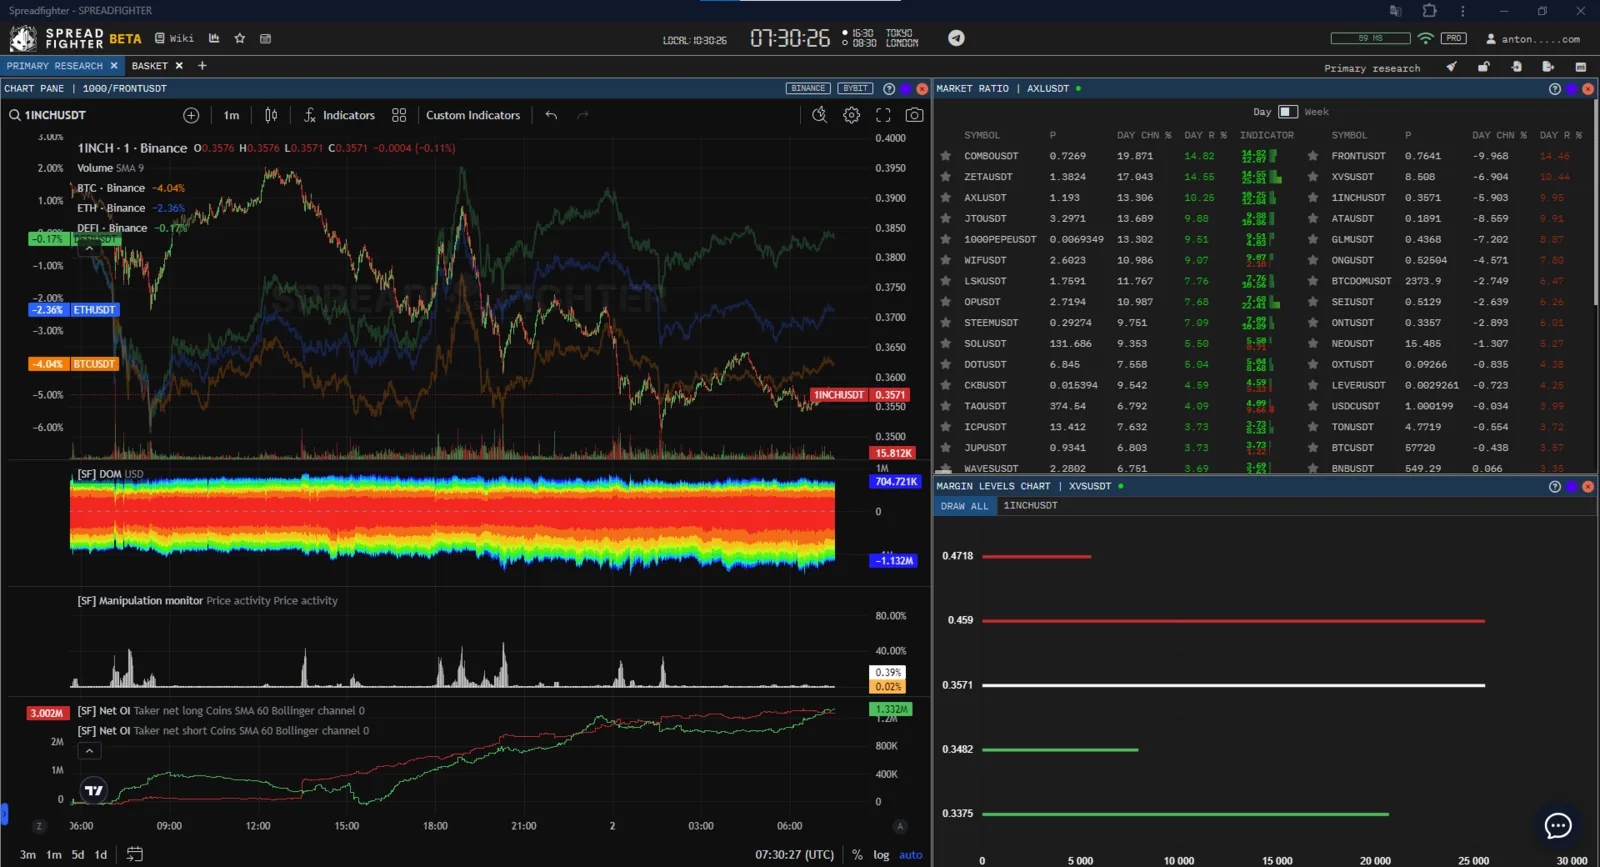
1INCH
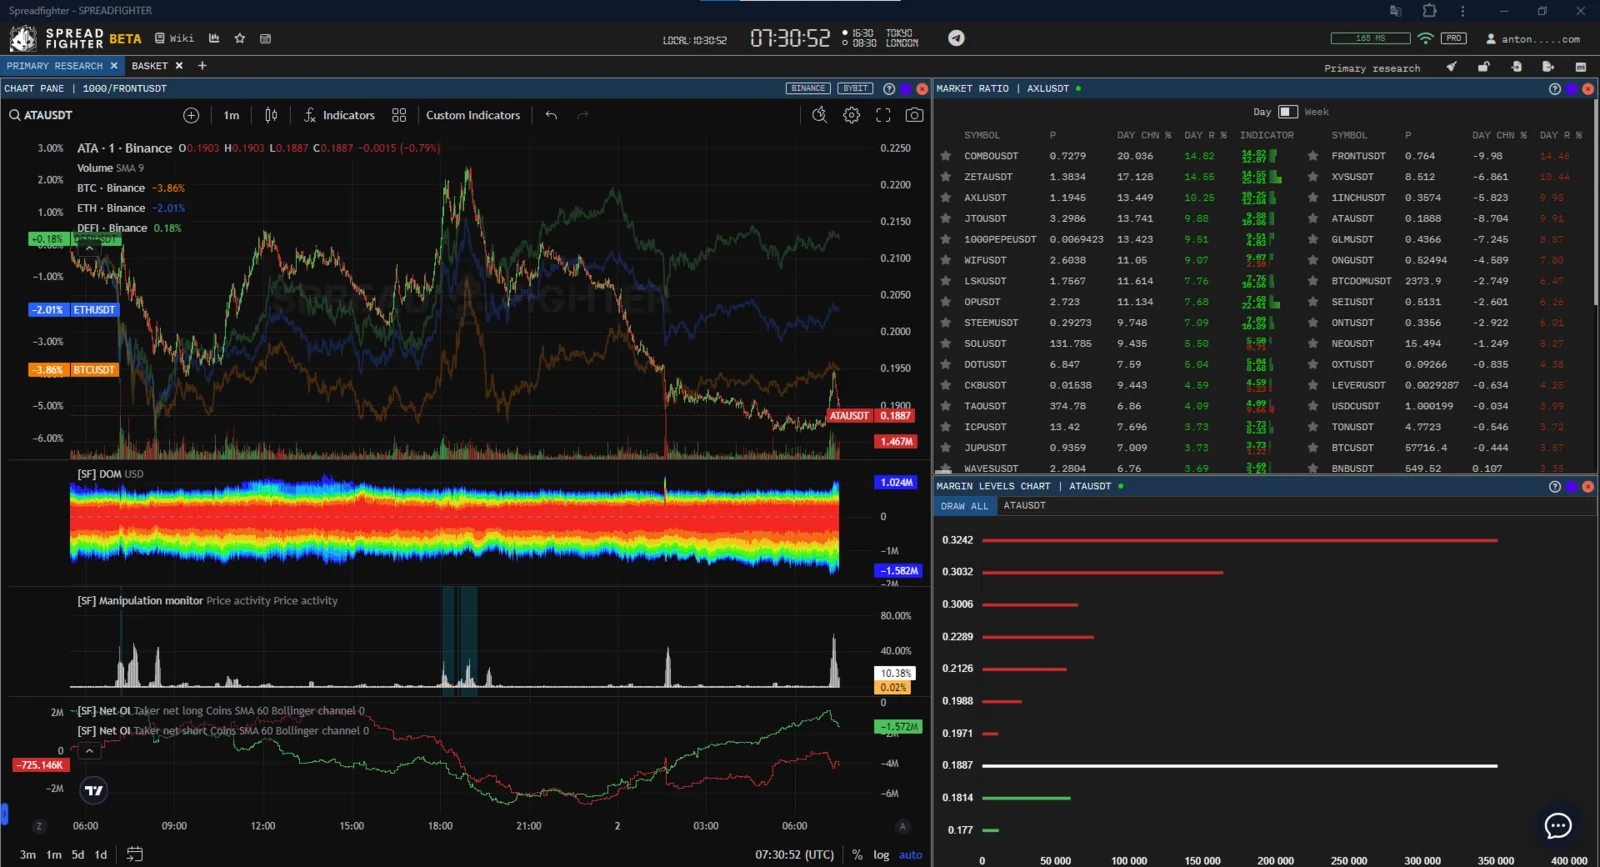
ATA
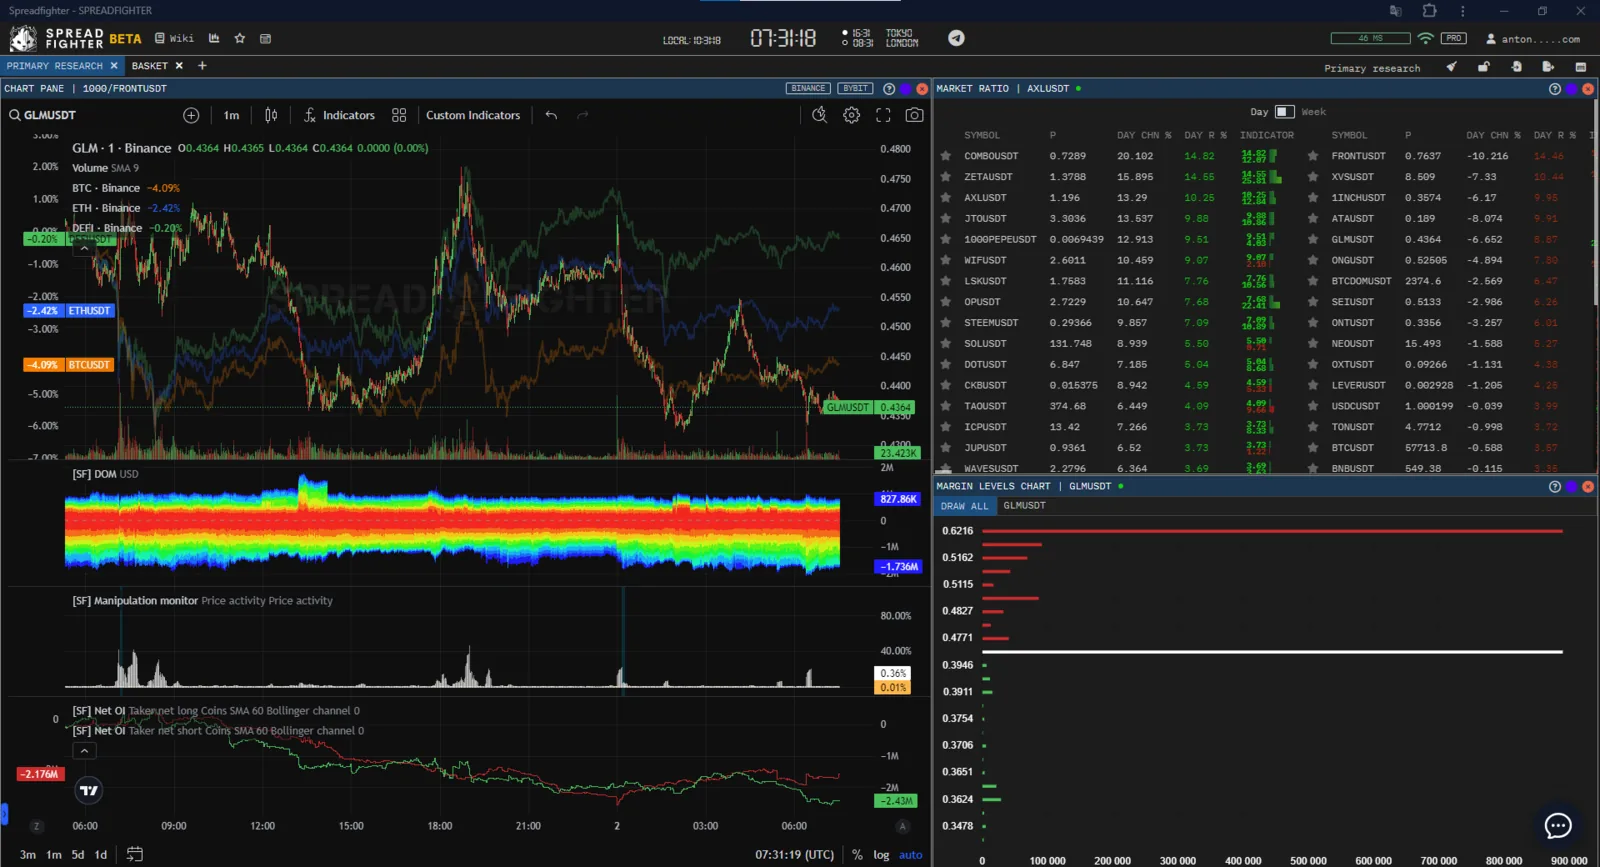
GLM
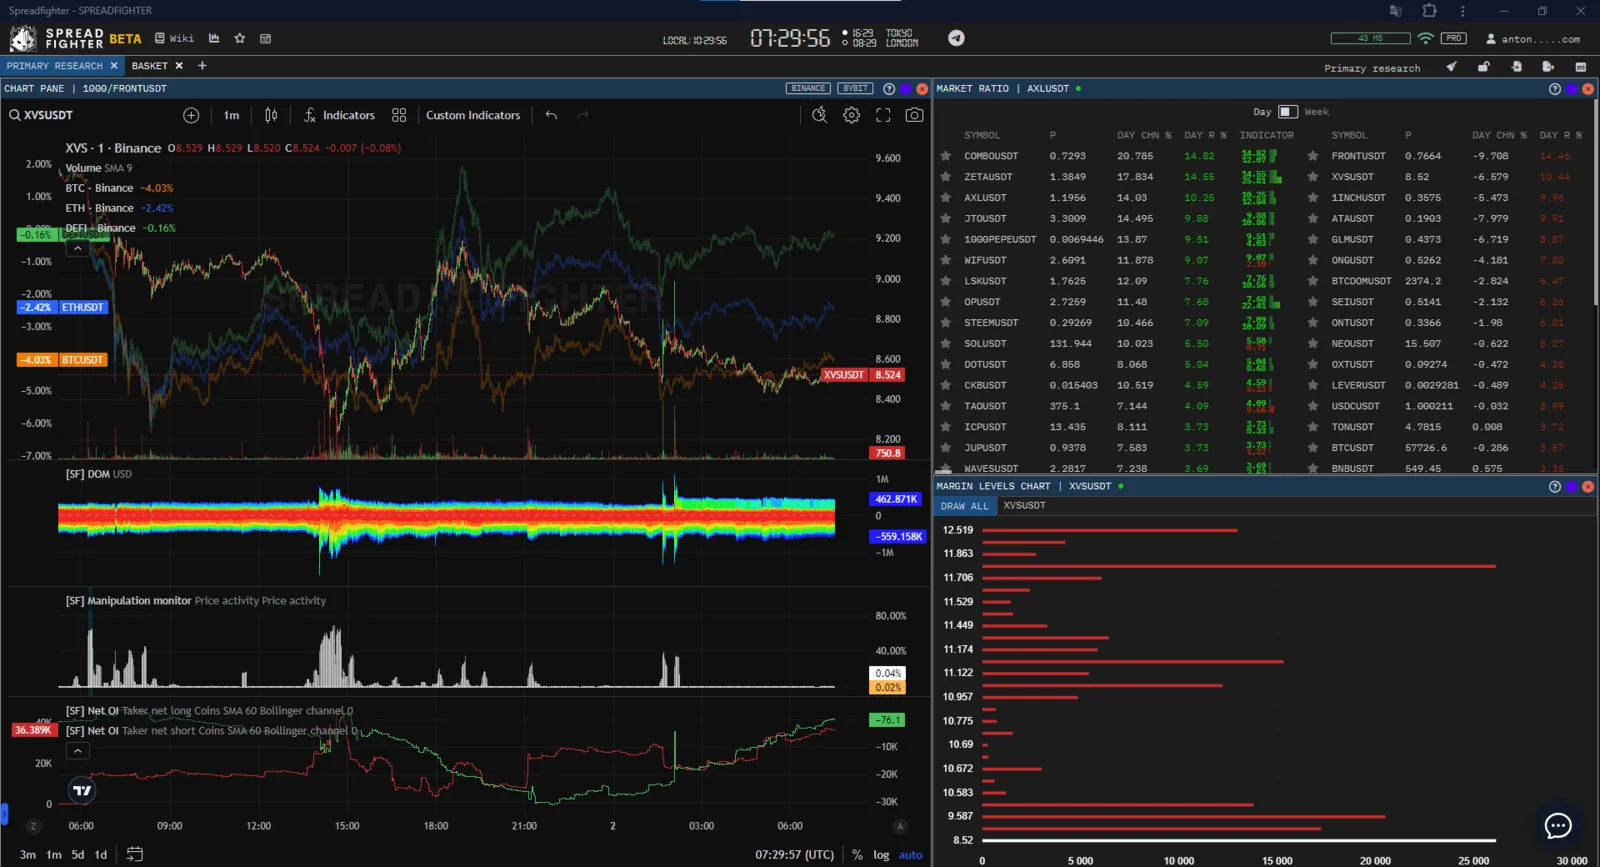
XVS
FRONT, SEI - Net taker short prevails over Net taker long, and according to the Predict Liquidations model most of the pending liquidity is above the current prices. The assets are suitable for opening long positions.
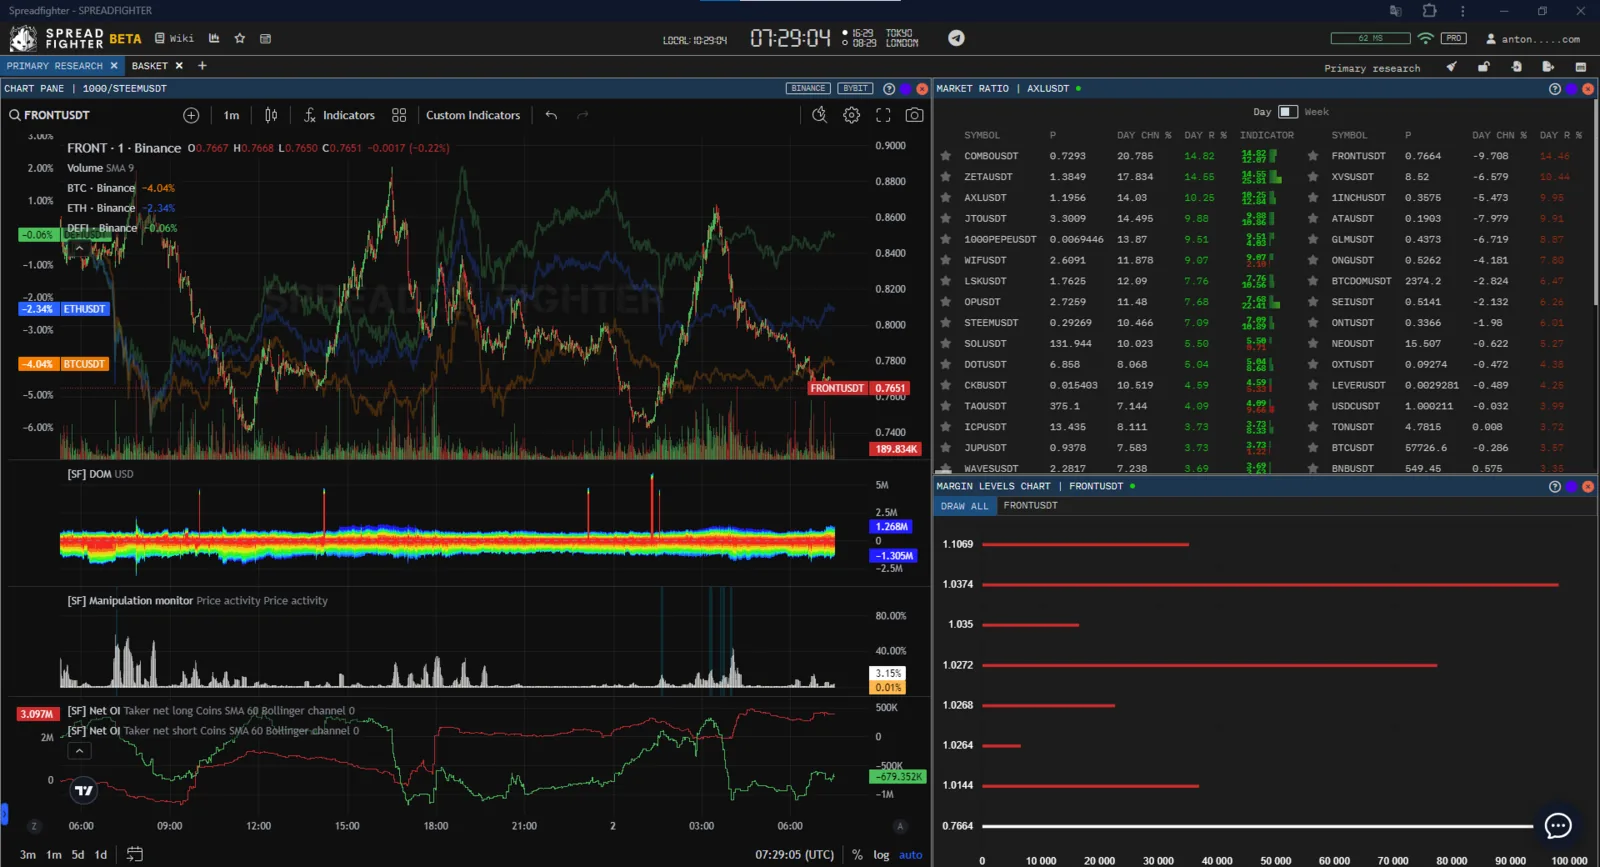
FRONT
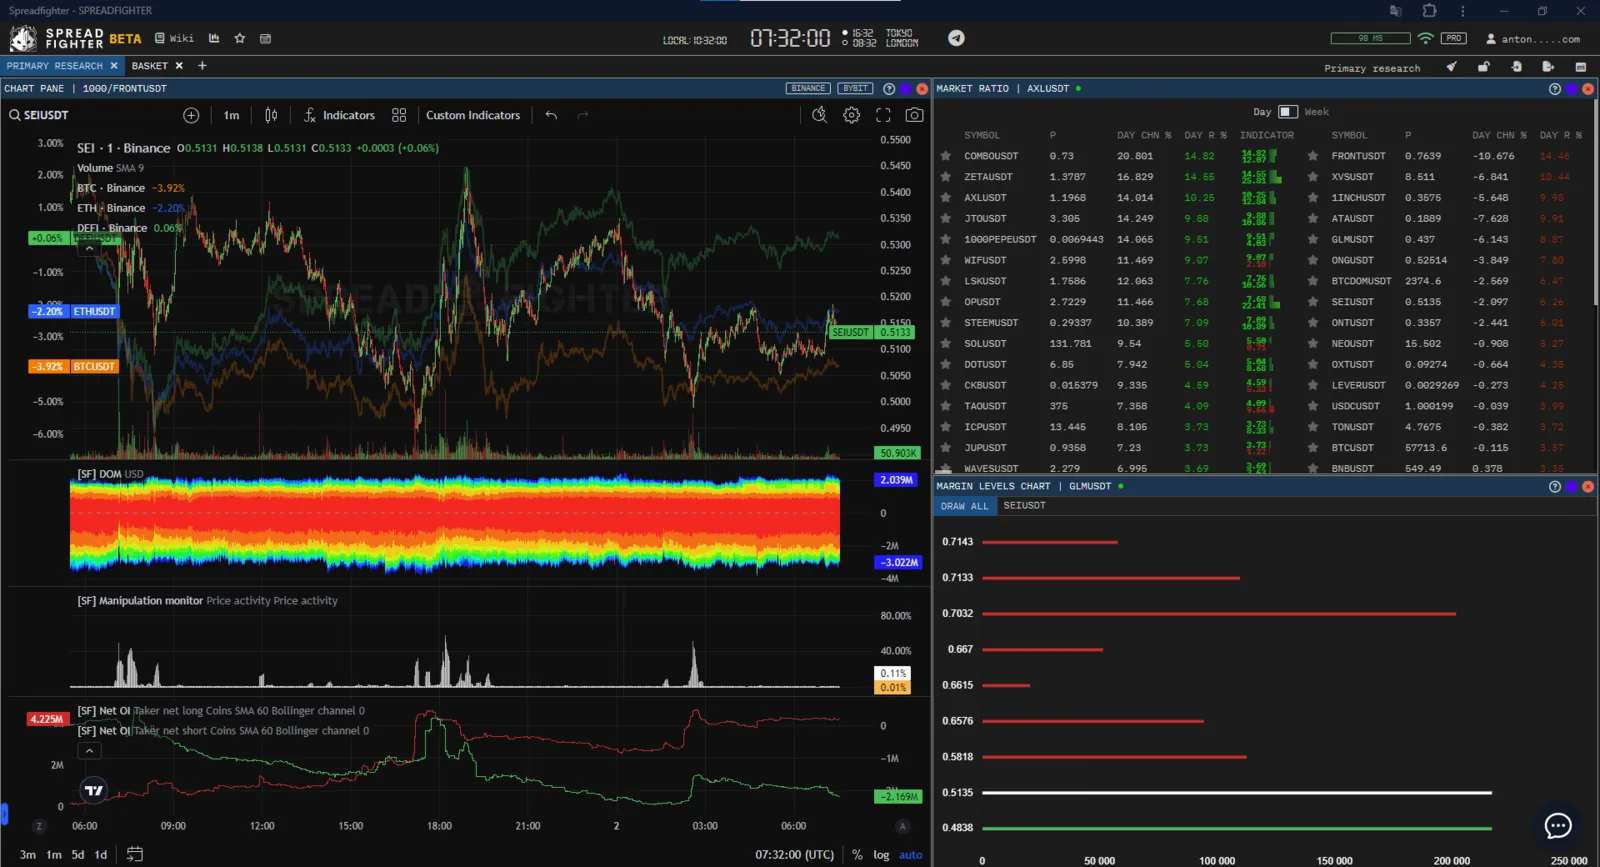
SEI
The trader's task was to find assets with the strongest divergence between pending liquidity and the open interest of the taker side.
Building the basket and managing the position
Basket composition:
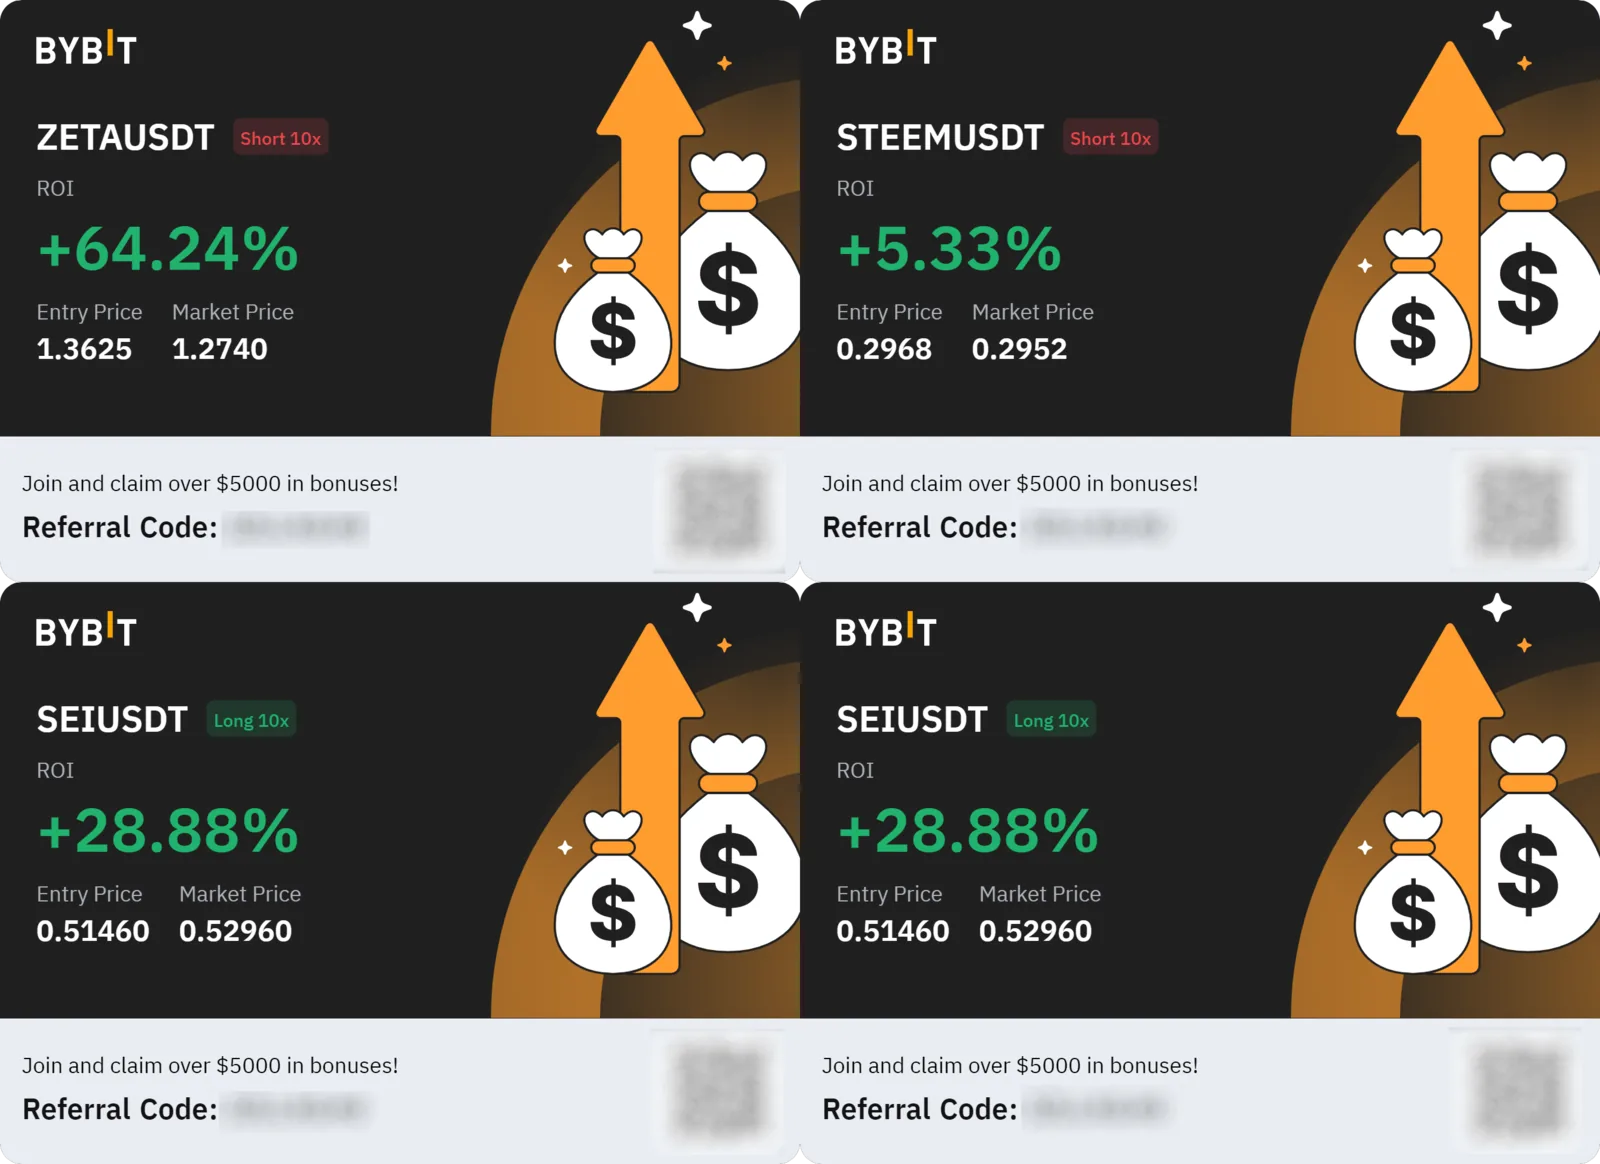
- ZETAUSDT Perpetual short
- STEEMUSDT Perpetual short
- FRONTUSDT Perpetual long
- SEIUSDT Perpetual long
To plot the price chart of the synthetic basket, all assets must be weighted. The coefficients were obtained by dividing the amount allocated in dollars by the price of the specific asset at the time of consideration.:
| Symbol | Coefficient |
|---|---|
| ZETA | 7000 |
| STEEM | 35000 |
| FRONT | 13100 |
| SEI | 19300 |
Final basket ticker: (ZETAUSDT7000+STEEMUSDT35000)/(FRONTUSDT13100+SEIUSDT19300)

Open synthetic position on the exchange
The opening price of the synthetic position was ~1. Target price: 0.95-0.93, as well as the return of individual legs to the average fair market values according to the Broad market indicator.
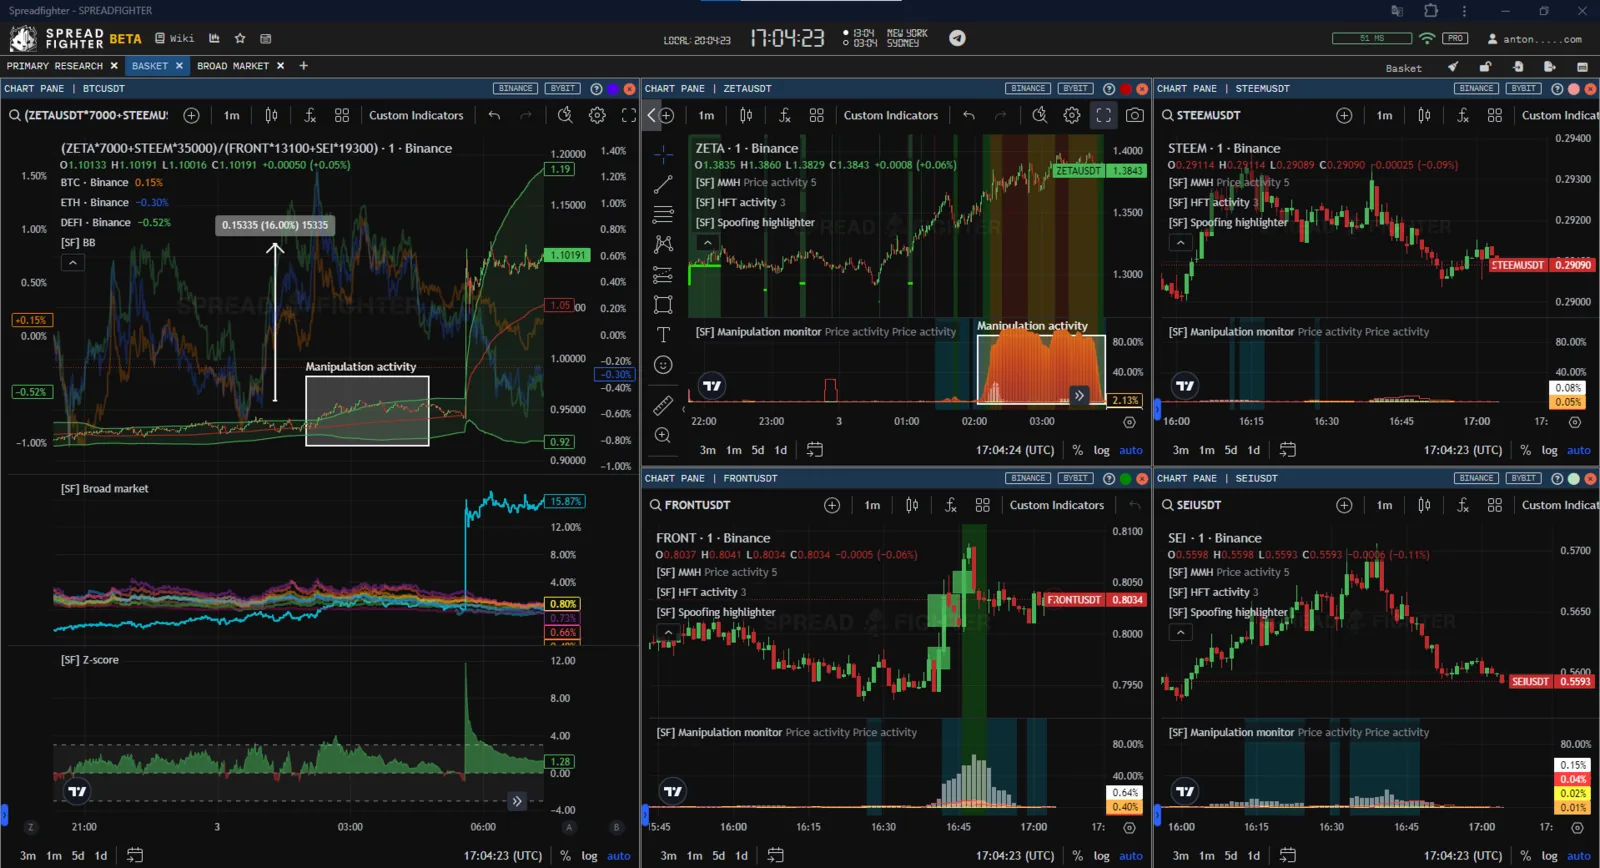
Each leg is monitored with the Manipulation monitor model for the appearance of toxic quoting of the instrument. If it appears, the whole position is closed.
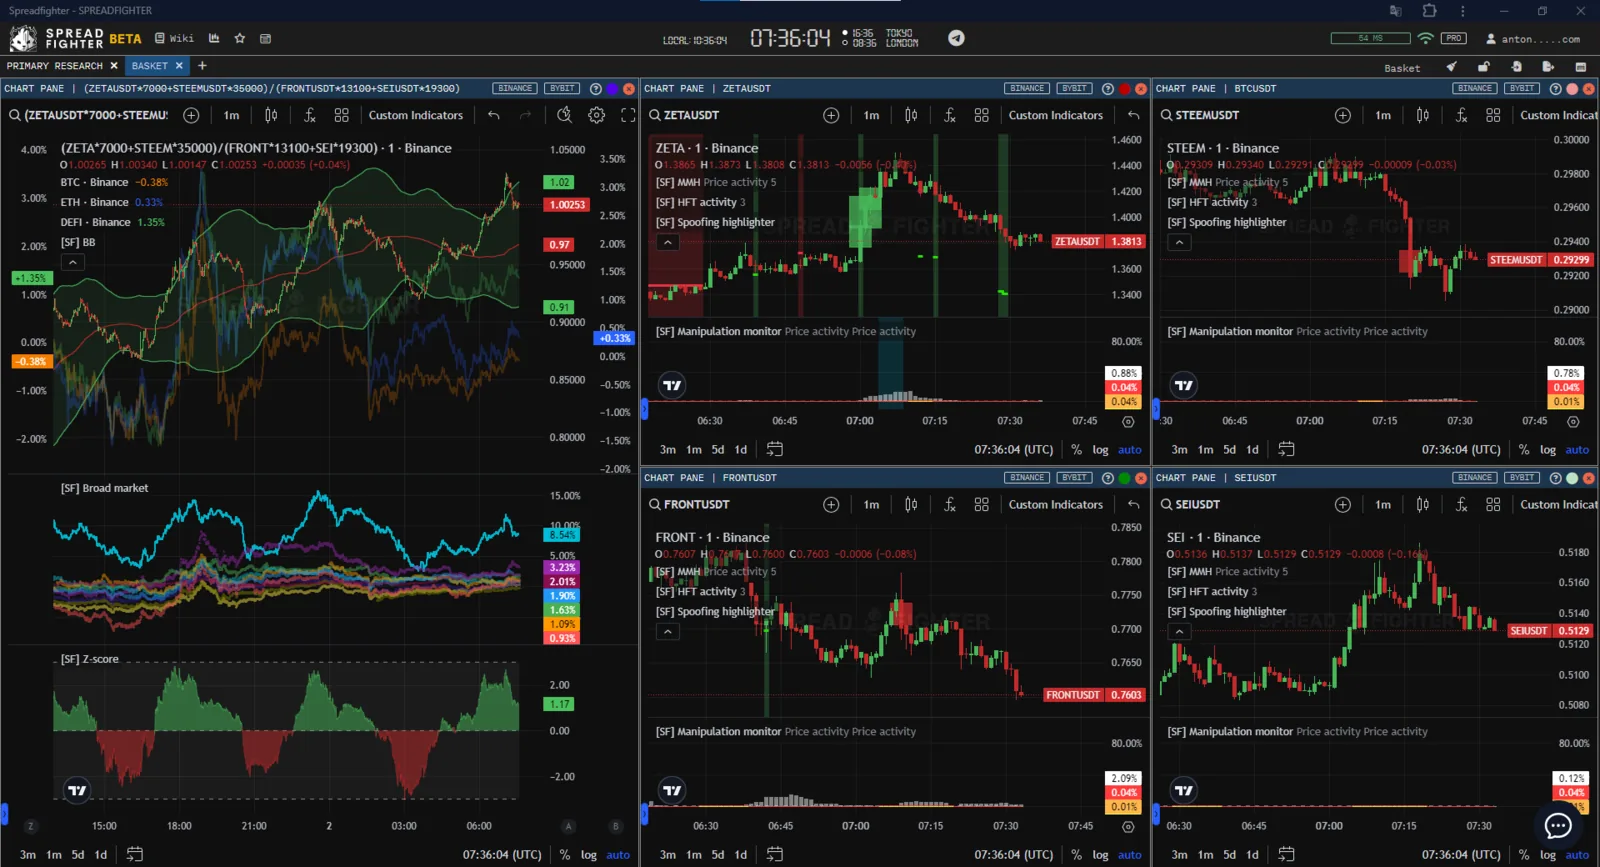
Workspace for monitoring the position
Alerts are used as an auxiliary tool to reduce the influence of the human factor on risk management. They track the following parameters:
- Price activity of the Manipulation monitor model for each instrument.
- Volume activity of the Manipulation monitor model for each instrument.
- The price of the synthetic basket.
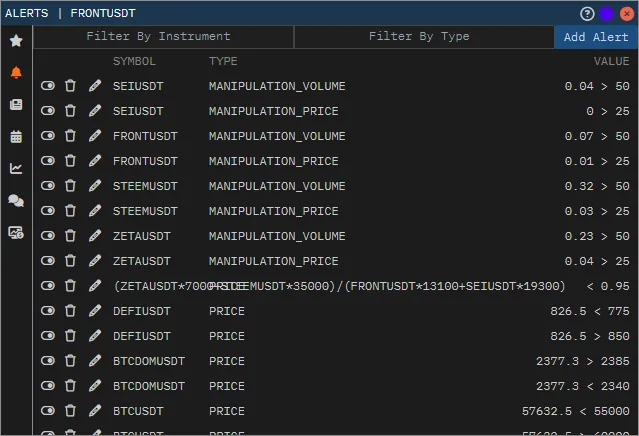
Alerts
After ~3 hours all legs of the basket came to their fair average values.
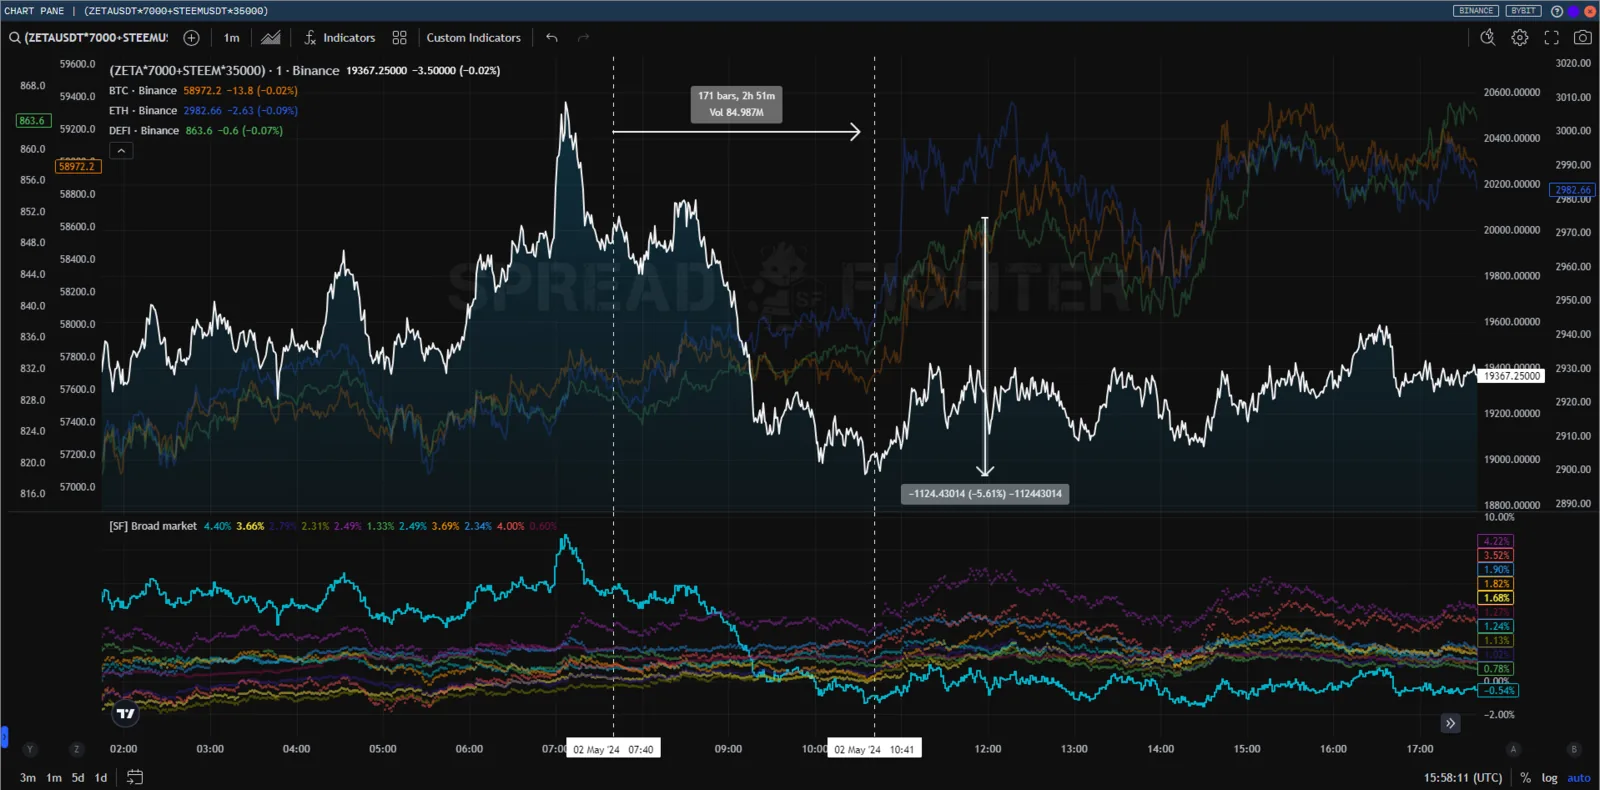
Short legs
Long legs
In this example all legs were closed at a profit. However, this is not a required condition when trading synthetic instruments. What matters is that the profit on the profitable legs covers the loss on the losing ones, and the total P&L is positive.
Trade results

Trade results
Why it is important to control manipulation risk
The position was closed ~3 hours after opening. However, 20 hours later a very telling example occurred in one of the legs, ZETA. A day later toxic activity appeared in the coin, and the Manipulation monitor model warned the trader about it. About 4 hours after that, the coin rose 30% in less than a minute. A long position in this leg would have cost the whole basket a loss of ~15%.
This situation clearly shows why holding mean reversion positions in coins with toxic activity is risky.
ZETA manipulation
Mean reversion trading of pump&dump stocks
Trading idea: find a pump that has diverged from the market, understand who is driving it and how, and open a short mean reversion position only after the climax has passed. Use Market ratio to find candidates. Use Spot perpetuals dominance, Net open interest and Liquidations to read the trade flow. Use Manipulation monitor, Layering highlighter and HFT activity to read the activity of the participant.
How pumps changed in 2025–2026
We reviewed 3,202 pumps on Binance futures from Aug 2023 to Nov 2026. A pump is a coin that rises 30% or more above the market within 24 hours. The organizers' behavior changed noticeably in the second half of 2025.
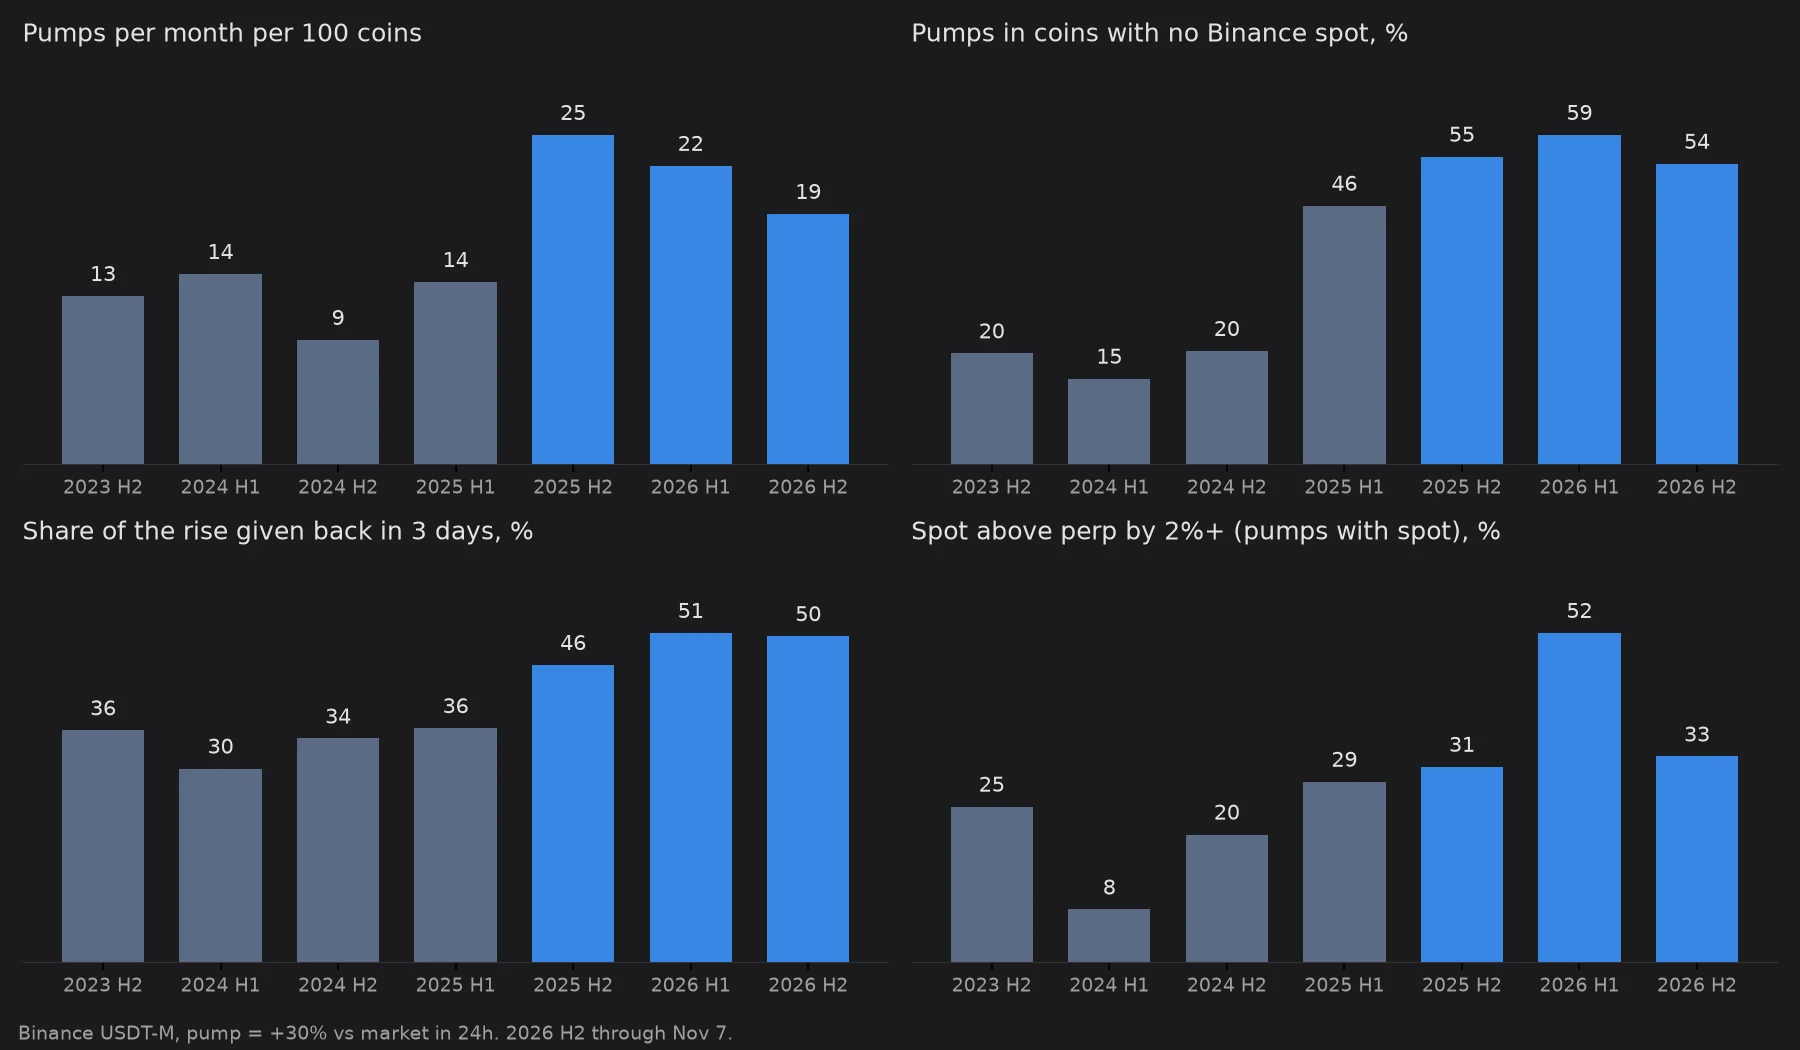
How pumps changed: gray is before Jul 2025, blue is after
- There are twice as many pumps. Until mid-2025 there were 9–14 pumps per month for every 100 coins. Since then there are 19–25.
- More than half of pumps happen in coins with no spot market on Binance. It used to be 15–20%. Now it is 46–59%. The "futures flow dominates spot flow" feature from the BNX case in 2024 was an exception. Now it is the norm.
- Spot is pushed more often to squeeze futures shorts. If a coin has spot, during a pump it increasingly trades more than 2% above futures. In 2024 this happened in 8–20% of pumps. In the first half of 2026 it happened in 52%. Thin spot is bought aggressively, the index price rises, futures lag behind, and funding goes deeply negative. Shorts pay funding and get liquidated.
- Pumps give back more. 3 days after the peak, the price retraces 46–51% of the gain on average, against 30–36% before. Where spot was pushed, it retraces 55%.
- But the first pullback is a trap. If you short mechanically after the first 10% pullback from the high, with a stop 5% above the high, about 40% of trades are stopped out by the second wave. Since Jul 2025 this approach averages +1.2% per trade before costs. Funding takes 0.7% on average, and 4.7% or more in the worst 5% of cases. After funding and fees, the average is +0.4% with a median of −0.7%: more than half of the trades lose money. Before Jul 2025 the result after costs was −2.4%. A blind short on every pump does not work, now or before.
Funding during a pump is the main hidden cost of a short. Binance moves the coin to hourly payments, and the rate hits the −2% cap. In the IOST case below, a short would have paid about 9% in funding alone over one day.
This gives the rule: do not open the short on the first pullback. Open it after signs of a climax: futures dropped first, short liquidations gave way to long liquidations, and the manipulation algorithms went quiet.
When spot is above futures
We also tested the "spot leads the pump" signal separately: the coin is pumping and spot trades 2% or more above futures. Since 2023 there have been 473 such events. What happened over the next 3 days:
| before July 2025 | after | |
|---|---|---|
| Funding paid by the short | −8.0% | −6.2% |
| Futures short after funding and fees, mean / median | −6.9% / −0.2% | +3.2% / +8.7% |
| Futures long and spot short after funding and fees, mean / median | +12.0% / +8.7% | +10.3% / +8.1% |
- Short. On such a pump, futures trade at a discount to spot and funding goes deeply negative: the short pays 6% on average over 3 days, and 19% or more in the worst 5% of cases. Against entering in the first hour of the pump with no spread condition, the edge is not statistically significant.
- Futures long and spot short for the same volume. The futures discount closes, and the futures long receives the negative funding. Positive in 471 of 473 events, and in every half-year since 2023. The bottleneck is the spot loan: in the snapshot of 7 Nov 2026 only a third of such coins could be borrowed, and for half of them the Binance borrow pool was empty. If you already hold the coin on spot, a swap gives the same position: sell spot and buy futures for the same volume.
You can track this spread with an alert: in the alert creation window, the "Spot over perp ≥ 2%" preset (Pro plan) fires when spot rises 2% above futures on any Binance coin. The same spread is shown on the chart by Spot perpetual dominance.
Case 1: IOST, 20–22 Oct 2026
On 20 Oct at about 10:00 UTC, IOST began to diverge from the market. Over 30 hours the price rose from 0.00074 to 0.00180, up 139%.
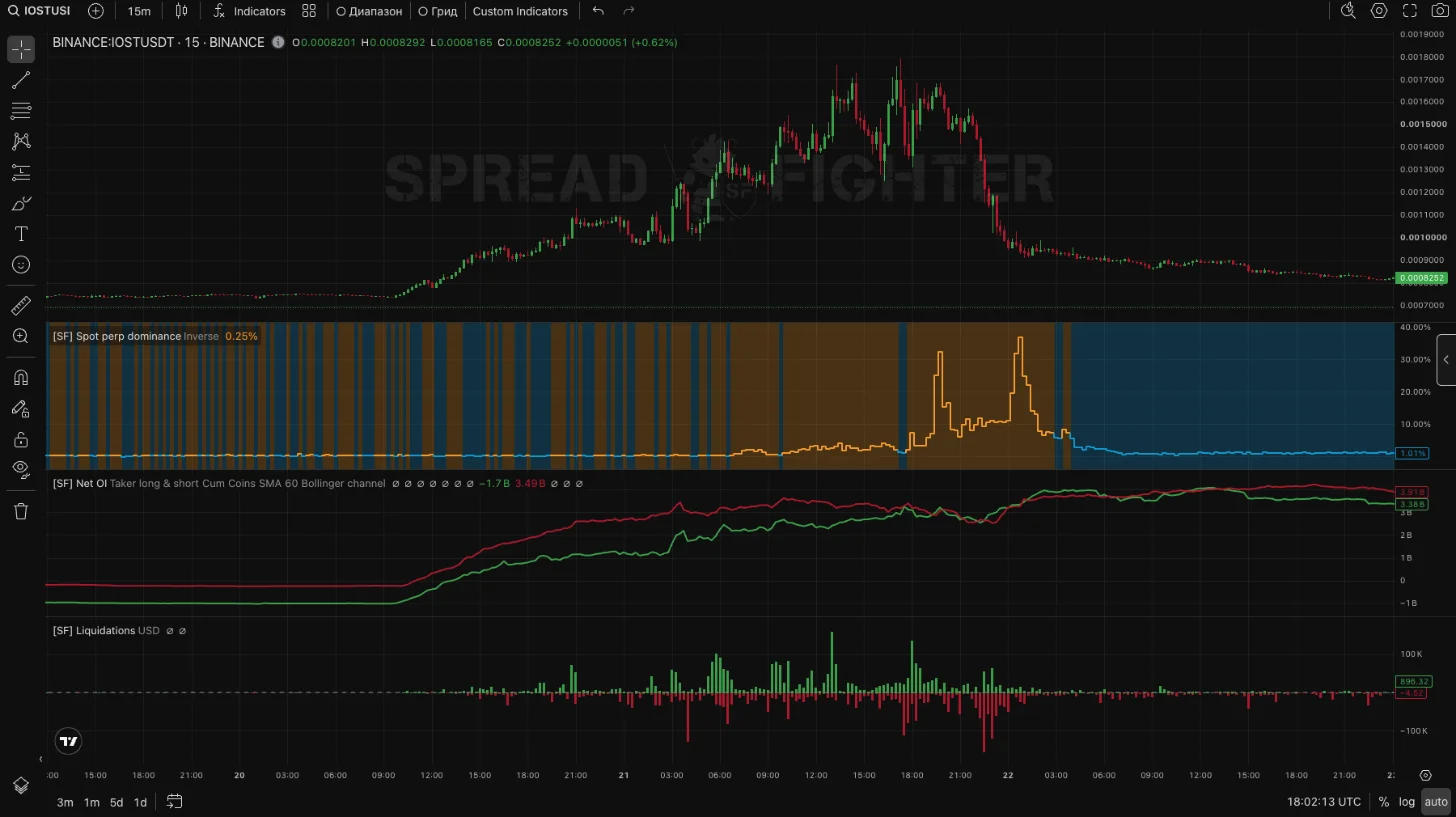
IOST: Spot perp dominance, Net OI and Liquidations
What the tools showed:
- Spot perp dominance. The indicator shows how much more expensive spot is than futures. Until 21 Oct 05:00 the difference stayed near zero. Then spot moved ahead by 1.5–3.5%, and at the reversal at 17:00 by 32%: futures had already dropped while spot still stood at the high. Futures volume was 15–30 times larger than spot volume, but spot was what pushed the price: the share of aggressive buys on spot reached 64%, and on futures it stayed near 50%.
- Net OI. Taker long and taker short grew with the price from the very start. Participants built positions on both sides, and there were many shorts.
- Liquidations. Green bars up are short liquidations, red bars down are long liquidations. The rise came with short liquidations, and on intermediate pullbacks longs were also wiped out. The largest long liquidations came with the dump on the evening of 21 Oct.
- Funding. Around 0% before the pump. From 21 Oct 08:00 it was −0.34%, −0.99%, then −2% with hourly payments: about 9% over one day.
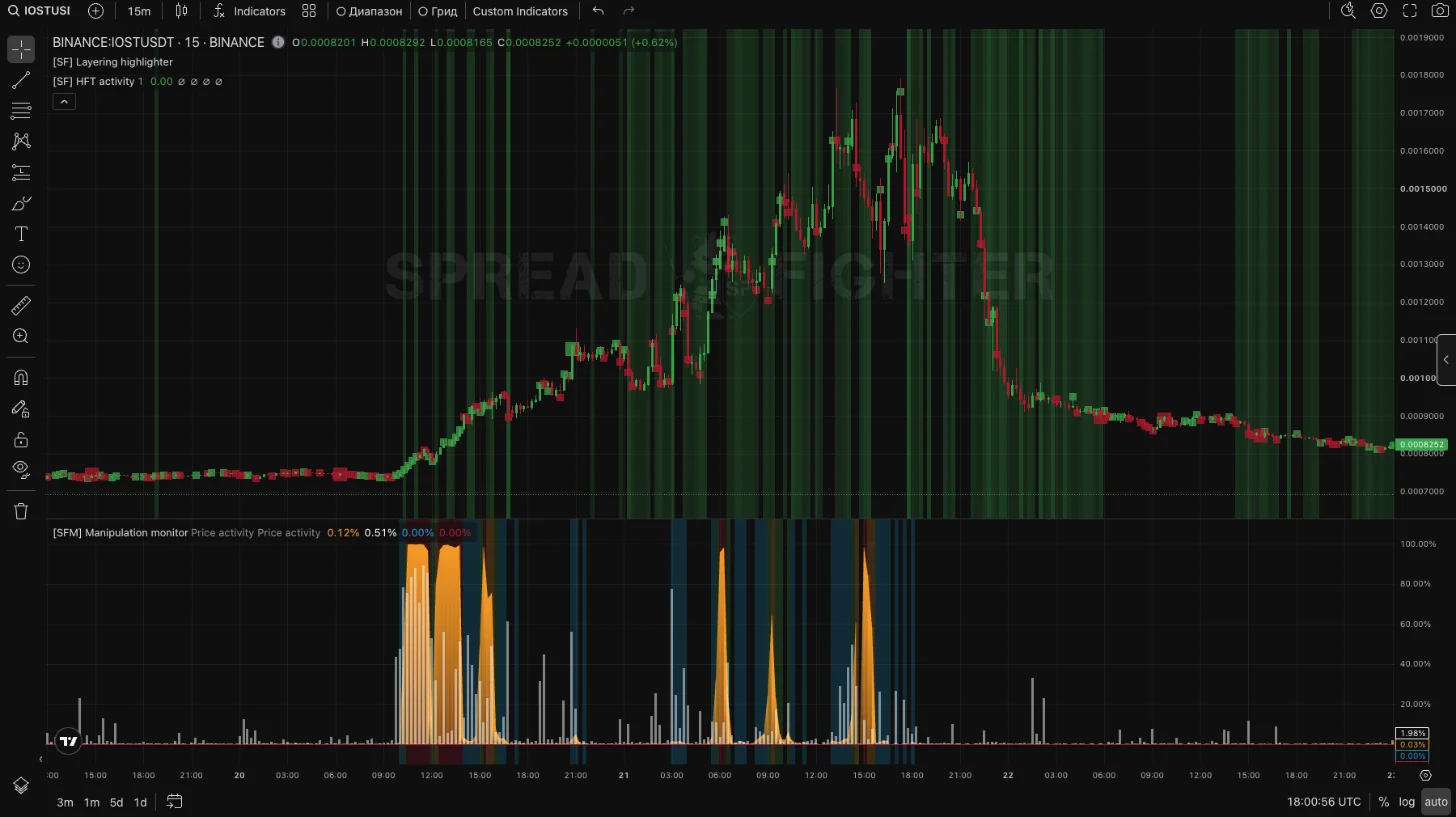
IOST: Manipulation monitor, Layering highlighter and HFT activity
- Manipulation monitor switched on at the start of the pump (20 Oct 10:00–15:00) and three more times at the climax: on 21 Oct at about 06:00, 09:00 and 15:00. Each flash is a new wave.
- Layering highlighter showed the order book skewed toward bids for almost the whole rise: buy orders were thicker than sell orders and held the price up.
- HFT activity marked candles with abnormal tape speed on every jump.
A mechanical short after the first pullback (21 Oct 00:00) was stopped out 3 hours later. It was not a reversal but a pause before the second wave. The signs of a climax appeared on the evening of 21 Oct. Manipulation monitor went quiet after 15:00, short liquidations gave way to long liquidations, and at 17:00 and 22:00 futures dropped first: the gap to spot jumped to 32% and 37%, and spot followed. A short opened after these signals captured the move from about 0.0015 to 0.0009, around 40%. Within 3 days the price gave back 93% of the gain.
Case 2: AGT, 15–20 Oct 2026 — a pump that did not come back
AGT is a coin with no spot market on Binance, a typical pump of 2026. On 15 Oct from 15:00 to 18:00 the price rose from 0.015 to 0.037, and on 18 Oct it reached 0.115. Above the market, that is +610%.
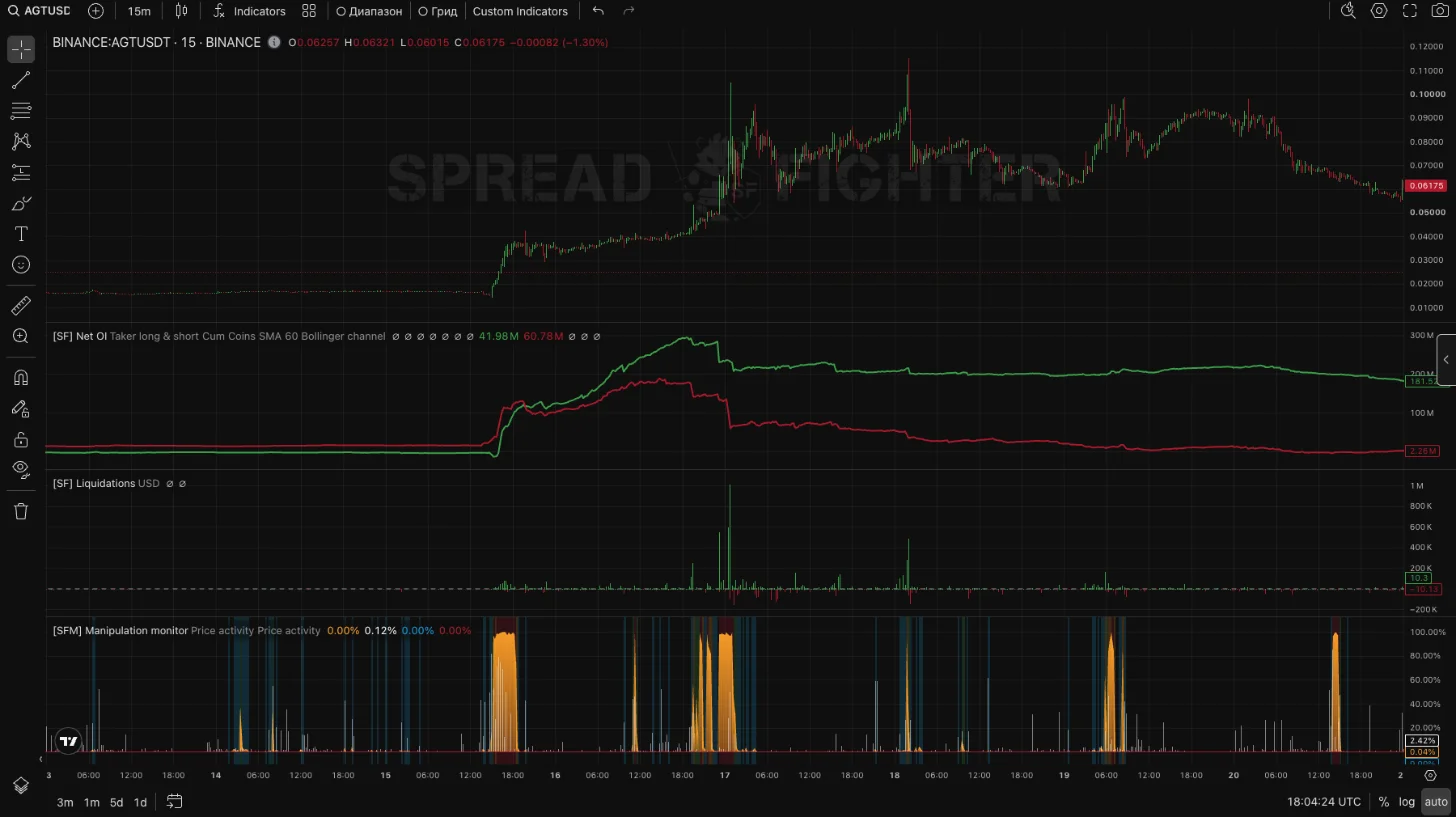
AGT: Net OI, Liquidations and Manipulation monitor
- Taker short grew with the price until 17 Oct: shorts kept building positions against the rise.
- On the night of 17 Oct the shorts were closed by force: $1 million of liquidations in 15 minutes, taker short fell by half, and by 20 Oct it was almost zero.
- After that the price did not return to the mean. It held at 0.06–0.09 for three days. Manipulation monitor flashed on every new wave, on 18 Oct and 19 Oct.
A short opened by the mechanical rule on 15 Oct was closed by the stop with a loss of about 27%, adjusted for the market. Conclusion: an extreme deviation alone does not guarantee a return to the mean. If short liquidations are over but longs remain, a pump can last for days.
Checklist before shorting a pump:
- The climax is visible, not guessed: futures dropped first, and short liquidations gave way to long liquidations.
- Manipulation monitor went quiet after the last flash and does not keep switching on.
- Funding is accounted for: at −2% per hour a short is expensive to hold, so delay entry until the rate normalizes.
- The stop is wider than usual: the second wave stops out about 40% of early shorts.
- Position size matches liquidity: in a thin coin, keep the stop and take profit in alerts, not in the order book.
Manipulation monitor mean reversion
The user looks for tokens that deviate from market conditions. With the Predict Liquidations tool the user determines the ranges for building the position, and with the Manipulation monitor model picks the optimal timing for opening and closing it. To achieve market neutrality, delta hedging through an index is used.
The main idea of the trade is to open a short position in the asset NMR, which has deviated from overall market conditions, and delta hedge through a futures contract on the DEFI sector.
For building the position, a zone with a cluster of pending orders predicted by the Margin levels model was chosen. The moment to open the position was a drop in the Manipulation monitor model readings.
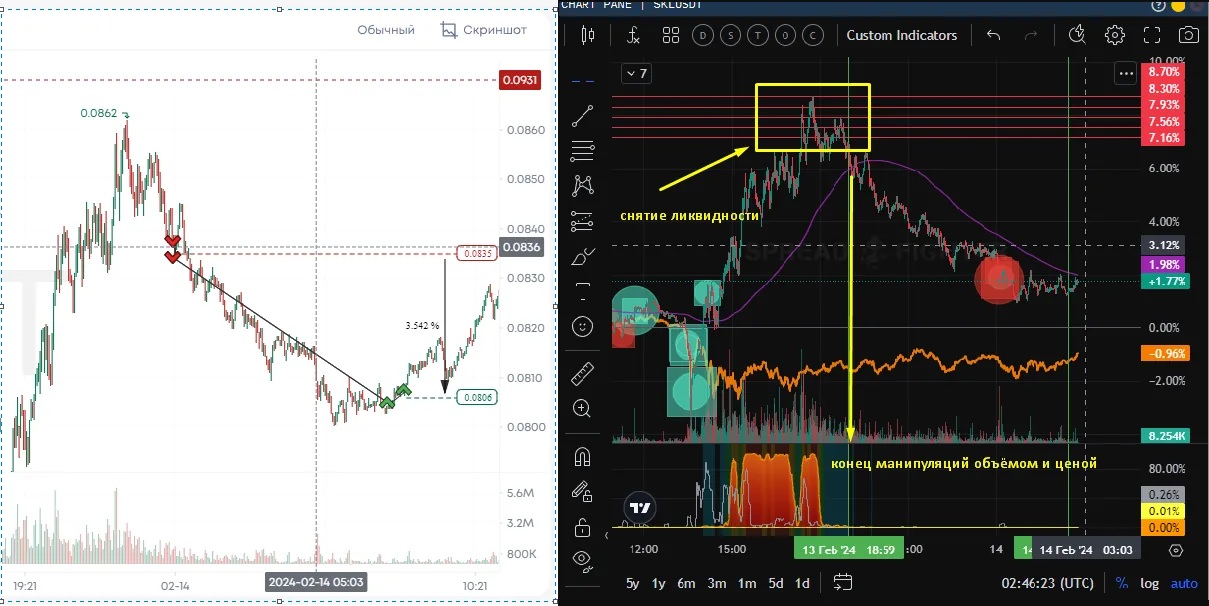
Screenshot of the trade from the broker's account and the SpreadFighter platform
The trade can be implemented on the basic plan. The trader plan, thanks to the Manipulation monitor model, lets you control risks more precisely.
BLZ Perpetual longsqueeze
With the Predict Liquidations tool the user finds assets with a large number of pending orders. The liquidity found later acts as "fuel" for a volatility spike and price movement.
From 17 Dec 2023 to 22 Jan 2024, a level protected by a cluster of large limit orders was formed on the BLZ asset, behind which a large number of long liquidations had accumulated.
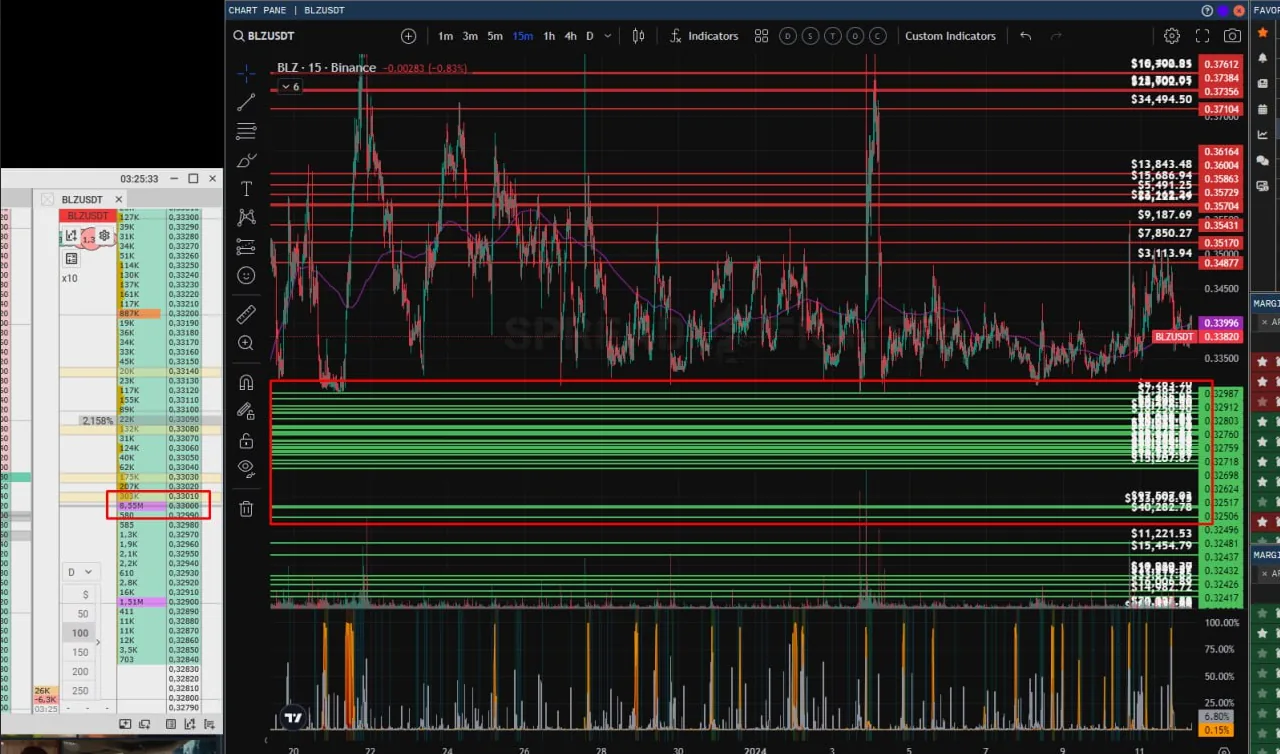
Order book screenshot
After the limit order was eaten through, a longsqueeze occurred, with liquidations as its "fuel".
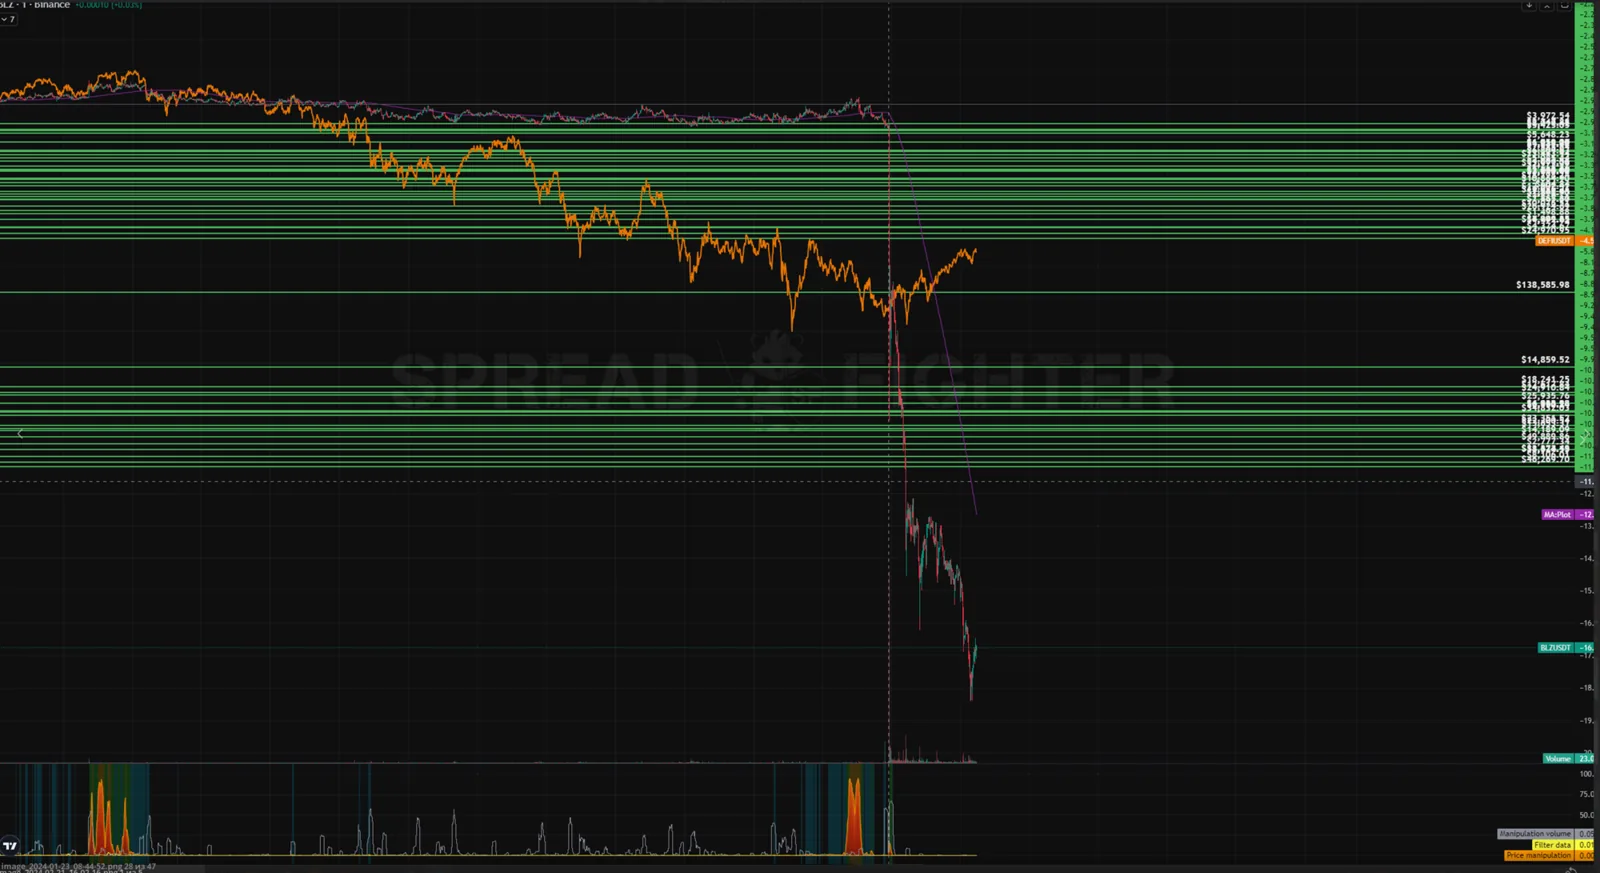
How the situation played out
The strategy can be implemented on the basic plan