Crypto Drift
Liquidity flows from altcoins into bitcoin and back
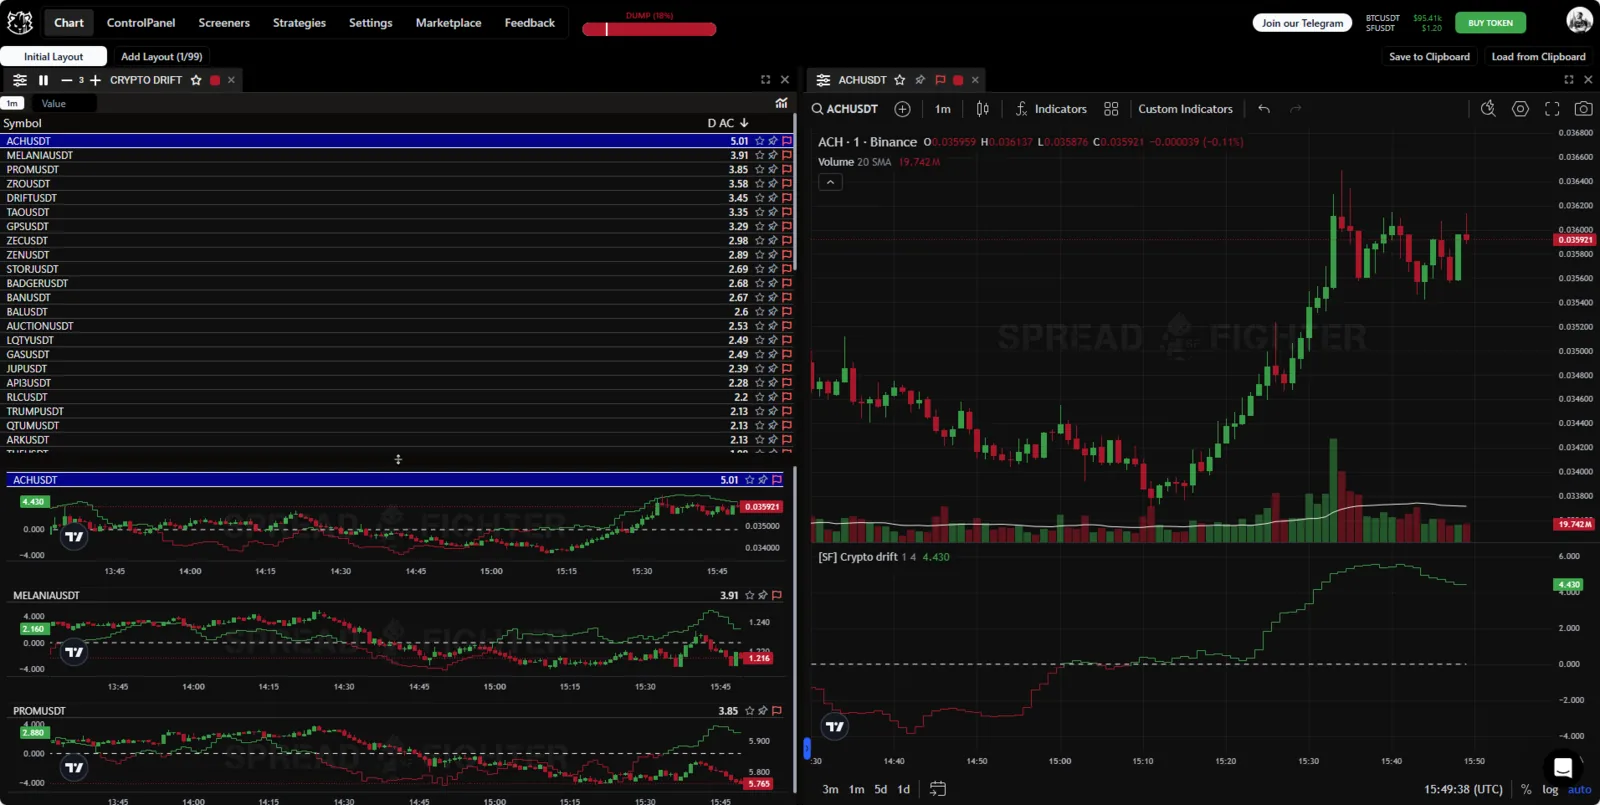
Model appearance.
Model Description
Crypto Drift is an indicator that tracks liquidity flows between bitcoin and altcoins. The idea is to analyze the behavior of bitcoin's market dominance relative to its price. When bitcoin dominance rises, traders may exit altcoins in favor of BTC. When dominance falls, the opposite happens: liquidity flows from BTC into altcoins.
The indicator uses two key market parameters:
- Benchmark price.
- Benchmark dominance.
The model readings can be interpreted as follows:
Negative Crypto Drift values:
- A signal that BTC dominance is above its average relative to price.
- Indicates an outflow of liquidity from altcoins into bitcoin.
- A potentially bearish signal for altcoins.
Positive Crypto Drift values:
- BTC dominance is below its average relative to price.
- Indicates an inflow of liquidity from bitcoin into altcoins.
- A potentially bullish signal for altcoins.
Model Tests
Coming soon…
Location
To add the "Crypto Drift" tool to your workspace, first click the "Screeners" button in the platform header. Then click the button of the same name in the "Microstructure" section.
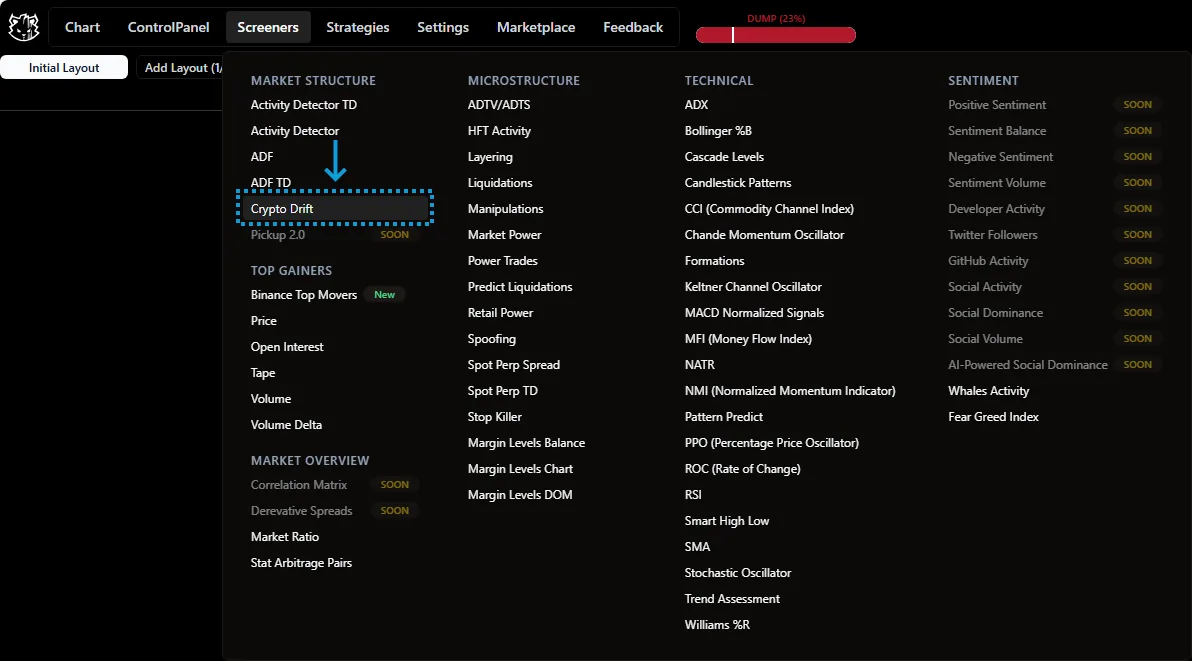
Widget location.
Functionality
Indicator
The indicator is an oscillator that takes the model values. Positive values are green, negative values are red.
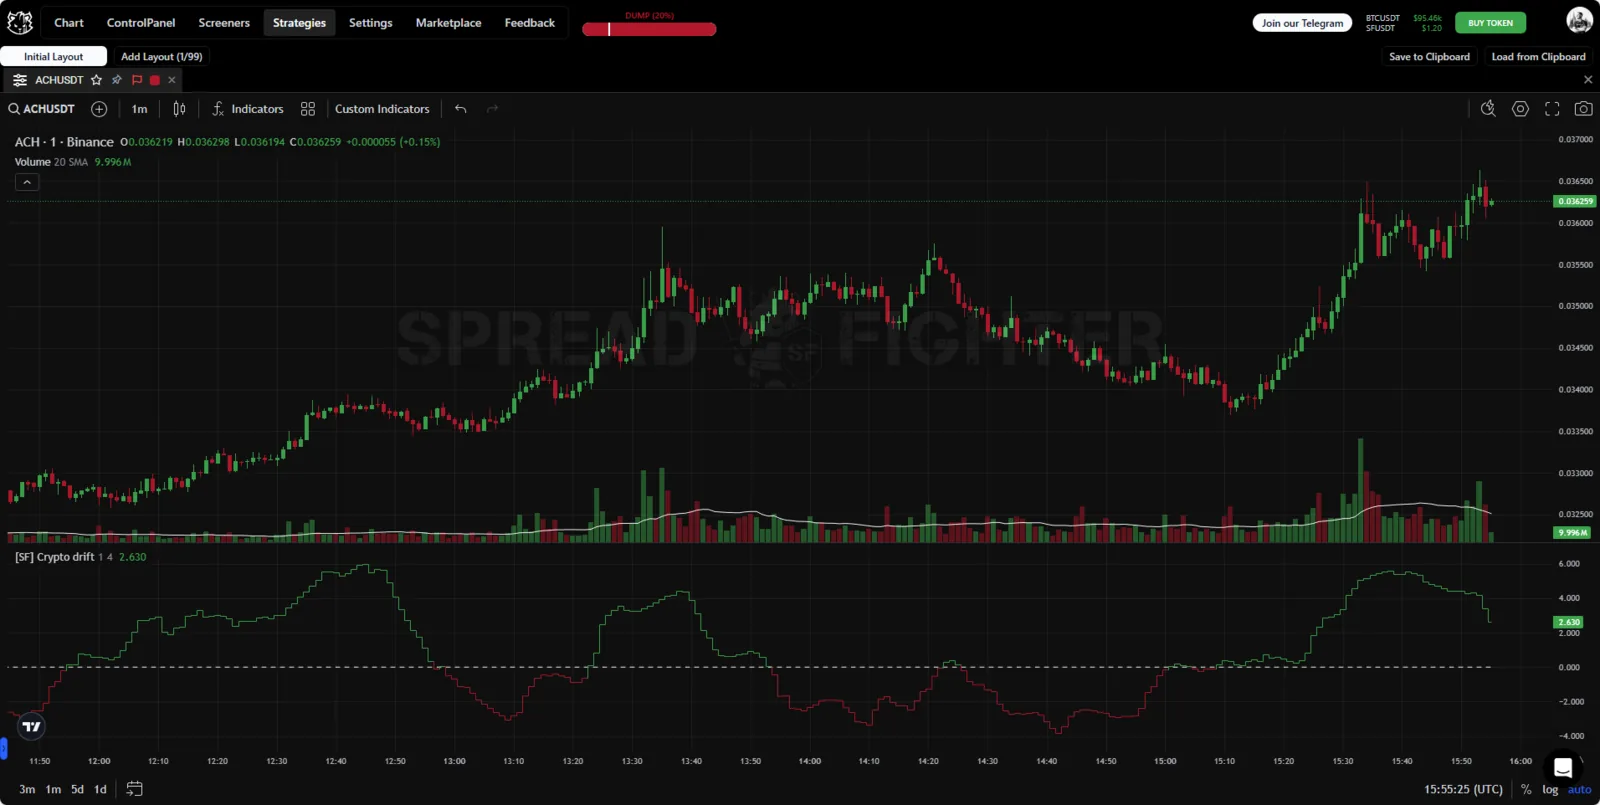
Widget
The widget table receives just one metric: the Crypto Drift model reading. The user can sort and filter the incoming data by the model metric.
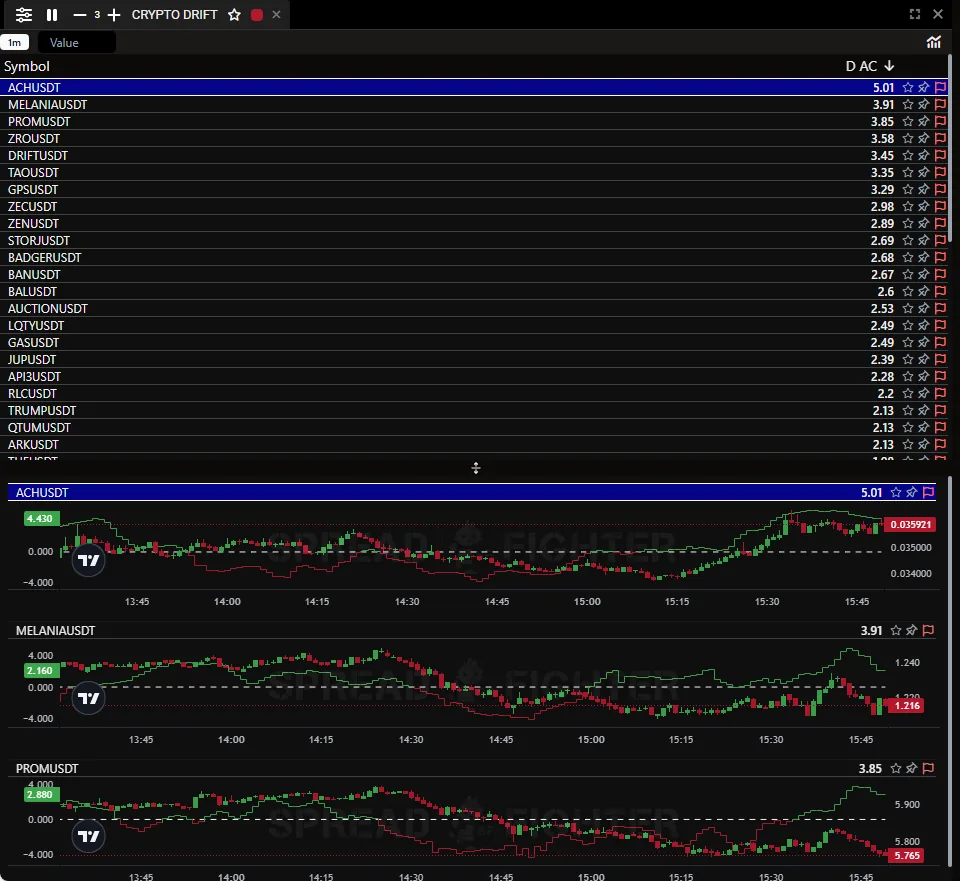
Use Cases
From the whole variety of assets correlated with the market, the Crypto Drift model lets you select assets that have deviated significantly from the market, to trade the return of the asset to "fair" prices.
On the chart, the indicator visually shows how the quote of the selected asset is behaving at the moment relative to the broad market.
Let us take the BTCUSDT pair as the benchmark and look at several examples of using the Crypto Drift indicator in trading.
On the BELUSDT quote chart you can see three phases in which the pair resists the movement of the BTCUSDT quote:
- Weak growth of BELUSDT with confident growth of BTCUSDT and falling extremes of the Crypto Drift indicator lead to a switch from long volatility to short volatility and, as a result, a local dump and a move to the next phase.
- After the local dump, the BELUSDT quote goes flat while the benchmark falls.
- After the uncertainty in the direction of volatility changes to confidently long and Crypto Drift moves into the green zone, the BELUSDT asset shows resistance to the market of 5 units and outperforms the benchmark, which has gone flat.
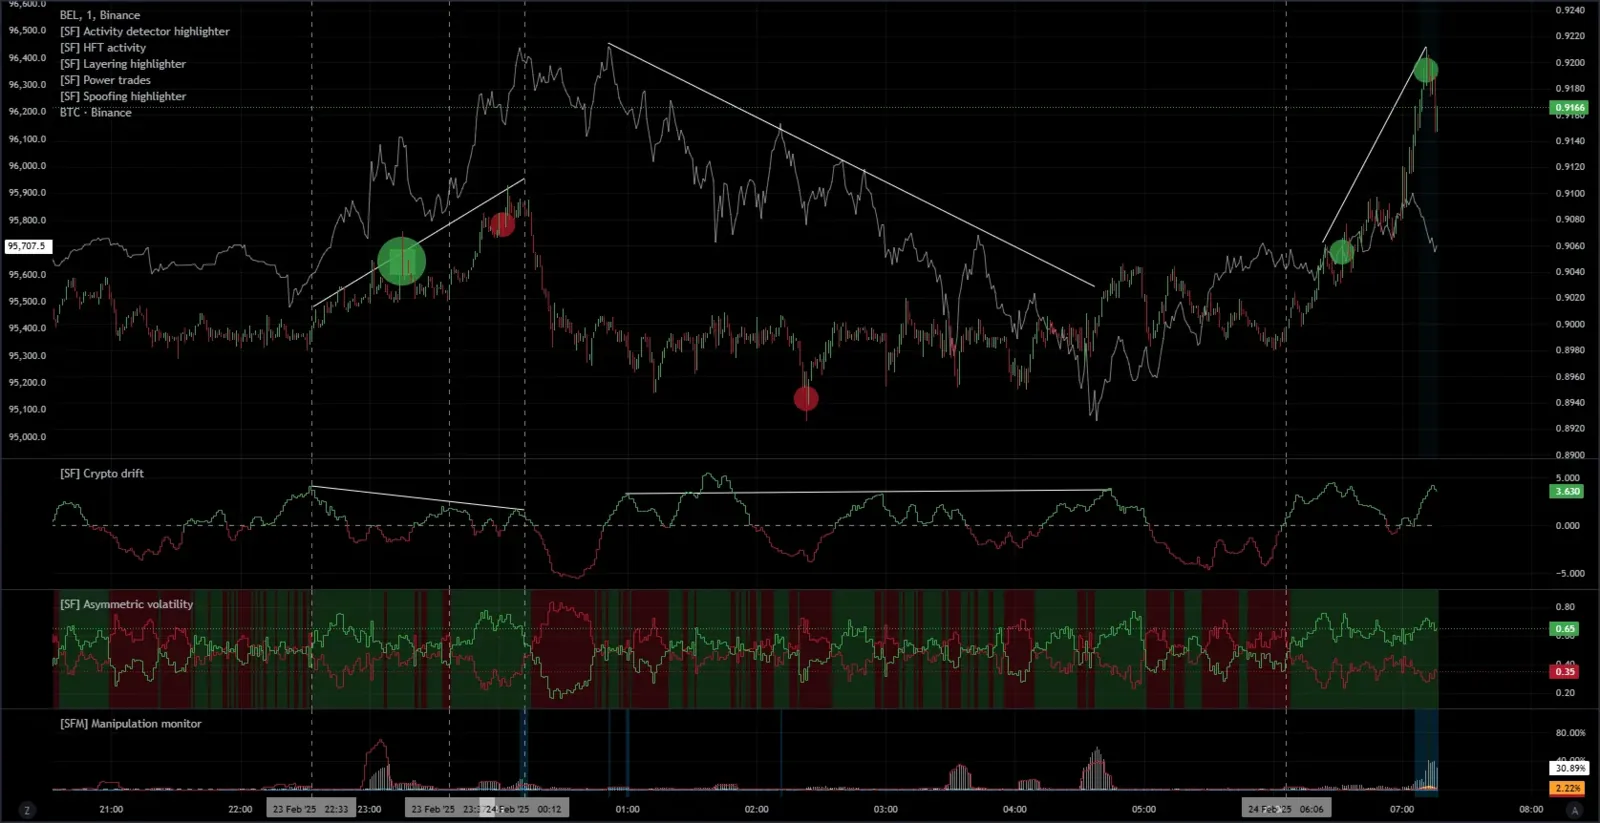
BELUSDT
On the BERAUSDT quote chart we can see the asset following the benchmark's corrective move. The Altusher BB indicator points to a likely early end of the corrective move and a return of the benchmark to its average.
For some time the BERAUSDT pair resists the benchmark, and even falls while the BTCUSDT pair rises.
After volatility switches to long and the Crypto Drift indicator moves actively into the green zone, the BERAUSDT pair shows an impulsive rise along with growing volume manipulation.
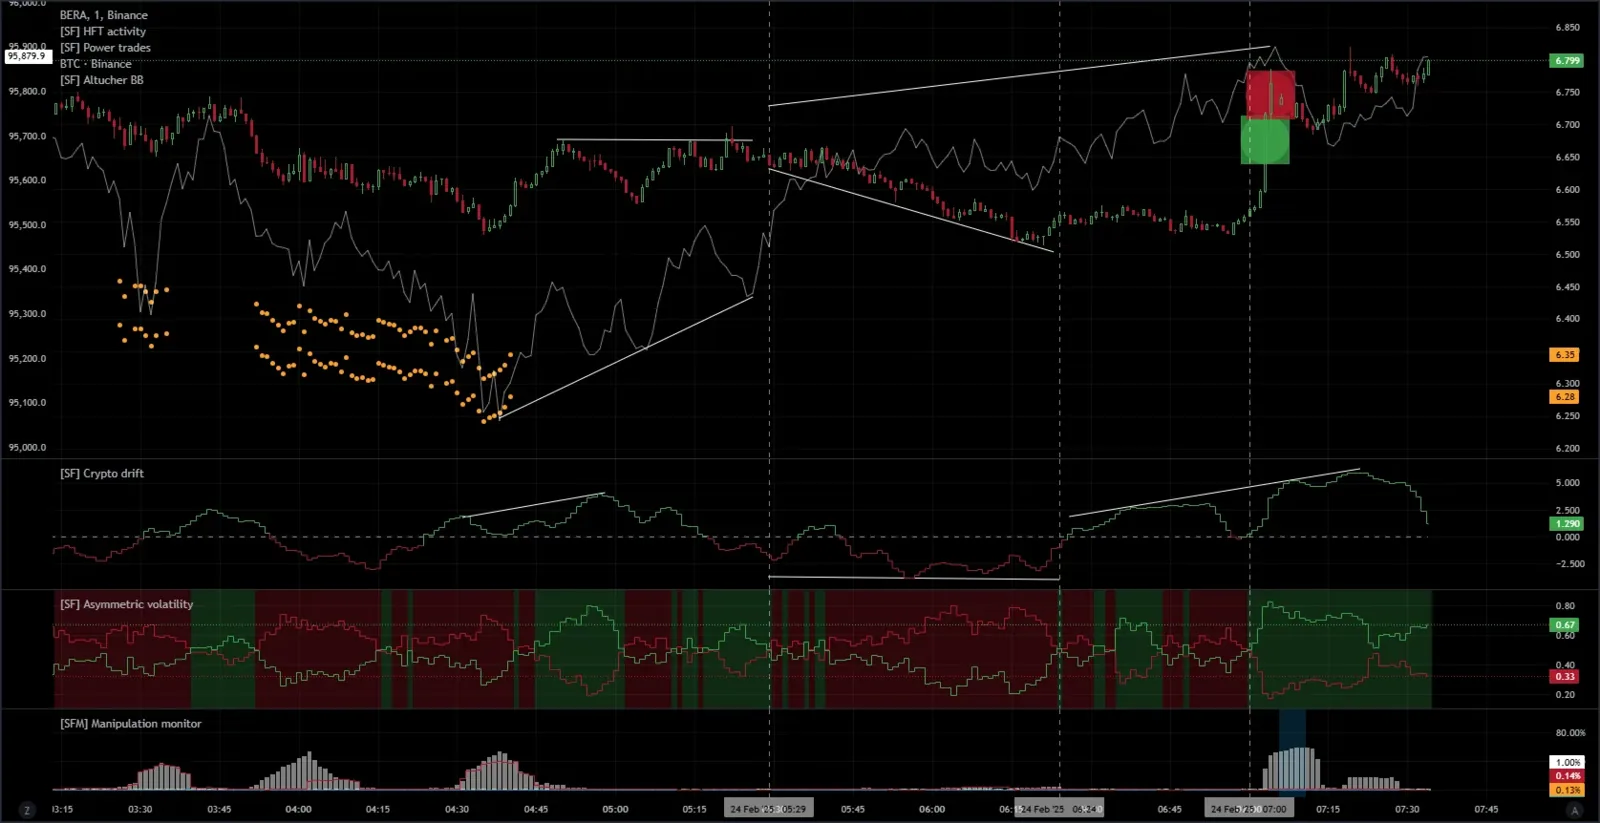
BERAUSDT
In the SHELLUSDT quote we can see the asset's weakness relative to the benchmark.
After BTC moves into a range, Crypto Drift starts to grow actively and the uncertainty in the asset's volatility changes to long. The asset shows an impulsive rise, stopped by a strong price and volume manipulation. After that, following the benchmark, the asset goes into a correction toward its averages.
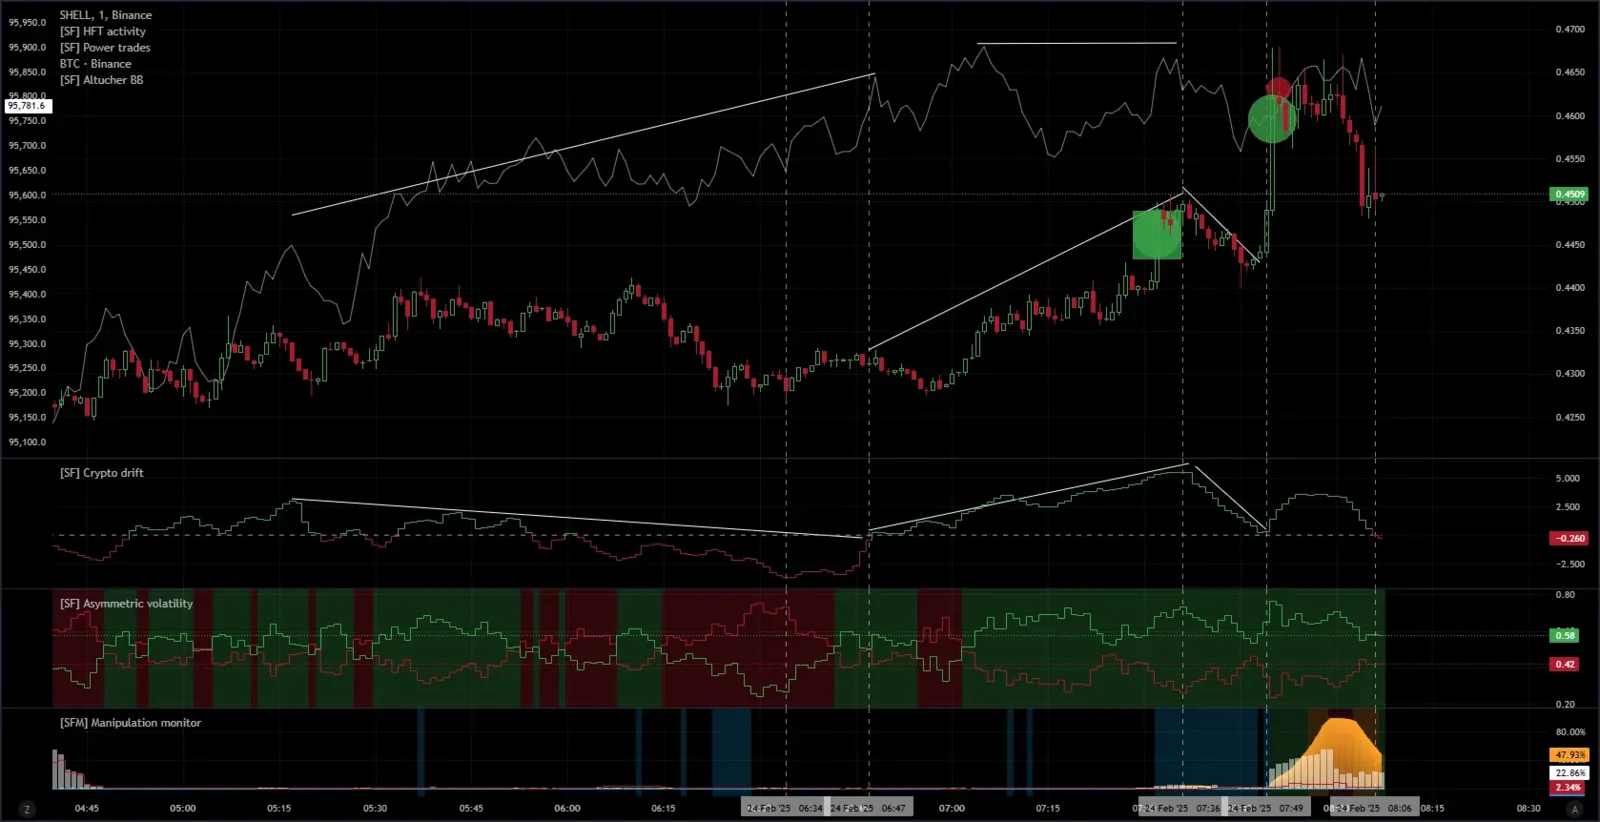
*SHELLUSDT *
On the RDNTUSDT chart the situation develops similarly to the BERAUSDT pair:
- the asset corrects together with the market
- the asset does not react to the benchmark's trend change highlighted by the Altusher BB indicator
- after the benchmark goes flat, the Crypto Drift deviation starts to grow
- after the uncertain volatility changes to long, the asset shows an impulsive rise, stopped by a volume manipulation and a significant correction of the benchmark
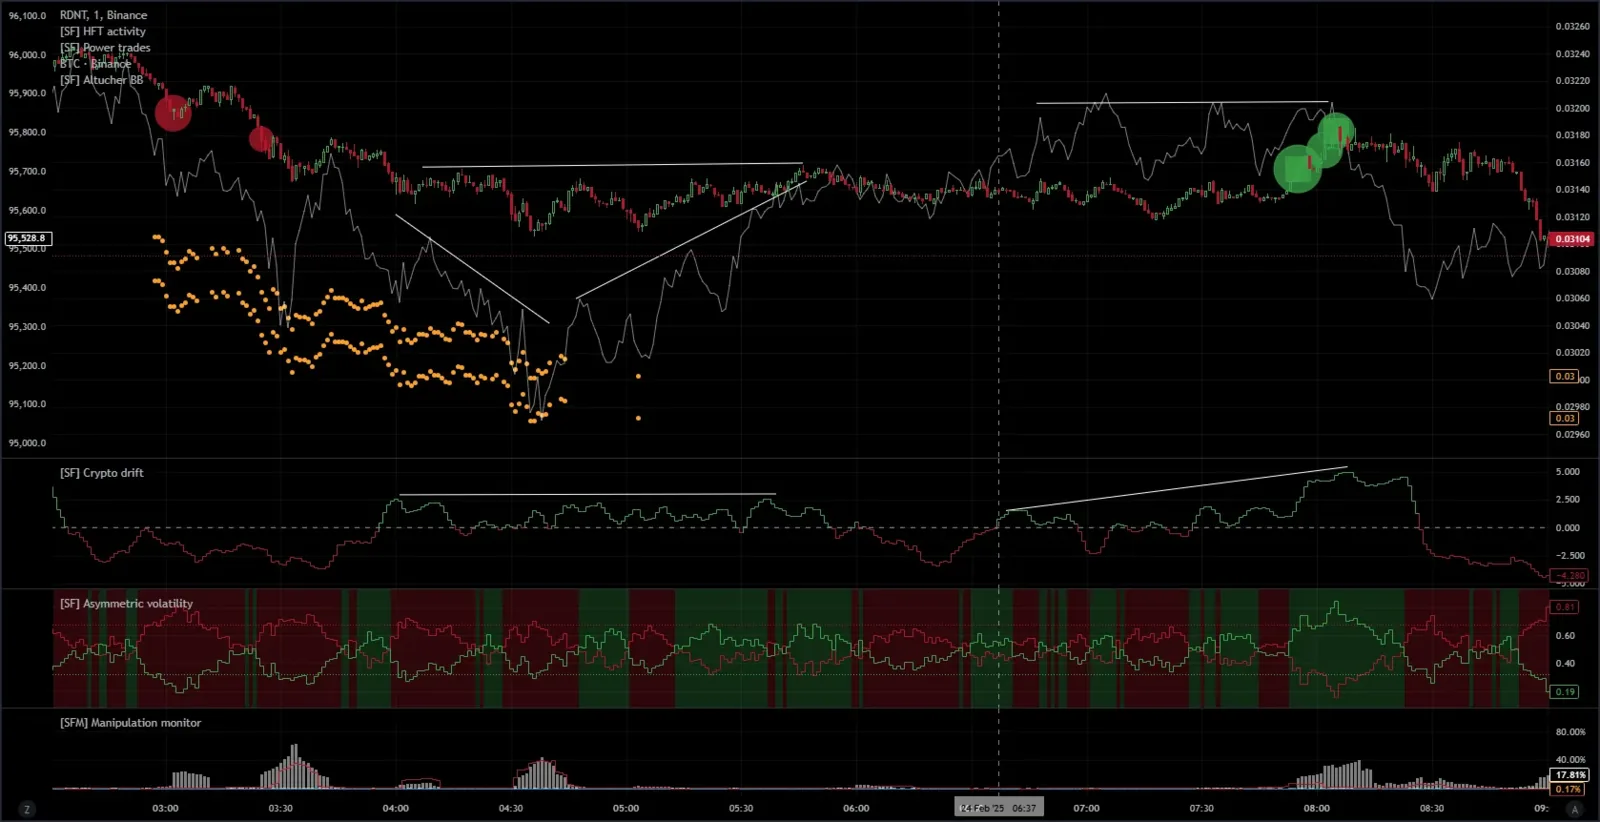
*RDNTUSDT *
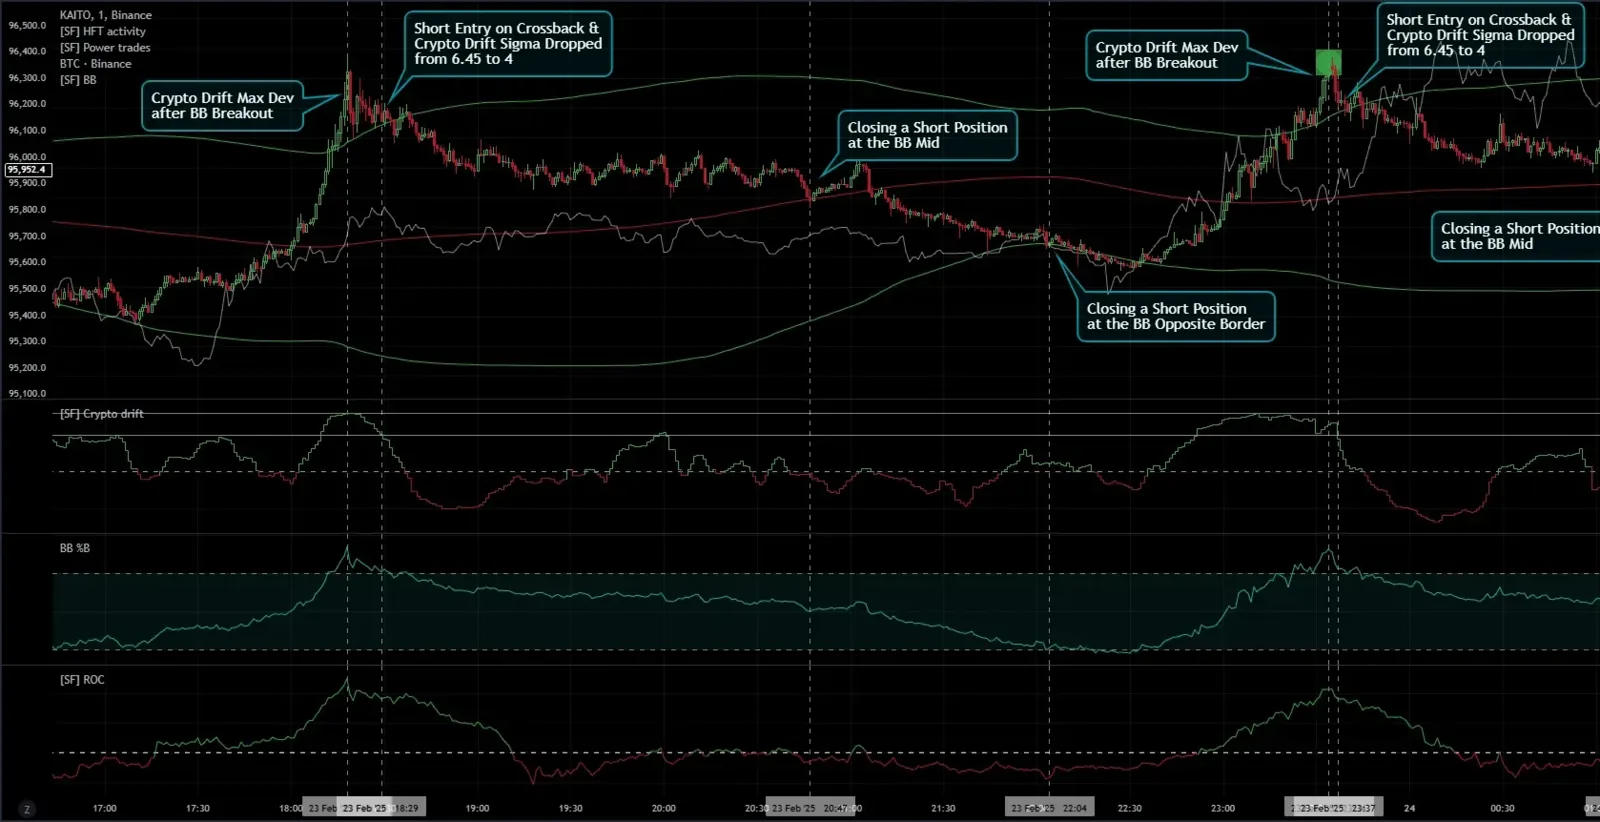
The KATIOUSDT quote moves inside the Bollinger Bands channel, sometimes going beyond the upper boundary of the channel. At the same time the deviations in the Crypto Drift, normalized Bollinger Bands and Rate of Change indicators reach their maximum values for the selected time range. Such maximum deviation values are usually reached when the asset deviates significantly from the benchmark.
If the quote returns inside the Bollinger Bands channel and the deviations in the Crypto Drift, normalized Bollinger Bands and Rate of Change indicators fall at the same time, the quote is likely to return to the middle of the Bollinger Bands channel or to its opposite boundary.
In the KATIOUSDT example, on the selected time range the maximum deviation is 6.45 and the normal deviation is 4. When the Crypto Drift deviation reaches the normal value, we open a short position for the quote's return to the middle of the Bollinger Bands channel. If the quote and the deviations in the indicators keep falling, part of the position can be left open until the quote reaches the opposite boundary of the Bollinger Bands channel.
This tactic can also be used to trade synthetic assets.
*KATIOUSDT *
The Crypto Drift screener and indicator, on their own or combined with other SpreadFighter tools, can be used to trade assets that have locally deviated from the market. The assumption is a high probability that the asset quotes return to the market average, or that the deviation continues.
Crypto Drift is most effective on lower timeframes, up to 5 minutes. This way, Crypto Drift helps scalpers and intraday traders.