ADTV/ADTS
A model that tracks the dynamics of tape speed and traded volumes
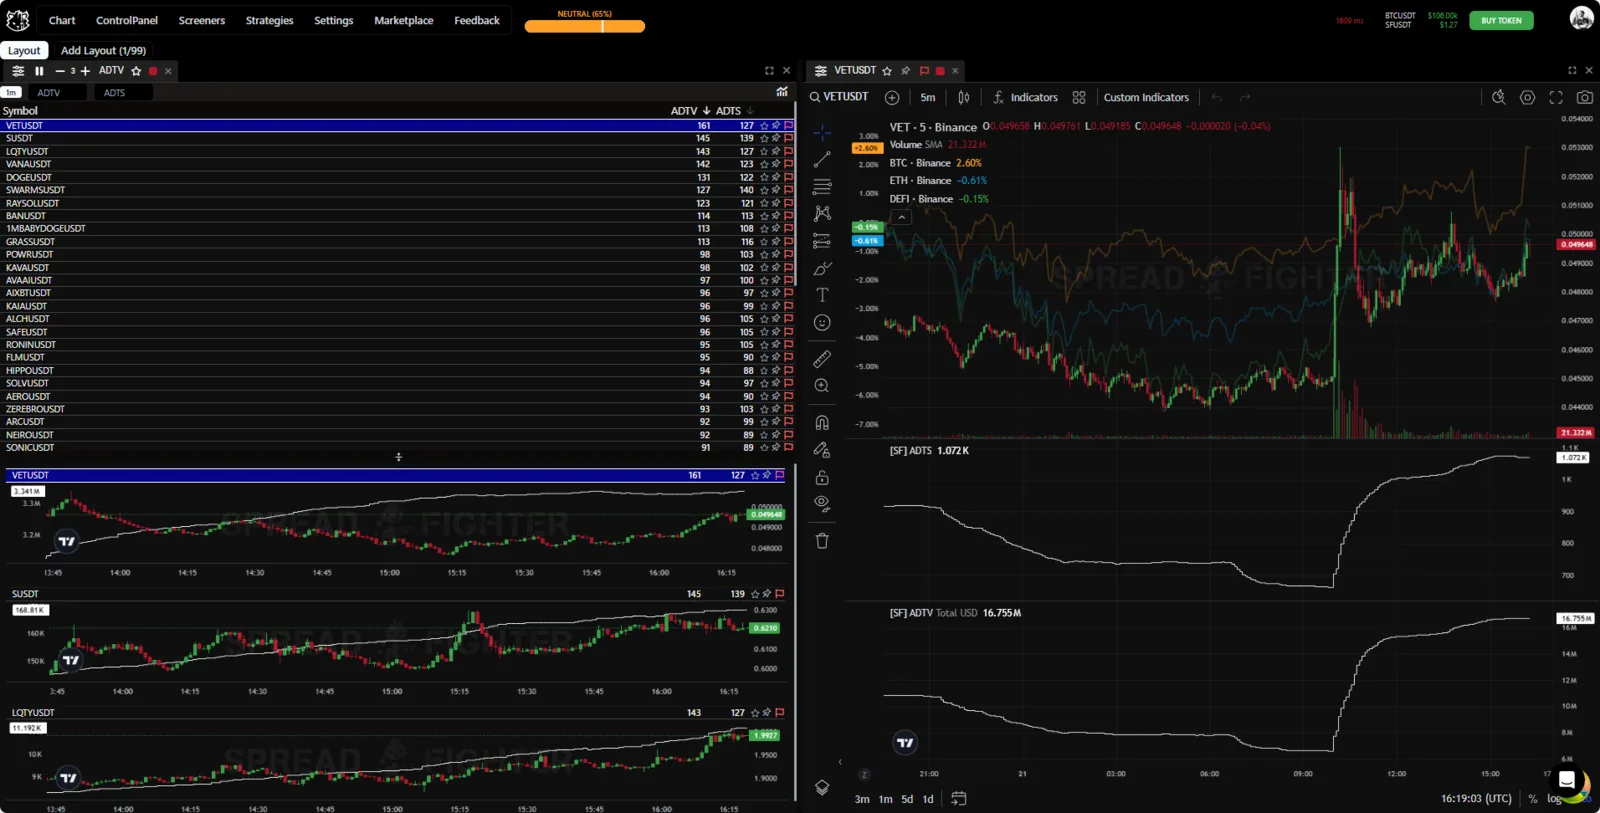
Widget appearance.
Model description
The logic of Speedrush is based on the classic, well-known quantitative model Average Day Trade Volume.
https://www.investopedia.com/terms/a/averagedailytradingvolume.asp
The SpreadFighter version differs in that:
- the model values are normalized and brought to a percentage scale;
- besides trading volumes, the model also takes the number of trades as input.
The model is calculated by the formula
where is the trading volume over period , is the tape speed, is the number of days, and is the mean value of ADTV (ADTS).
Model tests
Coming soon…
Location
To add the "ADTV/ADTS" tool to the workspace, first click the "Widget menu" button in the platform header. Then click the button of the same name in the "Microstructure" section.
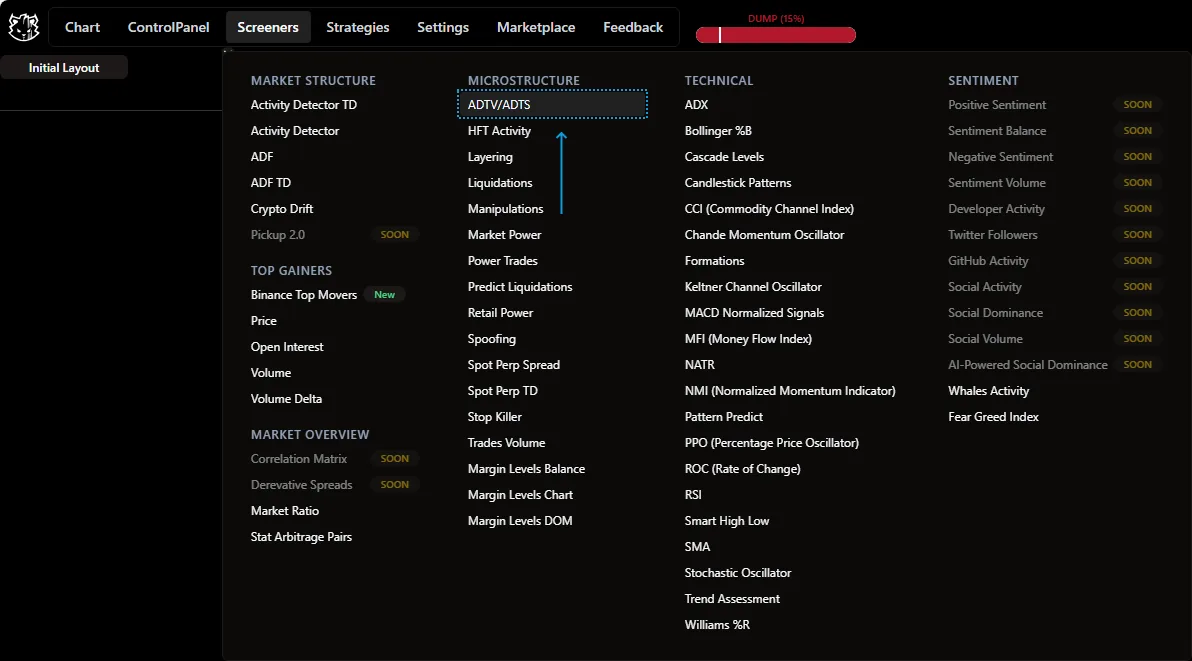
Widget location.
Features
Indicator
The ADTV & ADTS indicators are oscillators that show the average daily volume / number of trades per minute.
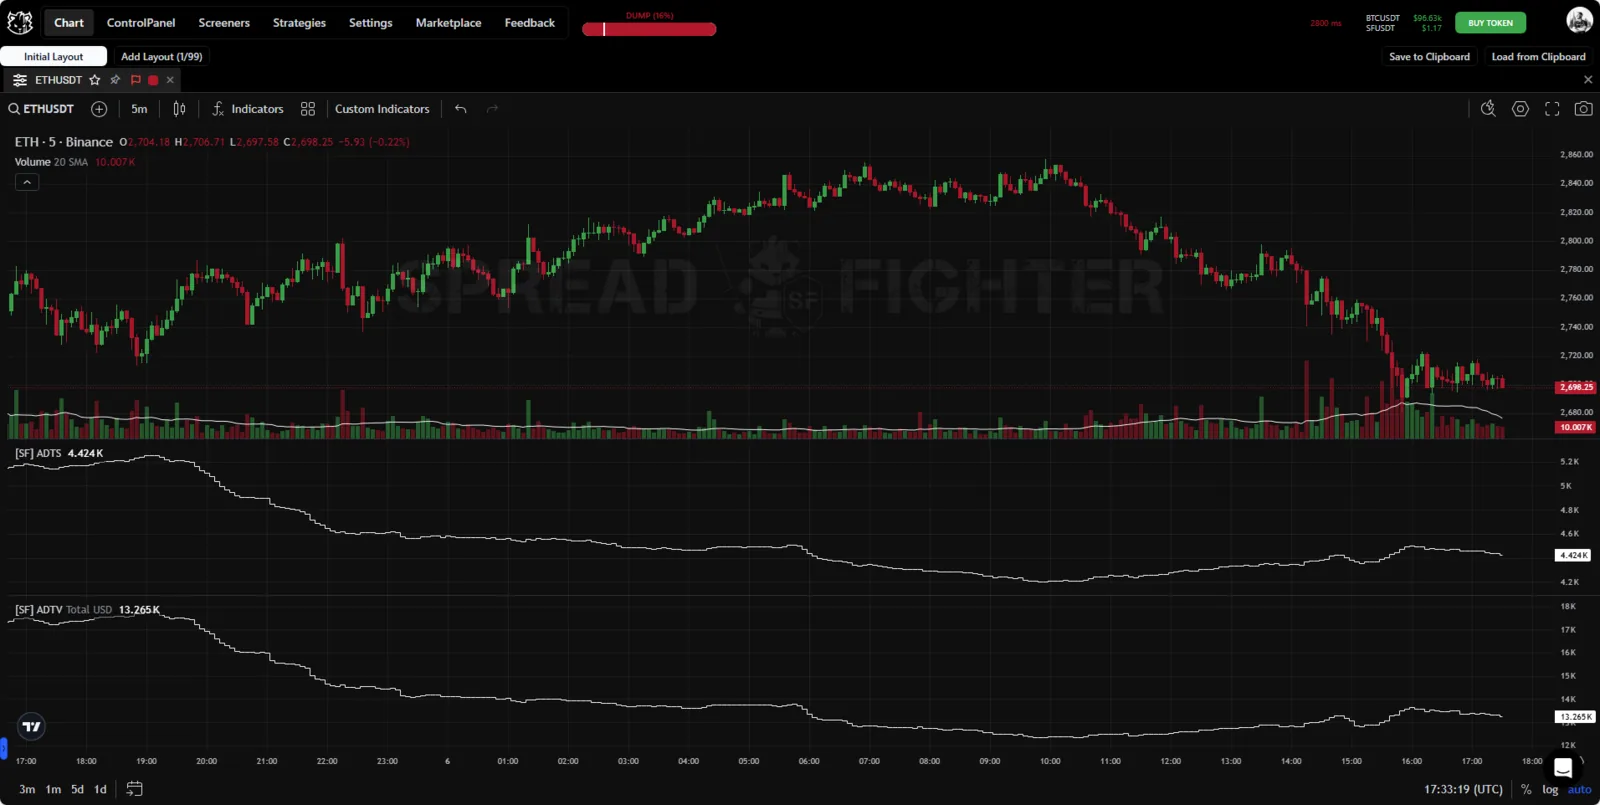
ADTV & ADTS indicators.
Widget
The widget table receives the normalized (brought to a percentage scale) values of the ADTV & ADTS models. Incoming signals can be filtered by both metrics.
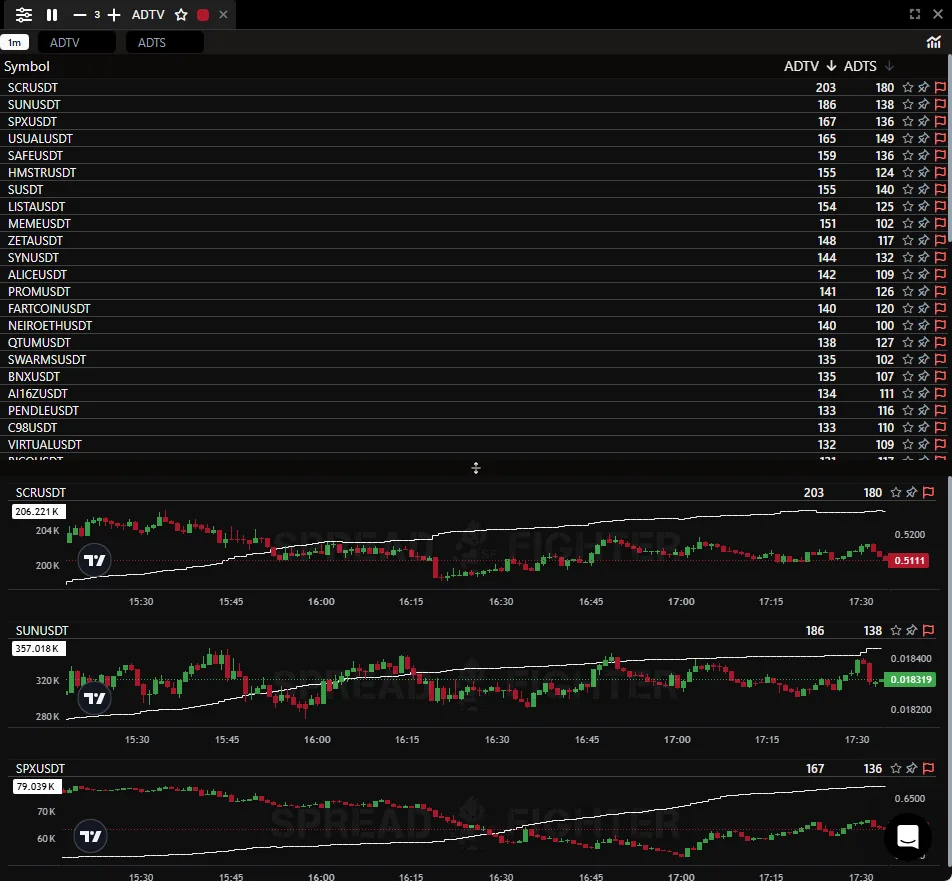
ADTV & ADTS widget.
How to use ADTV/ADTS?
Finding assets in play
Trading volume is an indicator of the overall level of interest in an asset shown by all potential exchange traders.
An extremely low average trading volume of a stock means that few investors and traders follow or care about it, and that few large institutional participants, if any, are ready to invest in the asset. This usually means that market analysts have reached a consensus that the chance of a significant price rise is small.
Conversely, a high average trading volume points to greater interest in the asset. It is usually read as a sign that many investors expect prices to change significantly.
The Speedrush model lets a trader find assets "in play" without manually monitoring the whole market at once. These are the assets with the highest probability of sharp price changes.
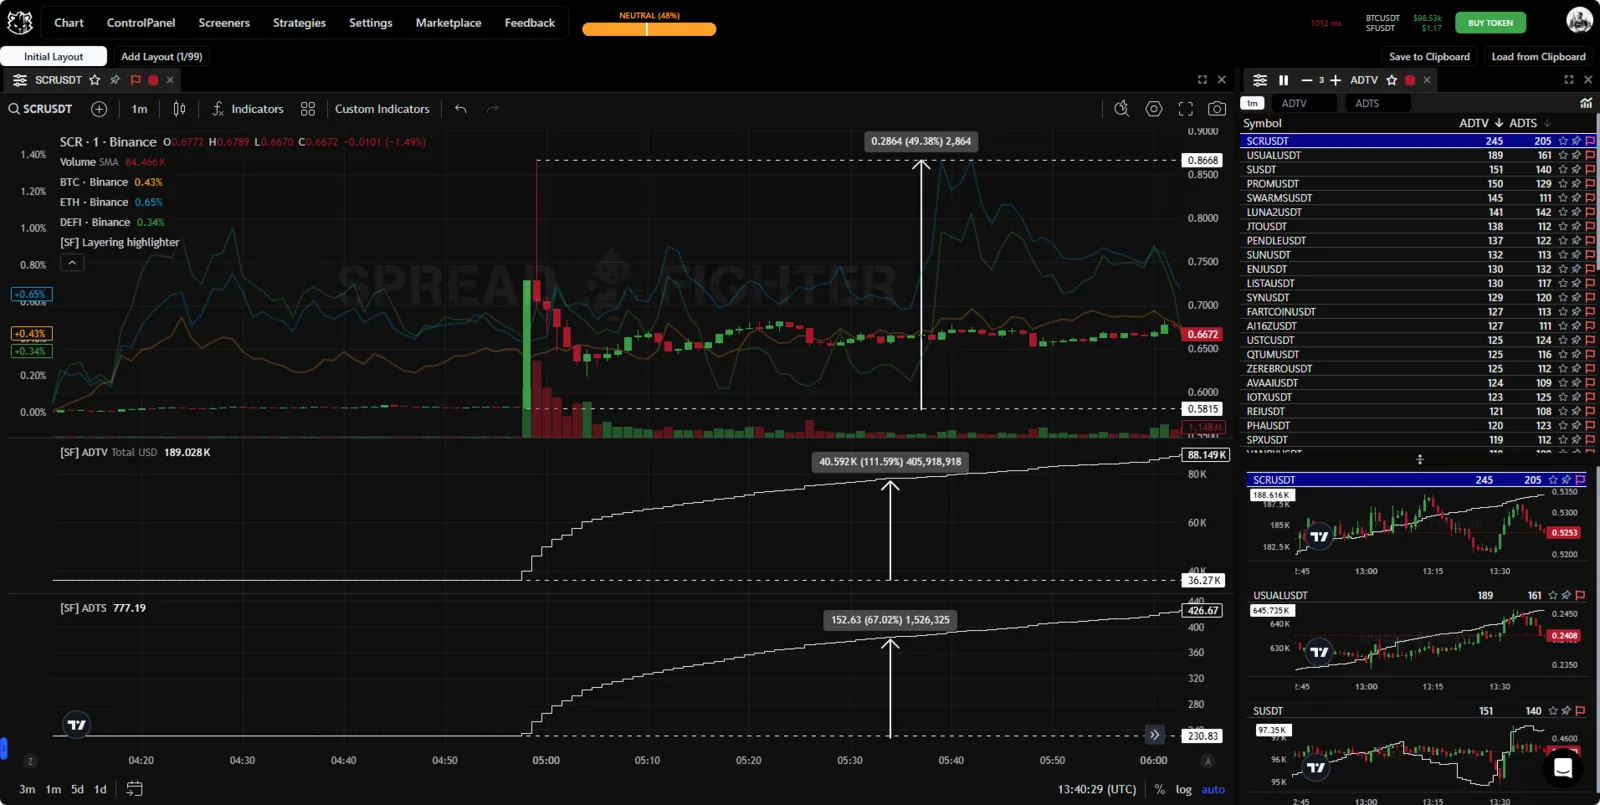
Growth of ADTV and ADTS shows that a participant is present in the asset.
Liquidity
Average daily trading volume also shows how liquid trading in a given asset is. Liquidity matters to investors because it affects the difference between the bid and ask price. It therefore shows how relatively easy or hard it is to open or close a position at the desired price.
Assets with relatively low trading volumes have wider bid-ask spreads, which makes it harder to enter or exit the stock at the desired price.
By contrast, assets with consistently high average trading volume offer narrower bid-ask spreads. This makes it easier for an investor to enter or exit trading positions at the desired price.
Shows the price levels that act as support or resistance for a stock.
Finally, significant changes in volume often show exchange traders the price levels that act as support or resistance. With a high probability, the asset price will show some reaction from these levels, which is a direct source of profit for the trader.
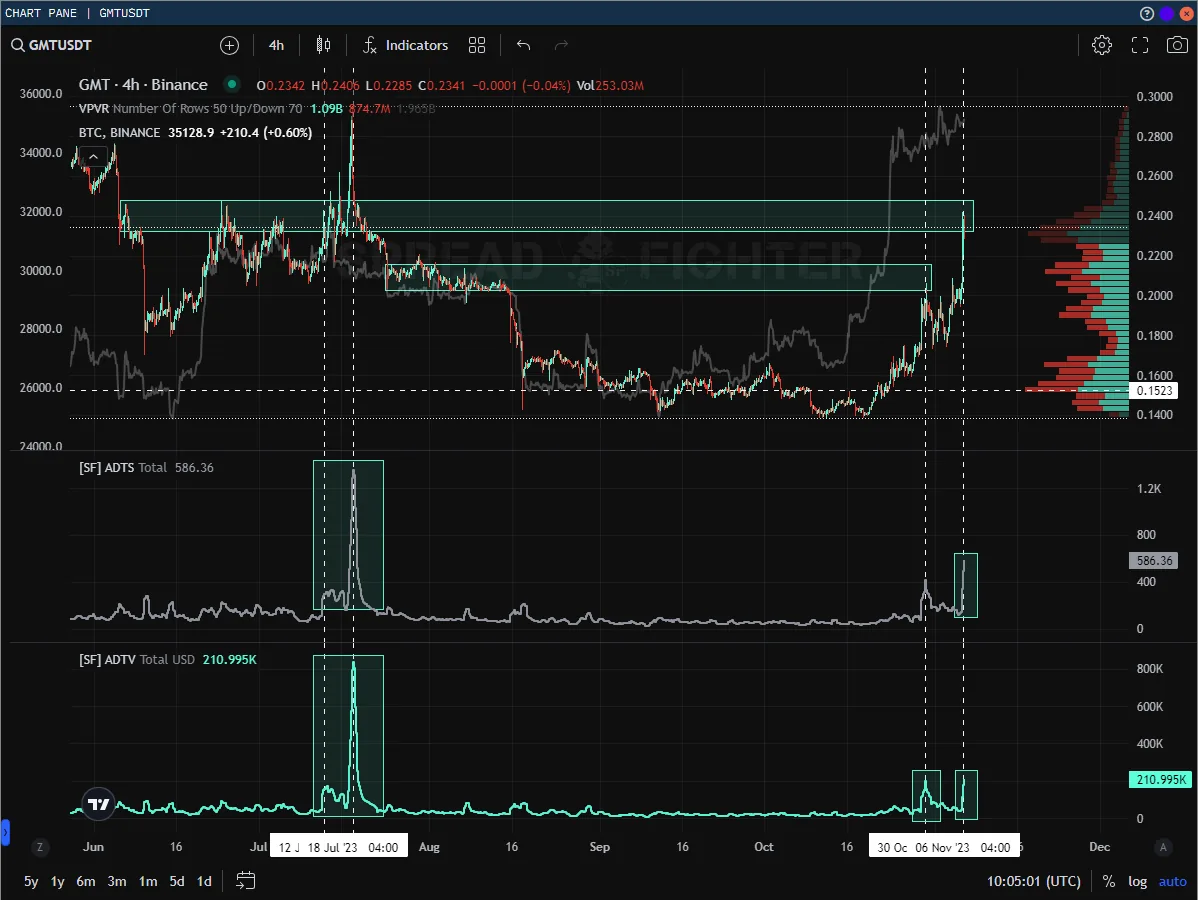
The GMT token price is approaching its 4-month high.