Alt meter, Tick index, RT index
Detect the probability of a local altseason and the price dynamics of the broad market at the moment
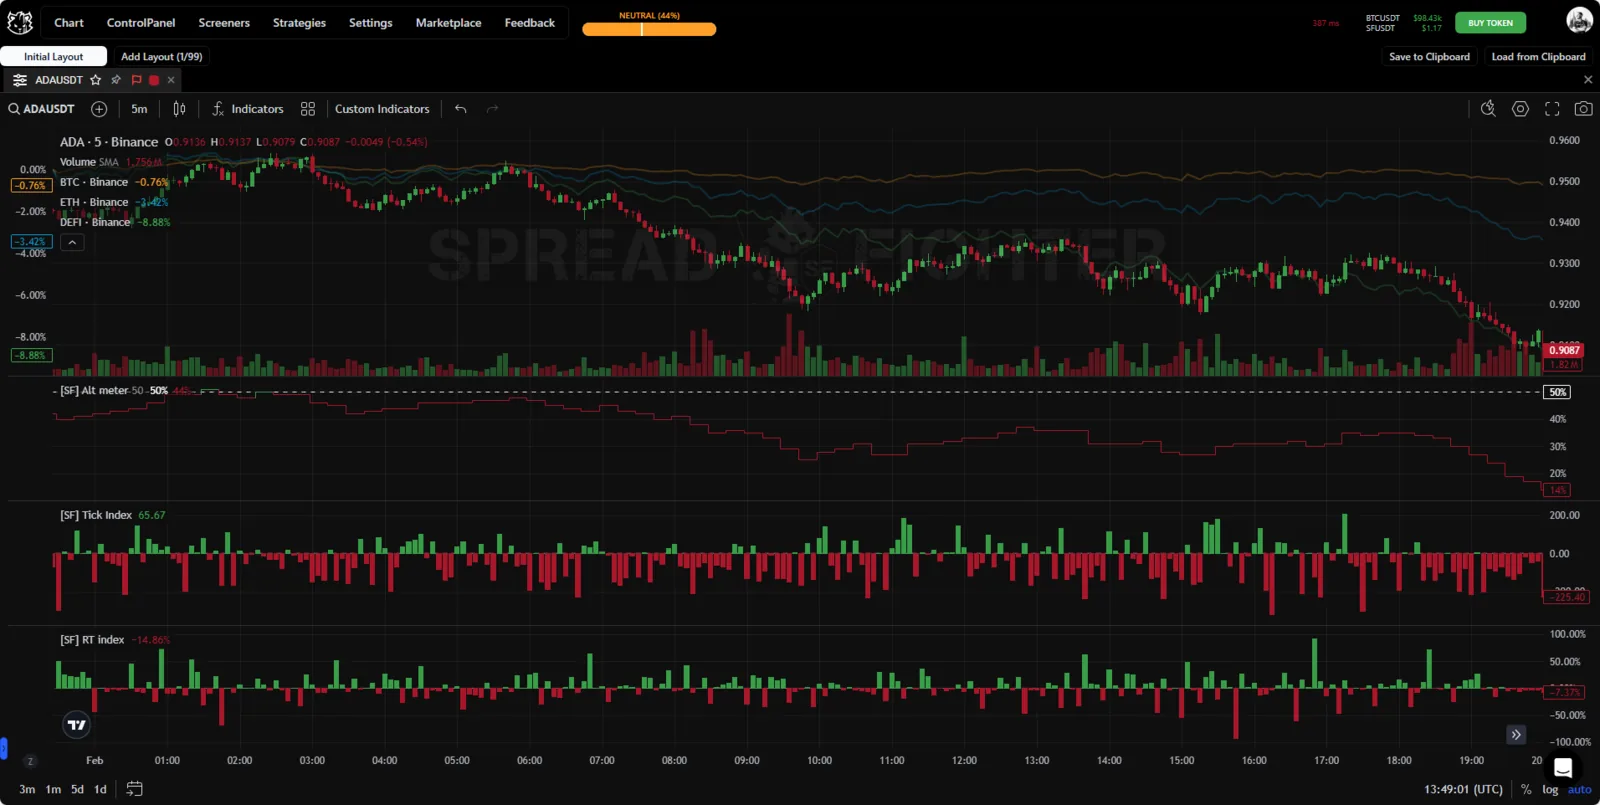
Indicator appearance.
Description
Alt meter shows how well the altcoin market is doing relative to BTC. Indicator values above 50% mean the altcoin market is outperforming BTC. In this case the indicator chart is colored green. Conversely, if Alt meter is below 50%, altcoins are underperforming Bitcoin. Then the indicator chart is colored red.
Tick index and RT index are calculated from the prices of all instruments traded on Binance Futures. They show the price dynamics of the broad market: the number of coins that are rising is compared with the number of coins that are falling. The user gets a reading as a number from -200 to +200 for Tick index and from -100% to +100% for RT index.
Tick Index
Tick Index is a popular indicator used by intraday traders to see the overall market mood at a given moment. Watching the ratio of "up" coins to "down" coins lets traders quickly make trading decisions that depend on market movement.
Tick Index tracks the number of coins that are rising compared with the number of coins that are falling. Readings closer to +200 and -200 are considered extreme. The Tick Index in DOG covers the full range of futures instruments on Binance Futures (about 200 instruments as of summer 2023, adjusted +/- as new coins are listed and delisted).
Tick Index is calculated by the formula:
where is the number of rising coins, is the number of falling coins, and is the comparison period in seconds. The SMA over the same period is used as the comparison point.
RT Index
RT Index is a synthetic instrument that estimates real-time sentiment relative to the averages of both the instrument itself and the market conditions as a whole.
Its main difference is that it does not work with absolute values (the coin fell or rose). RT Index:
- finds the average fair price of the asset on a micro timeframe;
- calculates by how many percent the coin's price deviated from the average;
- calculates a weighted sum of deviations for all coins, according to their dominance relative to the broad market.
You can see how well RT Index works in the following examples. The large chart on the left shows the coin prices used in the calculation. The upper chart on the right is Tick Index. The lower chart on the right is RT Index.
Alt Meter
The model detects the overall direction of market movement, based on Bitcoin dominance and its price in the market.
The analytical data revealed a pattern of movement in 3 paradigms:
- If BTC dominance rises and the BTC price rises, a dump of altcoins is likely.
- If BTC dominance rises and the BTC price falls, a strong dump of altcoins is likely.
- If BTC dominance falls and the BTC price rises, a big pump of altcoins is likely.
Based on this data, we built a percentage scale of the prevailing market direction that most accurately shows the current daily sentiment, where:
- 0% corresponds to the least favorable time to buy altcoins;
- 100% corresponds to the most favorable time to buy altcoins.
Tests
Coming soon…
Where to find the model
The Tick index & RT index models are available as oscillator indicators.
Besides the indicator, the Alt meter model also has a scale in the platform header.
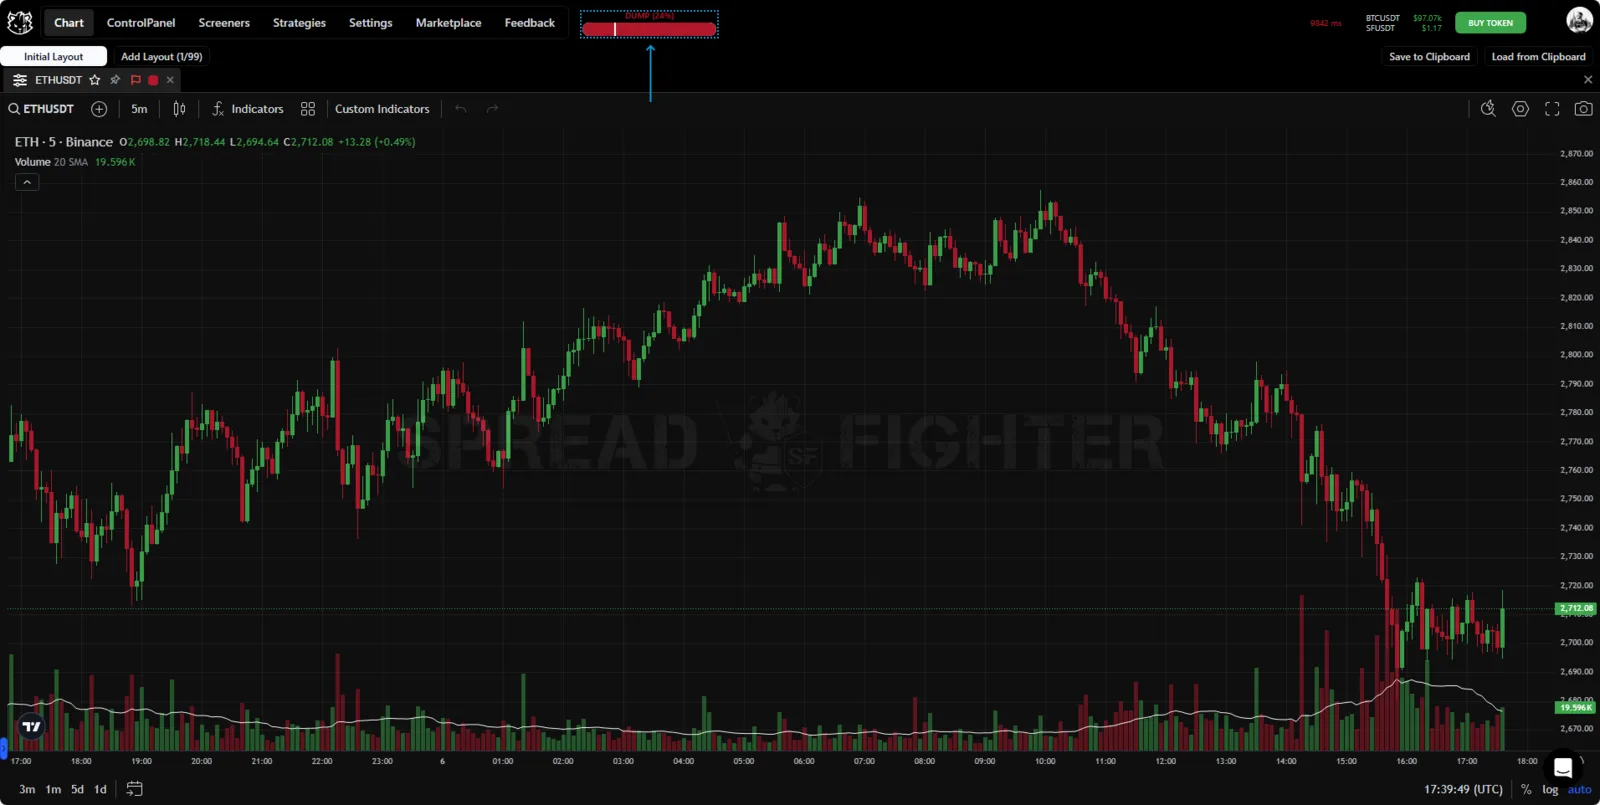
Alt meter scale
Use cases
The Alt meter, Tick index and RT index models visualize the current market sentiment at the moment. They can serve as a guide for opening and closing short-term trades.
In a flat market, a trader can open a long position when Tick Index approaches -200 and exit when the indicator shows a value close to +200. The trader can use the Smart High&Low tool and compare these readings with key support and resistance levels from the existing trading range before entering the market.
In a trending market, Tick Index can be used to time entries and exits. Traders can open a long position when the tick index falls below -100 and exit when the indicator gives +100. Traders can compare these readings with key support and resistance levels from the existing trading range before entering the market.