Bid & ask delta
The difference in volume across market depth.
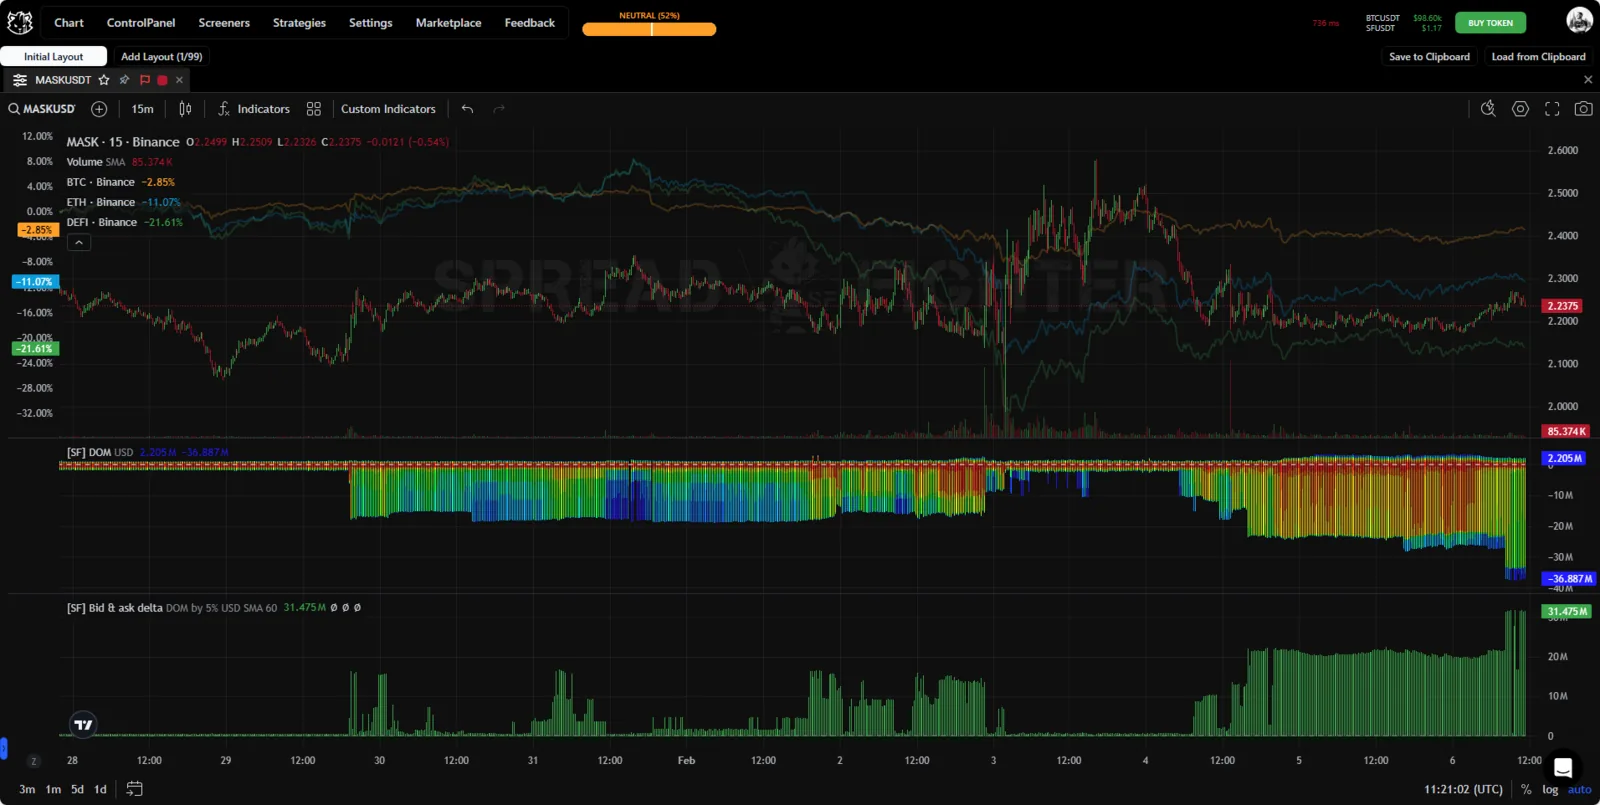
Indicator appearance.
Description
Bid & ask delta calculates the absolute difference in volume between the various ask and bid limit orders and displays the values as a bar histogram. Positive values mean that bid volume is larger than ask volume. Negative values mean the opposite.
Bid & ask imbalance is the ratio of the difference between bid-side and ask-side market depth to the total market depth.
Tests
tip
Coming soon…
Location
The Bid & ask delta model is available only as an indicator.
Functionality
The user can change the following parameters:
- Symbol - the asset for which to display the model values.
- Source - the data source for the calculation. Available options: 'Filled orders', 'Best bid & ask size', 'DOM by 1%', 'DOM by 2%', 'DOM by 3%', 'DOM by 4%', 'DOM by 5%', 'DOM by 6%', 'DOM by 7%', 'DOM by 8%', 'DOM by 9%', 'DOM by 10%’.
- Measure - the unit of measurement: either in the quote asset or in dollars;
- Moving average typeline - the type of moving average to calculate. Possible values: "SMA" (simple moving average), "EMA" (exponential moving average), "WMA" (weighted moving average), "VWMA" (volume-weighted moving average), "LSMA" (linear regression);
- Length - the period of the moving average and the standard deviation;
- Show metrics? - a button that turns on the display of the standard deviation and the moving average.

Use cases
tip
Coming soon…