Depth of market
Market depth oscillator.
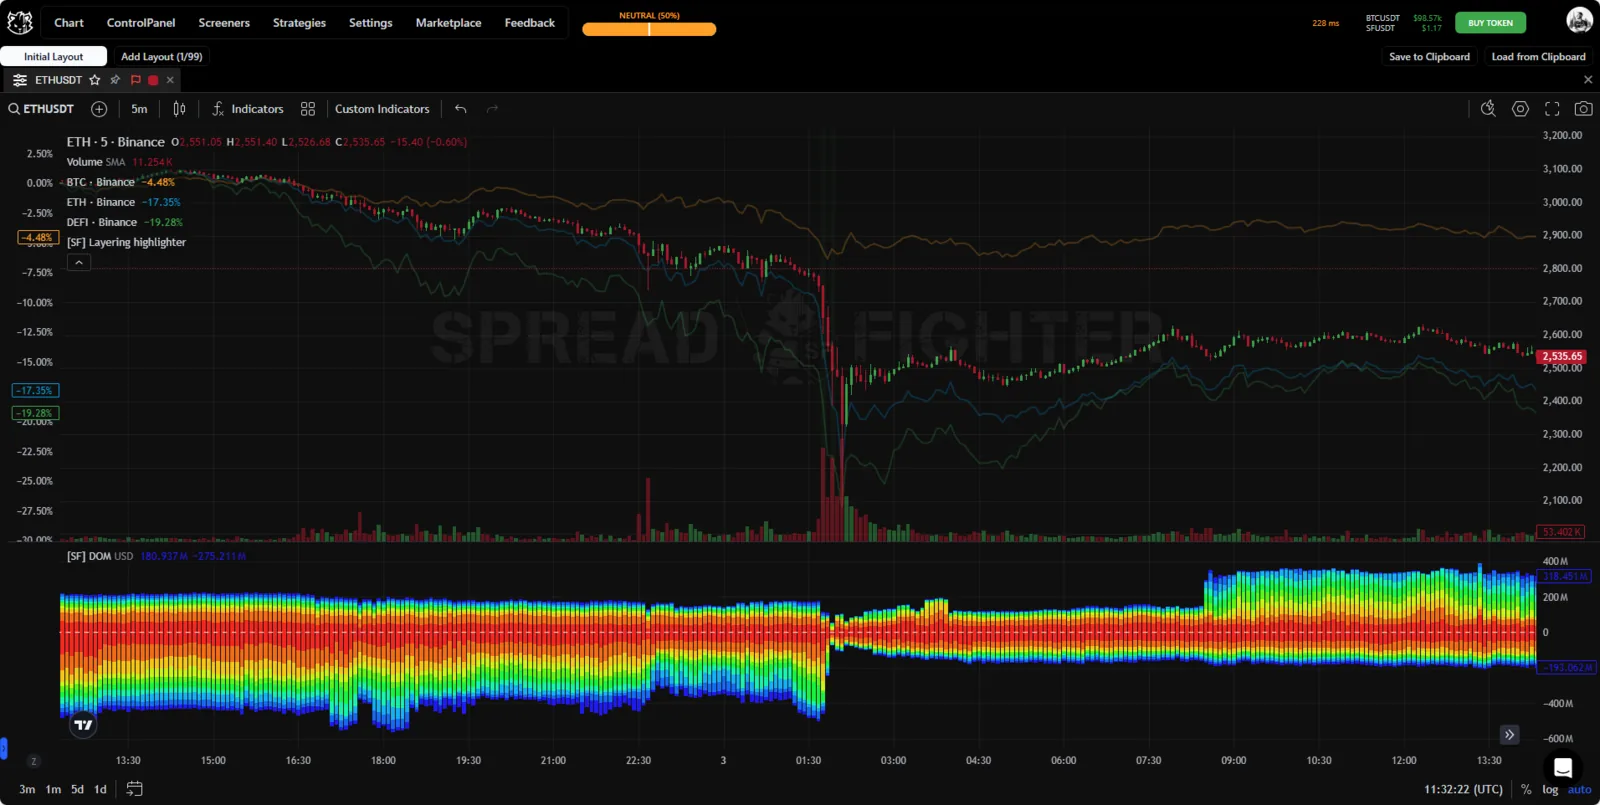
Indicator appearance.
Description
Depth of market (DOM) calculates market depth in 1% steps from the mark price, from 1% to 10%. Market depth is calculated as the sum of the resting limit orders.
The indicator values are shown as a histogram with gradient coloring. The warmest color corresponds to the depth closest to the mark price, and the coldest color to the depth farthest from it.
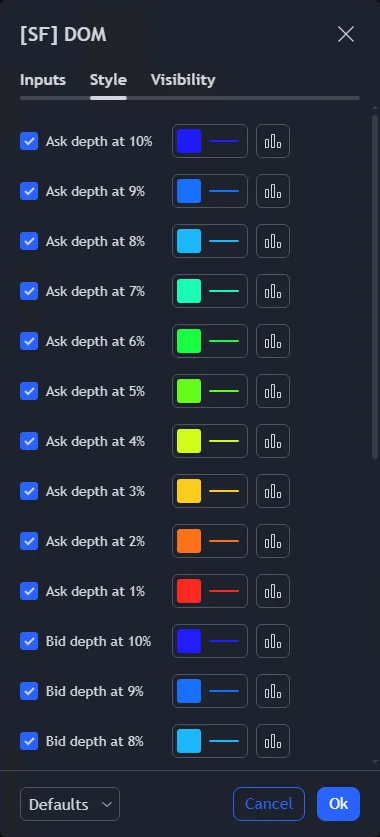
Indicator style settings.
Tests
Coming soon…
Location
The model is available only as an indicator.
Functionality
The user can select the asset for which to show market depth, and the units: either USD or the quote asset (Coin).
In the style settings window, the user can choose the display colors and the transparency of the indicator for each depth value.
Use cases
The liquidity oscillator lets you measure how liquid the order book is on the ask and bid sides.
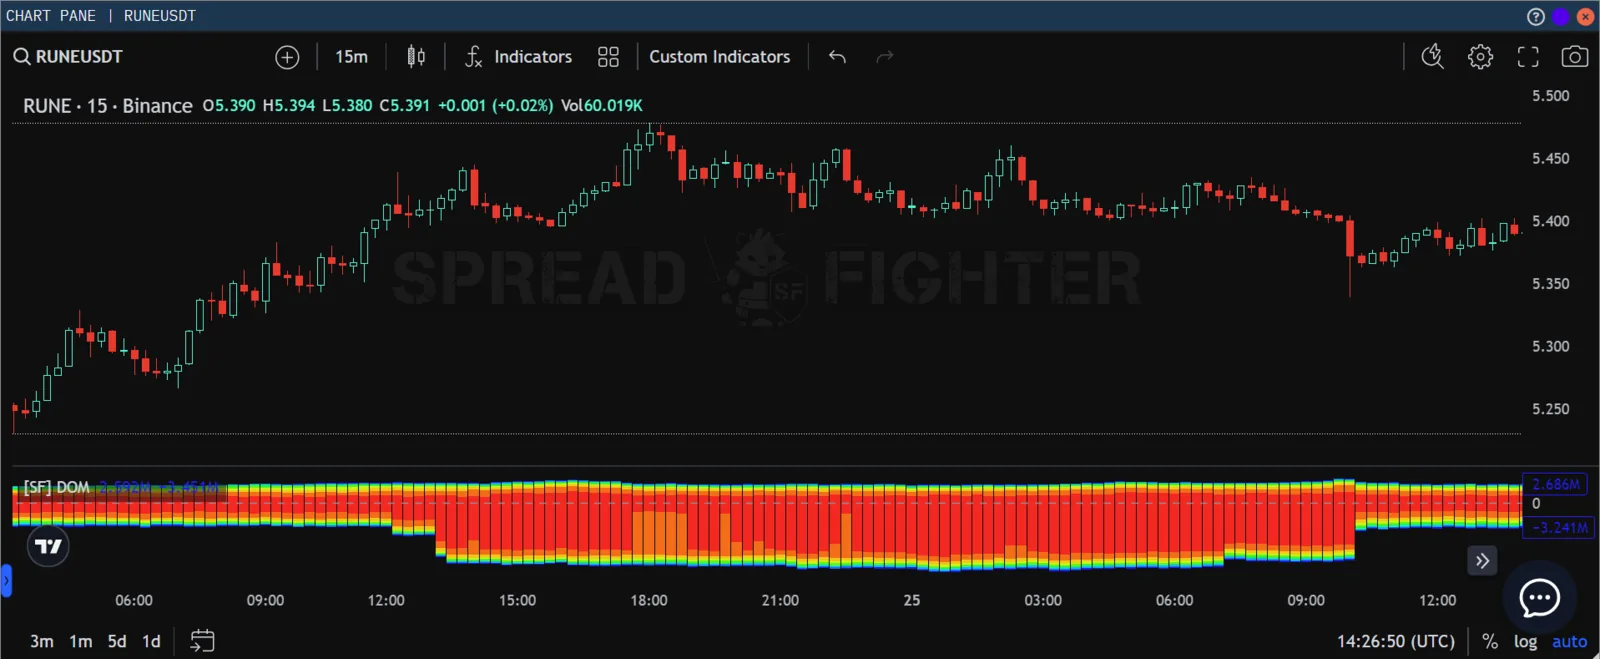
Consider an example with RUNE. On 24 Feb 2024 at 12:15 UTC+3, the DOM oscillator shows an increase in bid-side orders.
How the imbalance looks in the limit order book.
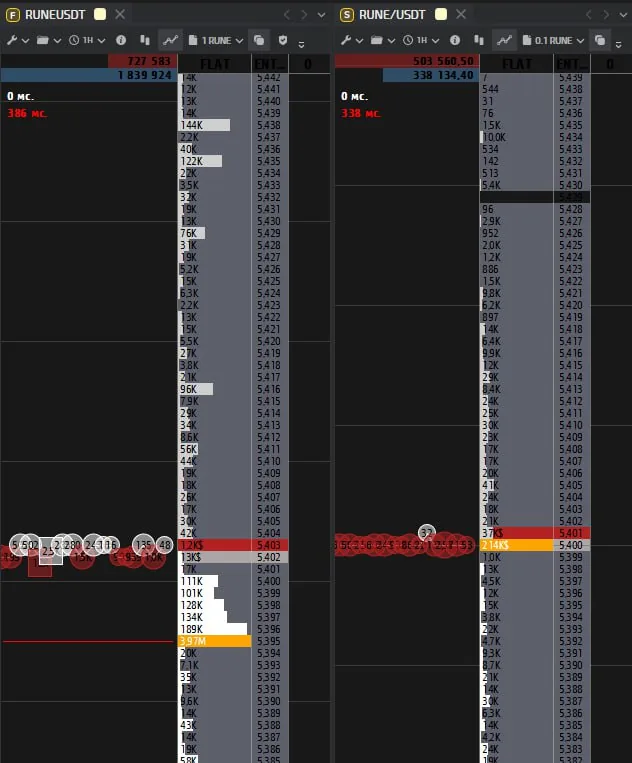
How the imbalance looks in the limit order book.
On 25 Feb 2024 at 10:00 UTC+3, the placed orders were pulled, and the asset price reacted with a 1.5% decline.
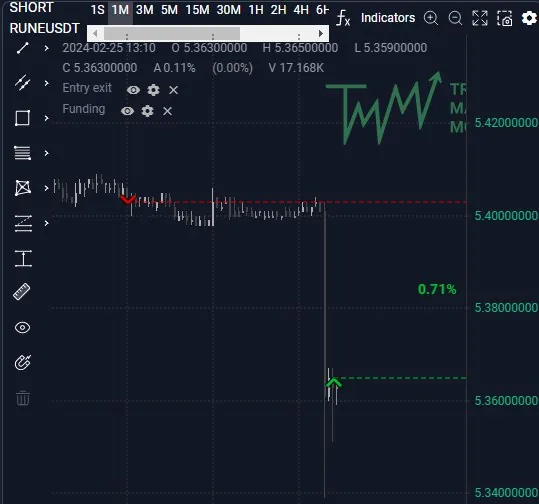
How the situation played out.
Usage scenarios for the indicator are also described in the article "Where to start: practical examples of using SpreadFighter".