Footprint (Volume Footprint)
Volume by price inside every bar, right on the chart: sells and buys per level, bar delta and volume, POC and Value Area, imbalances, stacked imbalances and unfinished auctions.
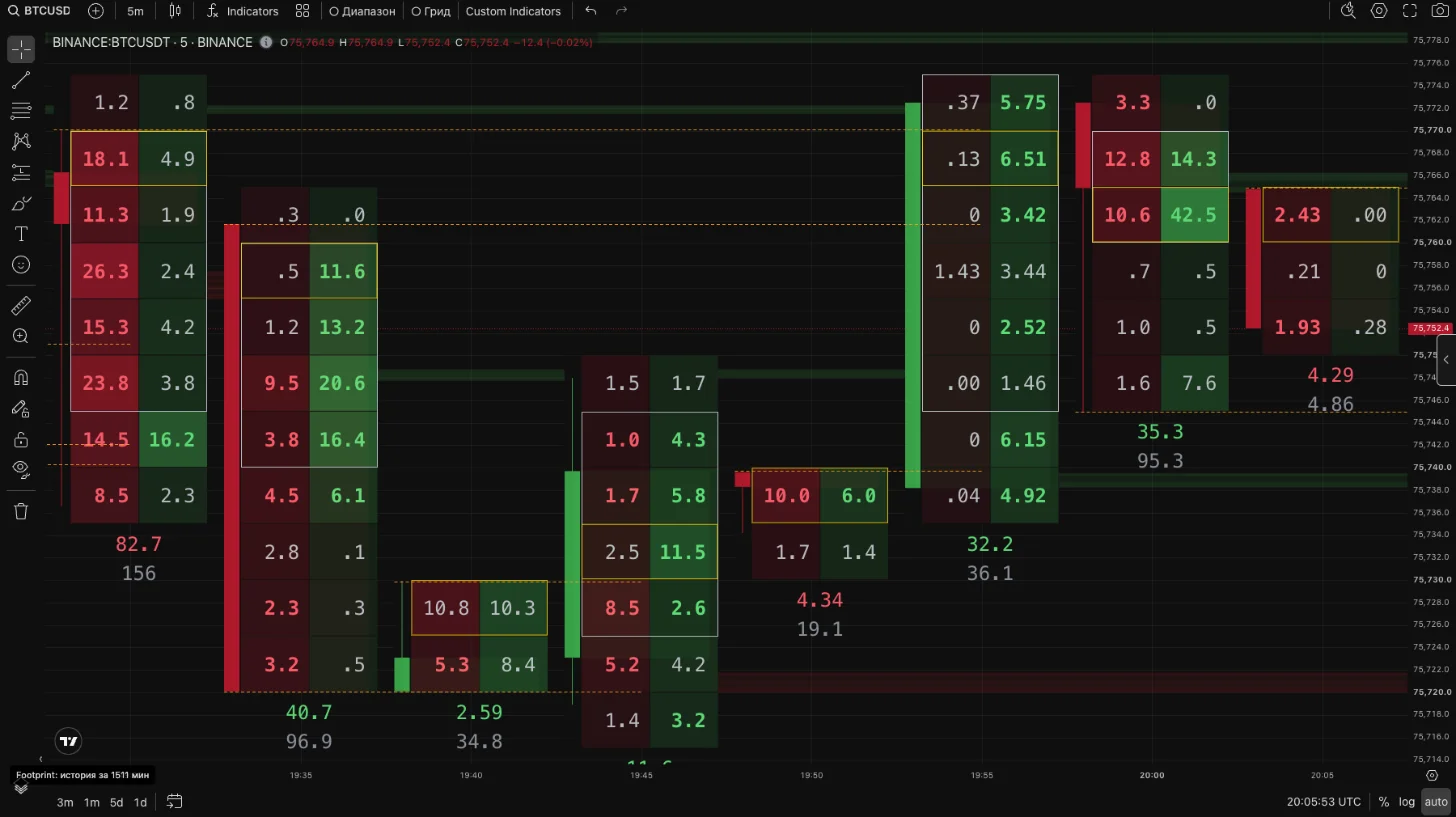
BTCUSDT footprint on a 5-minute chart: sells on the left of a cell, buys on the right, delta and volume under the bar. Yellow frame — POC, white — Value Area, bold coloured numbers — imbalances.
What it is
The footprint shows how much was sold and bought at market at each price level inside a bar. A regular candle only tells where the bar opened and closed; the footprint shows where the volume traded inside it and which side was more aggressive.
The data is the exchange trade tape (each trade with its price and taker side), aggregated by level on the server. The footprint works on Binance, Hyperliquid (including HIP-3 markets), Aster, Bybit and OKX futures.
How to turn it on
- Open the chart panel settings (the icon to the left of the tab name) → the Footprint tab.
- Turn on Footprint. The setting is stored with this chart.
- Switch the chart to a timeframe no higher than Max timeframe (5m by default).
Faster with a hotkey: by default Alt + O turns the footprint on and off on the chart under the cursor.
Access and history
| Plan | What you see |
|---|---|
| Pro and Max | Real-time footprint |
| Free | Footprint delayed by 15 minutes |
The server stores closed bars: 1-minute bars for 14 days, 3- and 5-minute bars for 60 days, higher timeframes for a year. On Binance, history is loaded from 23 Jun 2026 for daily bars and from 14 Sep 2026 for 4-hour bars. On other timeframes and exchanges it starts from the footprint launch (30 Sep 2026 for Binance and Hyperliquid, 1 Oct 2026 for Aster, 4 Nov 2026 for Bybit and OKX). The footprint is also available on Binance second timeframes.
How to read it
| Element | Meaning |
|---|---|
| Bid × Ask cell | Left: market sells (hit the bids). Right: market buys (hit the asks) at this level |
| Coloured number under the bar | Bar delta: buys minus sells. No sign, the colour shows the side |
| Gray number under the bar | Total bar volume |
| Yellow frame | POC — the level with the largest volume of the bar |
| White frame | Value Area — levels around the POC that hold the set share of the bar volume (68.27% by default) |
| Bold coloured number | Imbalance: one side at a level is at least 3 times larger than the other, diagonally |
| Coloured zone to the right | Stacked imbalance: several imbalances of one side in a row. It extends to the right until price trades back through it |
| Orange dashed line | Unfinished auction: both sides traded at the extreme level of the bar. It extends to the right until a bar returns to this price |
Imbalance is calculated diagonally, as on TradingView: buys at a level are compared with sells one level below, sells with buys one level above.
When the numbers do not fit the cell width, the Bid × Ask mode shows the delta. If that does not fit either, the bar becomes a coloured strip without numbers. Zoom in to see both sides.
Settings
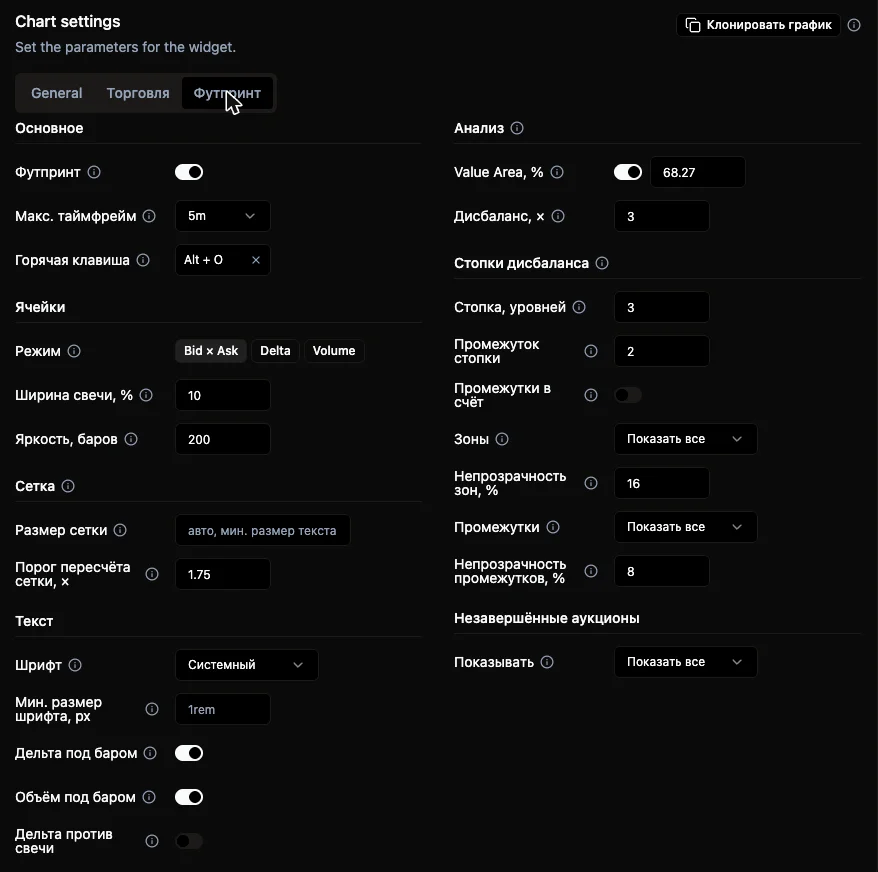
The Footprint tab in the chart panel settings.
General
- Footprint — turn it on for this chart.
- Max timeframe — the highest timeframe where the footprint is drawn. It is not shown at all on higher ones, even when turned on. Second timeframes are always below it.
- Hotkey — Alt + a key; turns the footprint on and off on the chart under the cursor.
Cells
- Mode — Bid × Ask, Delta (buys minus sells) or Volume (buys plus sells).
- Candle width, % — the candle on the left of each bar, as a share of the bar width; 0 means no candle.
- Intensity, bars — the cell brightness scale: the 95th percentile over this many last bars, so bars are compared with each other. 1 means each bar has its own scale. 200 by default.
Grid
- Scaled grid size — how many rows the chart height is split into. Empty means as many rows as fit the numbers.
- Regrid threshold, × — how sensitive the grid is to zoom: a row keeps its price step until its height gets this many times away from the target. 1.75 by default.
The calculation does not depend on the grid: POC, Value Area, imbalances and unfinished auctions are computed on the original levels of the bar and are the same at any zoom.
Text
- Font — system monospace or Iosevka (narrower, so numbers fit narrower bars).
- Min font size, px — numbers are never drawn smaller.
- Delta under bar, Volume under bar — labels under the bar.
- Delta vs candle — a frame around the delta when it disagrees with the candle: a green candle with negative delta or a red one with positive delta.
Analysis
- Value Area, % — the share of bar volume in the Value Area, 68.27% by default (±1σ).
- Imbalance, × — how many times one side must be larger than the other, diagonally. 3 by default.
Stacked imbalances
- Stacked, levels — how many imbalances of one side in a row make a zone. 3 by default.
- Stacked gap — how many levels without an imbalance can be inside a stack without breaking it. 2 by default.
- Gaps count — gap levels also count toward the stack length.
- Zones, Gaps — show all, show only active ones (which price has not traded through yet) or hide; each has its own opacity.
Unfinished auctions
- Show — all, only active ones (price has not returned to them yet) or hide.
If you need a footprint without numbers — just where the volume traded, POC, Value Area and imbalances on any timeframe — use the Orderflow Light indicator.