HFT activity, Average trade size, Tape, Order flow intensity
Assessment of order flow intensity and tape speed.
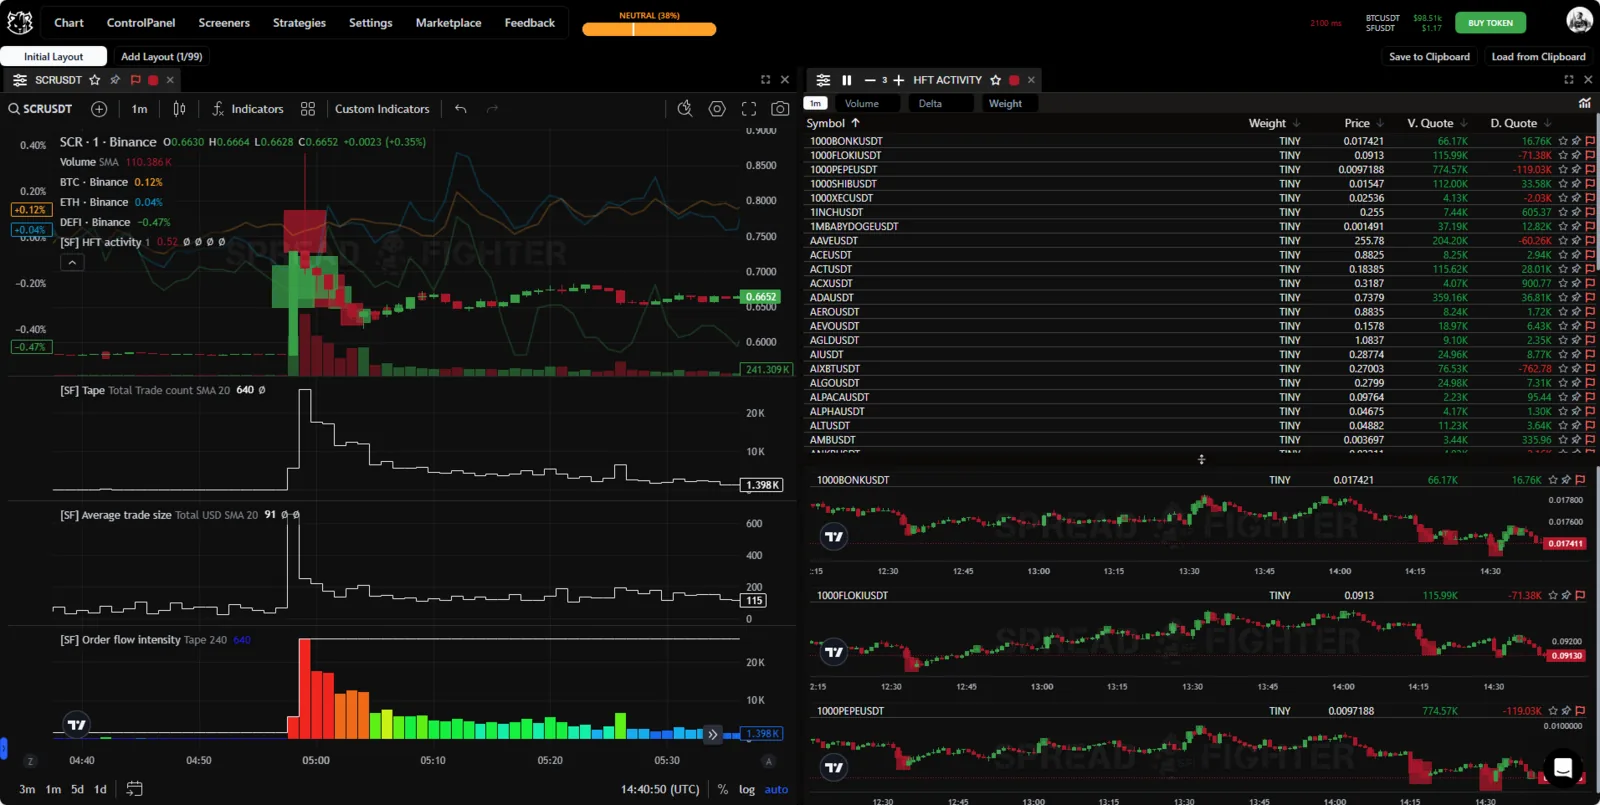
Indicators appearance.
Model description
Tape is an oscillator of the number of trades.
Average trade size calculates the average trade size from volume and the number of trades.
Order flow intensity is an order flow intensity oscillator colored with a gradient that depends on the Z-Score of the metric.
The standard score (Z-Score) is a measure of the relative dispersion of an observed or measured value. It shows how many standard deviations the value lies from the mean.
HFT Activity shows on the chart anomalous activity of high-frequency algorithms that stands out from the general conjuncture. The adaptive advanced HFT activity model estimates the tape speed in real time. Using the Gaussian distribution and the Z-score, it classifies the speed by significance. Order flow intensity is thus split into the following categories:
| Category | Probability of occurrence | Significance |
|---|---|---|
| Tiny | 31.7% | Minimal |
| Small | 4.5% | Minor |
| Normal | 0.3% | Medium |
| Large | ~0.01% | High |
| Huge | ~0.001% | Maximum |
So order flow intensity in the tiny & small categories can signal the birth of activity, and order flow intensity in the large & huge categories can signal the climax of trading activity.
The model uses the standard deviation method. This lets it adapt to the unique behavior of individual assets and to changing market conditions.
The main differences and advantages of HFT activity over Power trades are the speed of response (signals arrive several seconds earlier) and accuracy
Tests
Coming soon…
Location
The Tape, Average trade size and Order flow intensity models are available only as indicators.
To add the "HFT activity" tool to the workspace, first click the "Screeners" button in the platform header. Then click the button of the same name in the "Microstructure" section.
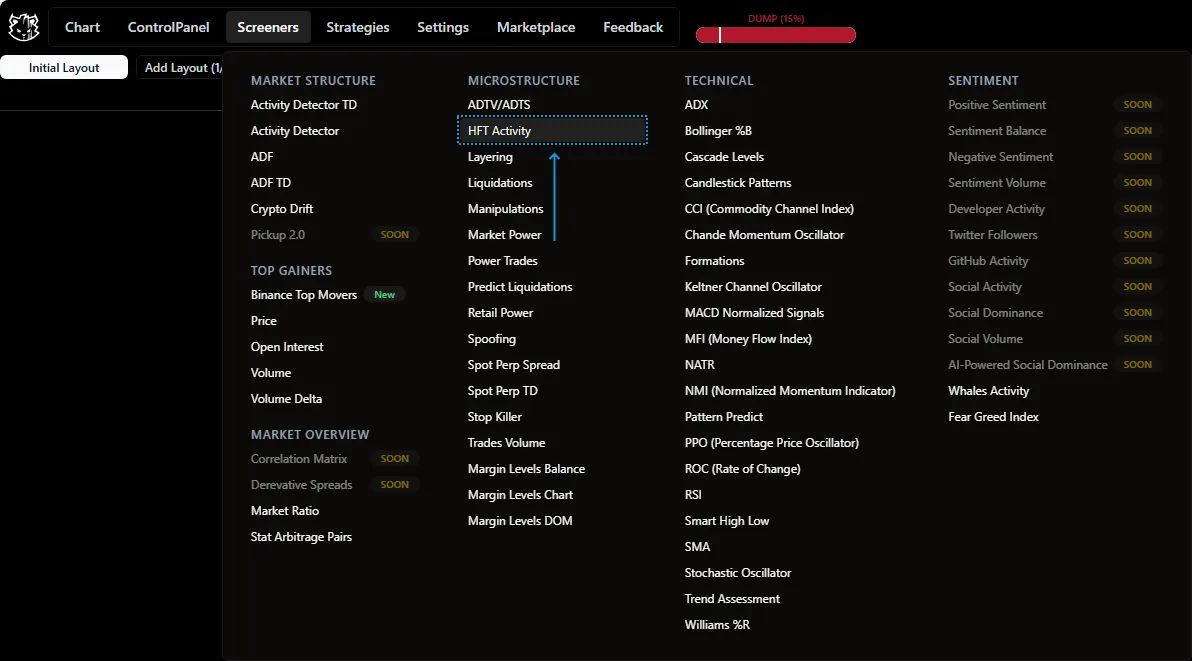
Widget location.
Features
Indicators
The Tape indicator shows the number of trades per minute, and the Average trade size indicator shows the average size.
The HFT Activity model has two color indications: green highlights buyer activity, red highlights seller activity. HFT Activity is shown as squares of different sizes that mark the points on the chart with anomalous algorithm activity.
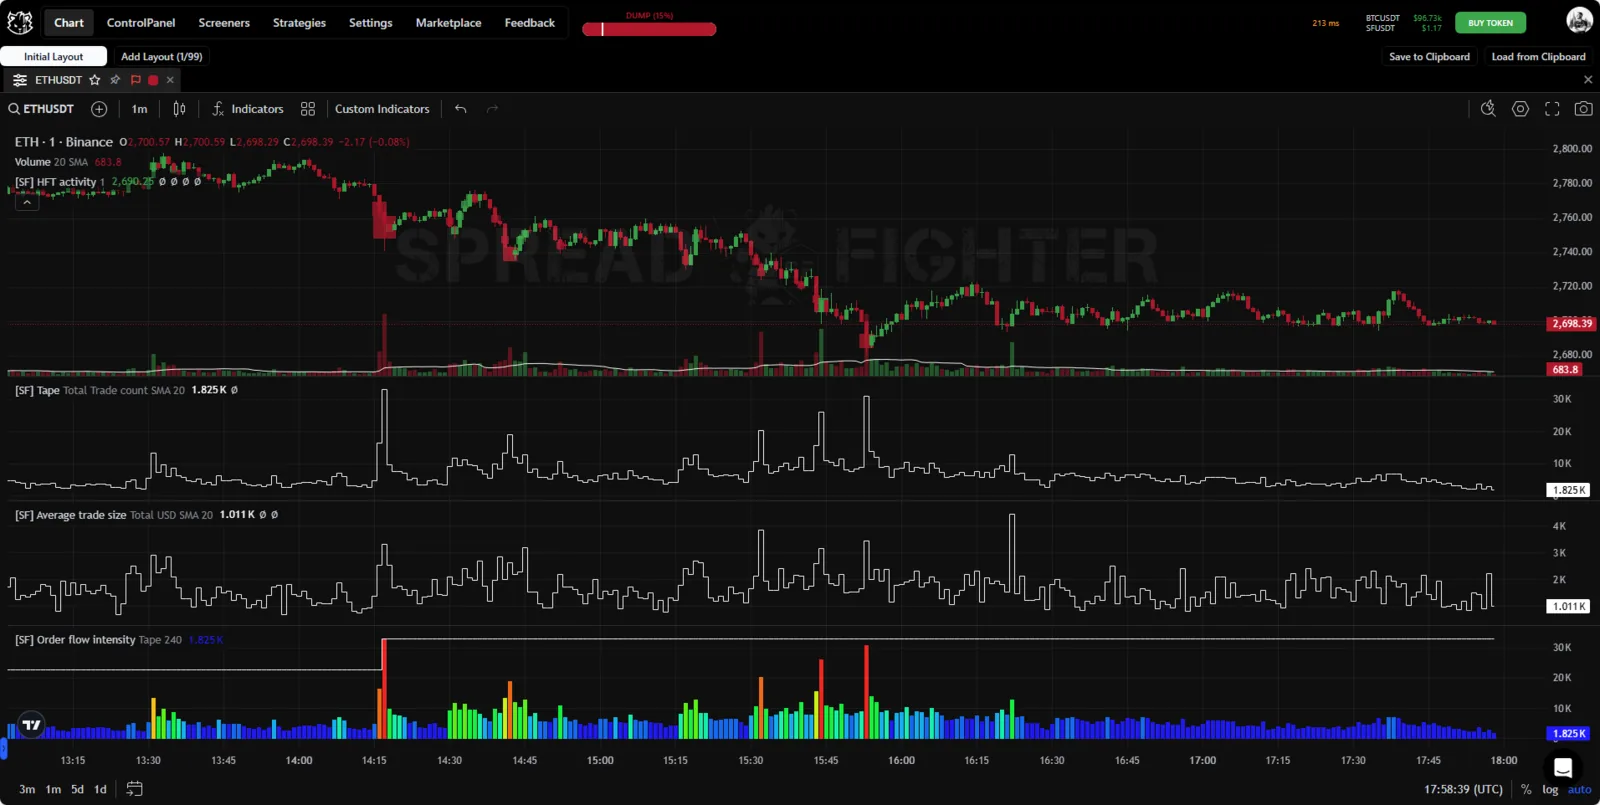
HFT activity, Average trade size, Tape indicators.
The Order flow intensity indicator shows similar metrics. The only difference is that each histogram column is colored according to its value. The warmer the color, the higher the trading intensity.
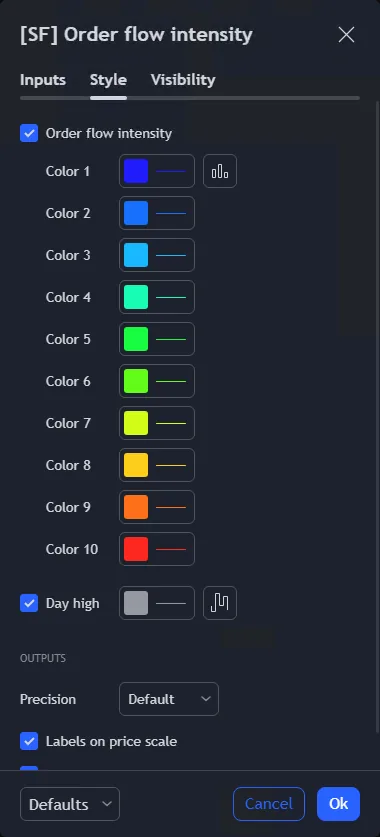
Chart settings of the Order flow intensity indicator.
Widget
HFT activity is a scanner that shows, in real time, anomalous surges of high-frequency market algorithms and acceleration of the print tape. The user gets the information as a table with the following columns:
- Weight - the "signal weight",
- Price - the price at which the activity was recorded,
- V. Quote - the trading volume at the moment the signal arrived,
- D. Quote - the taker-side volume delta at the moment the signal arrived.
The following weight types are available:
- TINY - the lowest significant order flow intensity;
- SMALL - minor order flow intensity;
- NORMAL - order flow intensity of medium significance;
- LARGE - order flow intensity of "high significance";
- HUGE - the highest significant order flow intensity.
If the weight filter is filled in, the widget sends only the situations with the selected weights.
Besides filtering by weight, you can also filter by volume and volume delta.
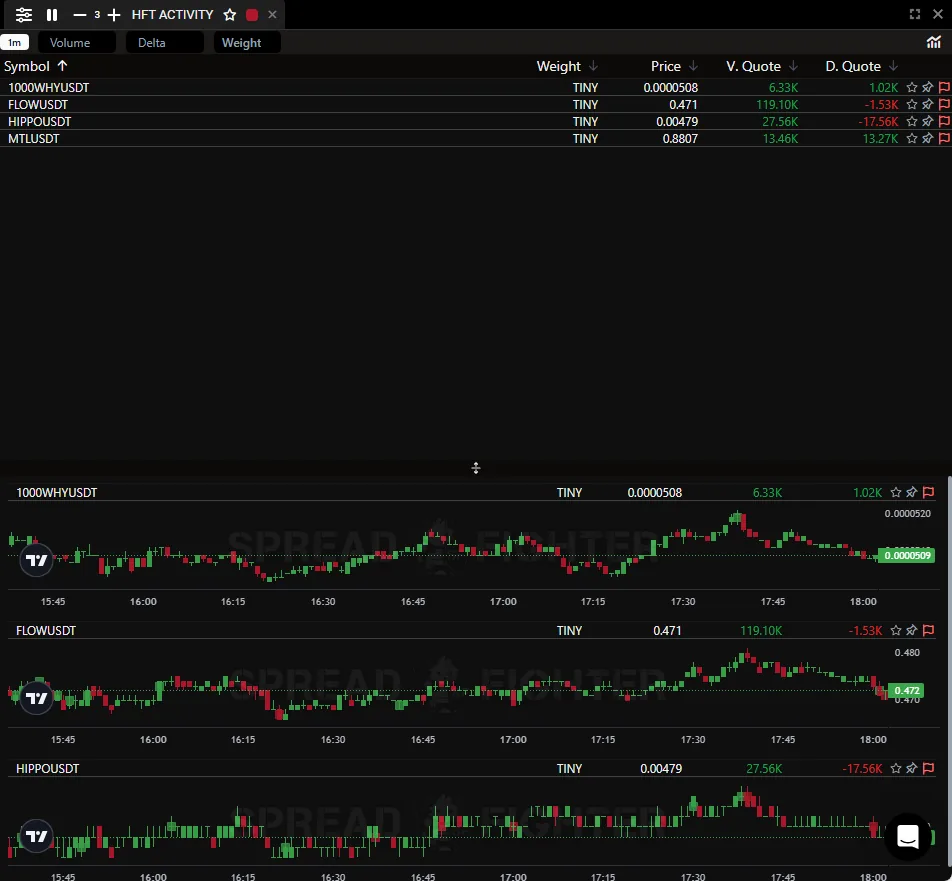
HFT activity widget.
Use cases
The tool can be used for:
- finding reversal points and opening and closing positions more precisely at the large & huge points;
- confirming breakout entries for momentum strategies at the tiny & small points;
- finding assets "in play" as fast as possible for manual trades.
HFT activity can identify the start of an asset's price acceleration and a pump. For this scenario, we recommend the lowest scanner sensitivity setting and using it together with Manipulation monitor.
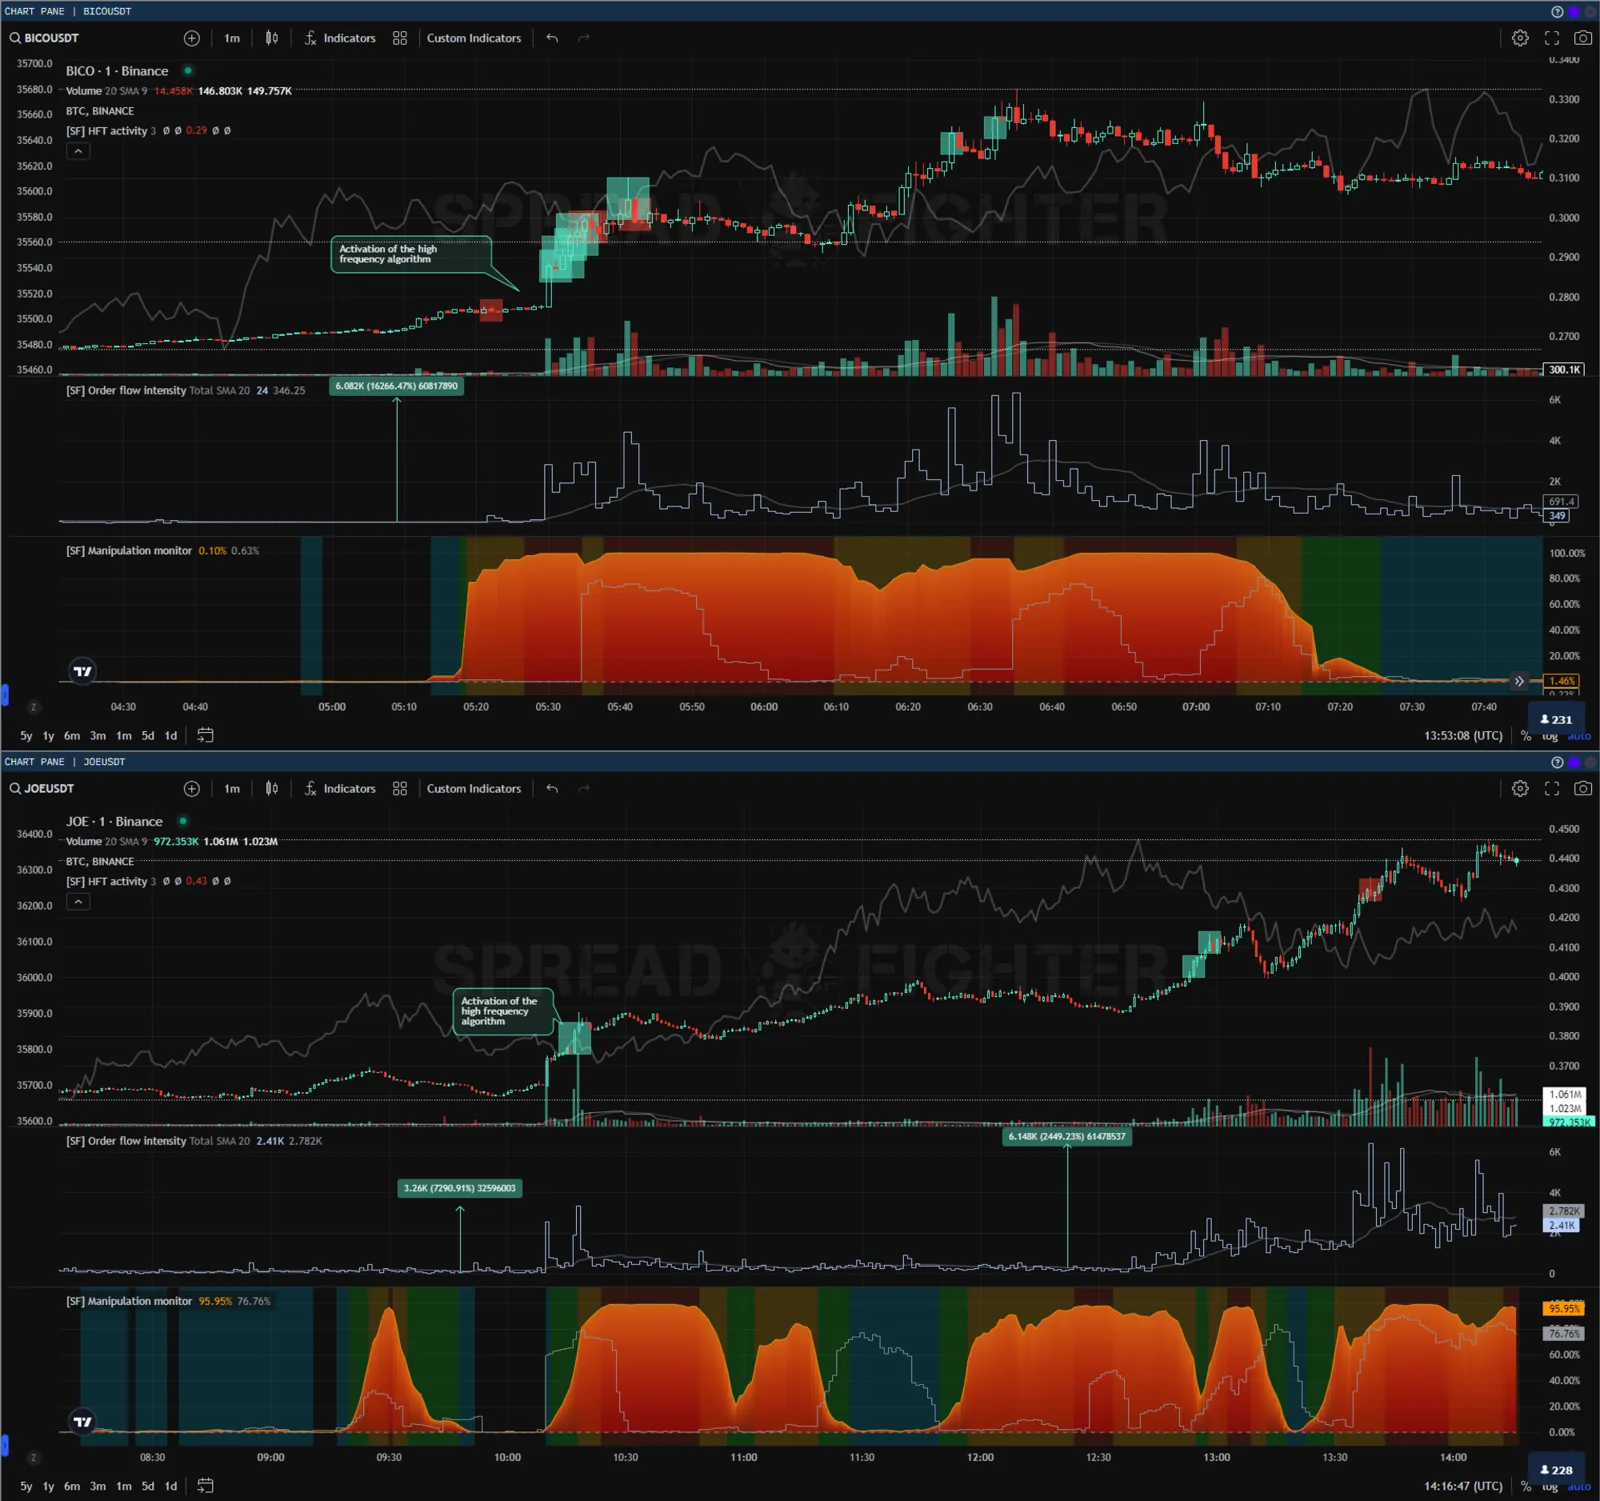
Searching for emerging moves.
HFT activity can also point to price extremes and reversals quite accurately. For this scenario, we recommend the strictest scanner sensitivity setting.
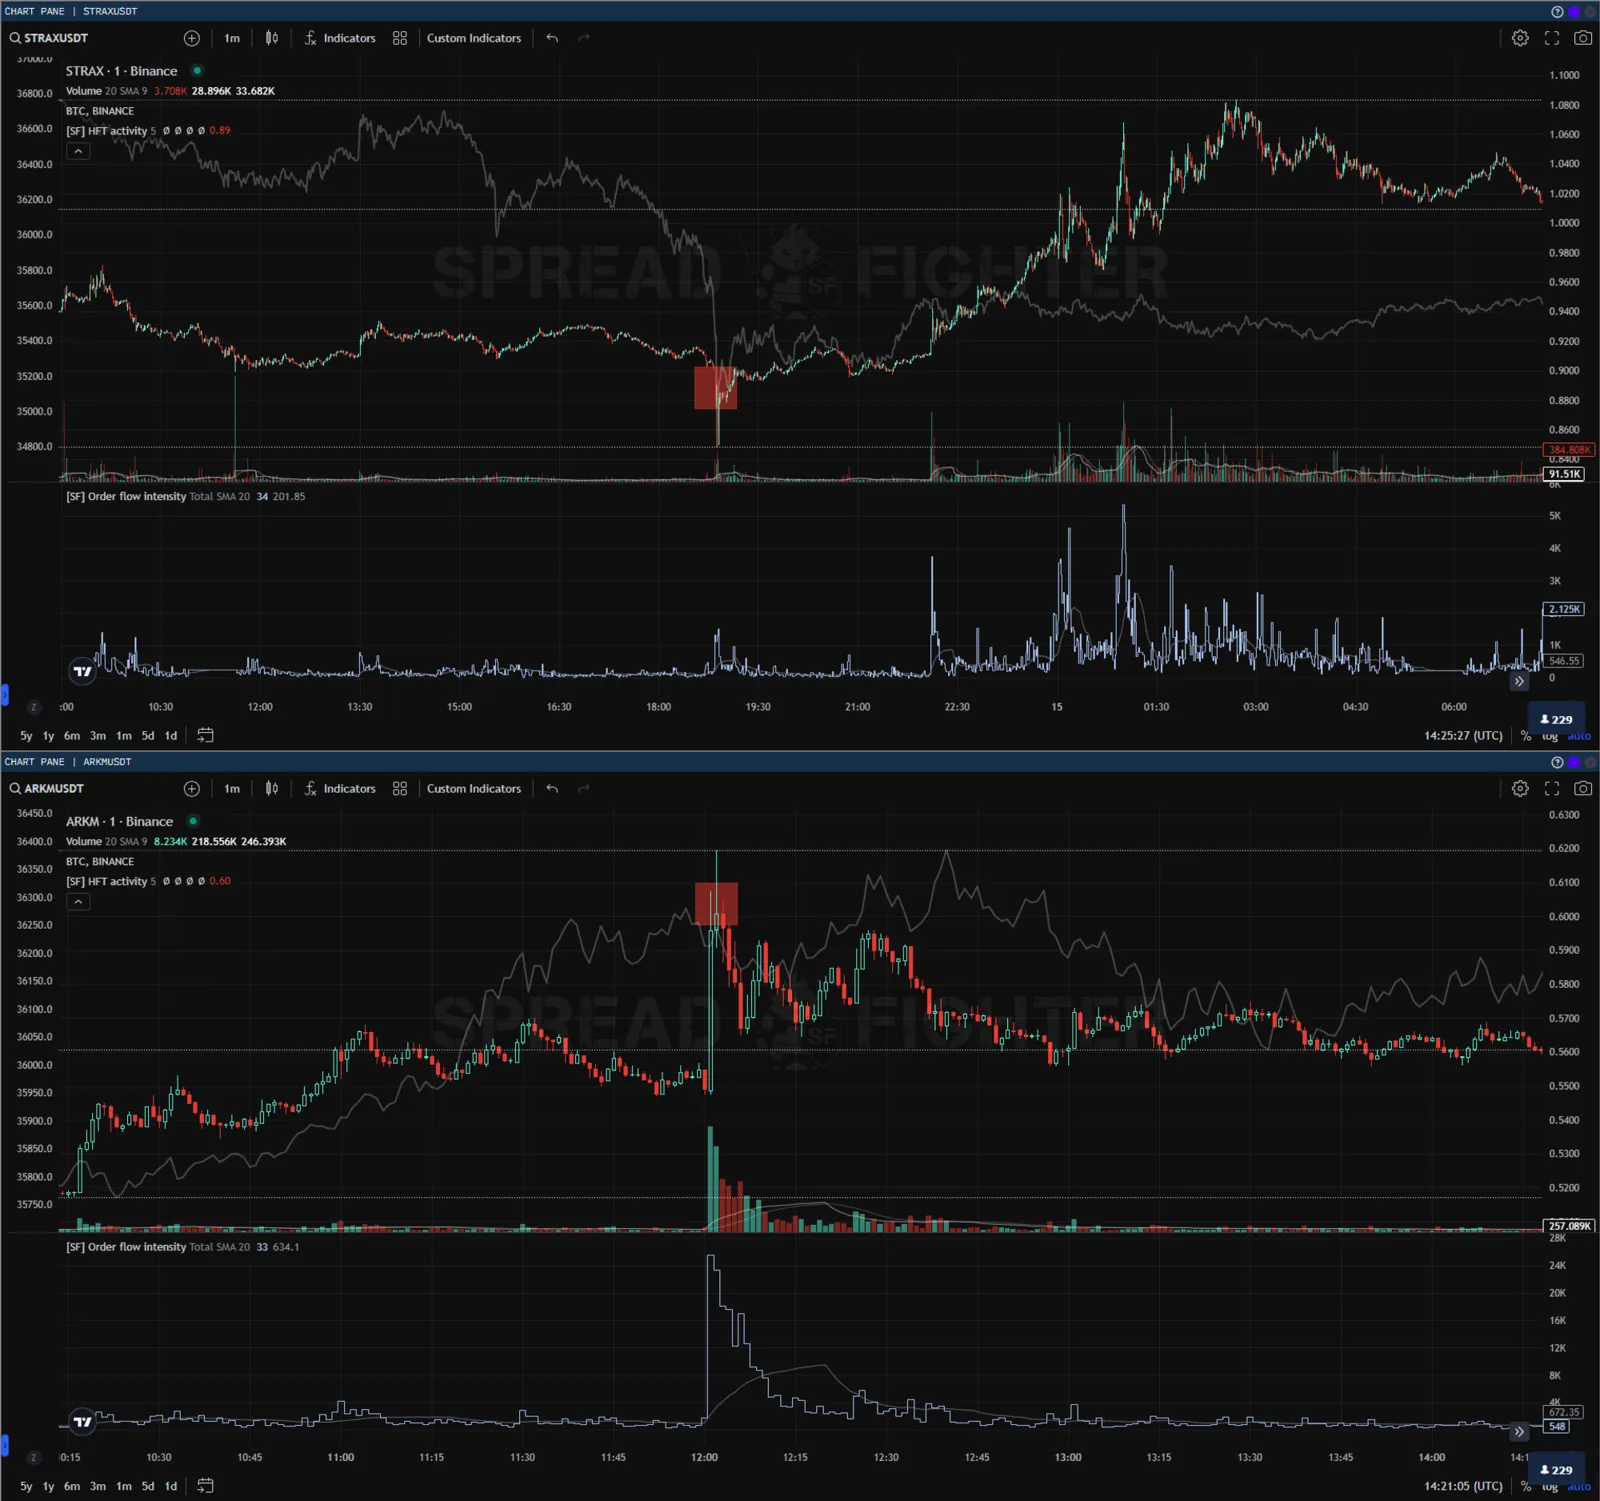
Searching for extremes.