Liquidation Forecast Screener
A market-wide screener: the probability of forced liquidations for every instrument in the next 15 minutes, hour and 4 hours, next to what happened in the last hour. It answers "where it is most likely", not "which way price will go".
What it is
Liquidation Forecast Screener is a table of all instruments at once. For each instrument it shows the forecast of the Liquidation Forecast model: how likely it is that at least one forced liquidation will happen on it in the next 15 minutes, hour and 4 hours.
The Liquidation Forecast indicator shows the history of this probability for one instrument on the chart. The screener shows the current probability across the whole market, so you can find where the liquidation flow is most likely to wake up.
- Where: Screeners → Microstructure → Liquidation Forecast Screener. On the pane the widget is labelled Liq Forecast.
- Plan: Pro and Max.
- Exchanges: Binance and Hyperliquid, about 800 perpetual futures. The table only includes instruments for which the model could compute a forecast in the last minute: they have a seasonal baseline and a volatility history.
- Updates: once a minute, together with the model.
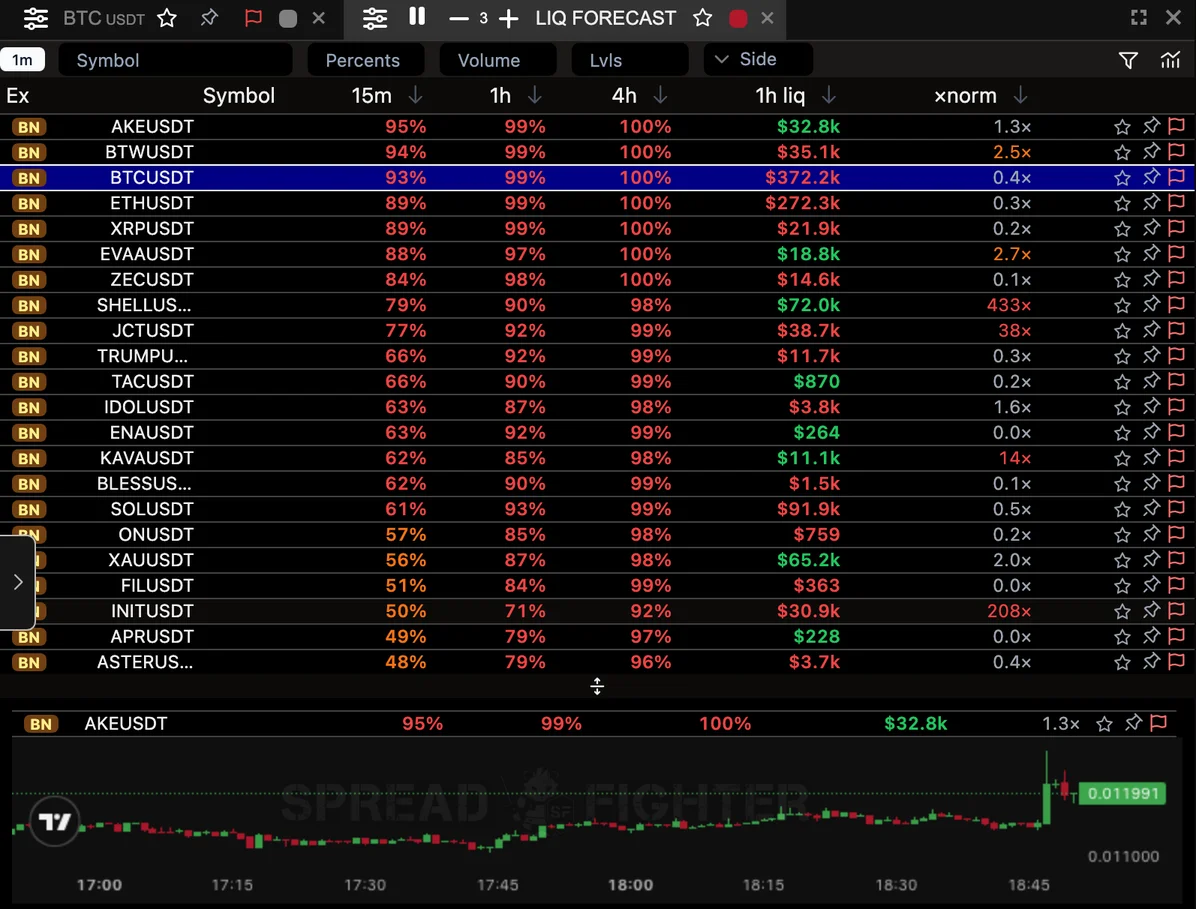
Market-wide liquidation forecast: the table is sorted by the 15-minute probability, with mini-charts of the top instruments below it.
The screener replaced the former Predict Liquidations Screener with HIGH/MEDIUM/LOW levels. If the old screener was in your layout, the new one now sits in its place; you do not need to rearrange anything. Why the old levels were retired is explained in the Predict Liquidations article.
Columns
| Column | What it shows |
|---|---|
| Ex | The instrument's exchange |
| Symbol | The instrument; a click switches the colour-linked chart |
| 15m | Probability of at least one liquidation in the next 15 minutes |
| 1h | The same for the next hour |
| 4h | The same for the next 4 hours |
| 1h liq | How much was liquidated in the last hour, in dollars |
| ×norm | The last hour against the instrument's usual volume at this time of day and week |
The full description of each column appears when you hover over its header.
How to read the probabilities
The probabilities are calibrated: of the minutes where the model promised 30%, a liquidation happened in about 30% of cases. That is why they can be compared across instruments, unlike dollar volumes.
The colour hints at the level:
- red — 60% and above;
- orange — from 30 to 60%;
- grey — below 30%.
By default the table is sorted by the 15m column. For liquid instruments (BTC, ETH, SOL) the probability over an hour or 4 hours is almost always close to 100%, so the long horizons do not tell them apart. At 15 minutes the difference between instruments is easier to see. For thin instruments, on the contrary, the 1h and 4h columns are more useful. You can change the sorting by clicking any column header.
How to read "1h liq" and "×norm"
These two columns describe the past hour, not a forecast.
- 1h liq — the total of liquidations over the last 60 minutes. The colour shows who was liquidated more: red — longs, green — shorts. The split by side appears when you hover over the number.
- ×norm — how many times this hour exceeds what is usual for the instrument at this time. Orange from 2×, red from 5×. The number tells a truly unusual hour from an ordinary one: $1M of liquidations on BTC is normal, on a thin altcoin it is an event.
Filters
The funnel button in the pane header opens the filters:
- Exchanges — Binance, Hyperliquid or both;
- Asset types — crypto, stocks, commodities, indices, forex;
- pane filters and dashboard global filters, as in other screeners.
What the screener does not show
- Price direction. A high probability means that a liquidation flow is likely. Where price goes after that, the model does not predict.
- The side of a future flush. The "1h liq" column shows who was liquidated in the past hour, not who will be. Where the forced exits of longs and shorts sit is shown in the Liquidation Map.
- Expected volume. The model computes it too, but it is reliable only on liquid instruments (details in the Liquidation Forecast article). That is why it is not in the table.
How it differs from Liquidation Spike
| Liquidation Spike | Liquidation Forecast Screener | |
|---|---|---|
| Looks at | The last 5 minutes | The next 15 minutes, hour, 4 hours |
| Answers | Where the liquidation flow is already above normal | Where it is most likely to happen |
| List | Only instruments with a spike right now | All instruments with a forecast |
A working combination: Liquidation Forecast Screener finds instruments where liquidations are most likely, Liquidation Spike shows where the flow has already started, and the Liquidation Map shows how far from price the forced exits sit.