Liquidation Spike
The screener shows which instruments have a liquidation flow clearly above their own norm right now. It answers "where" and "when", but not "where will price go".
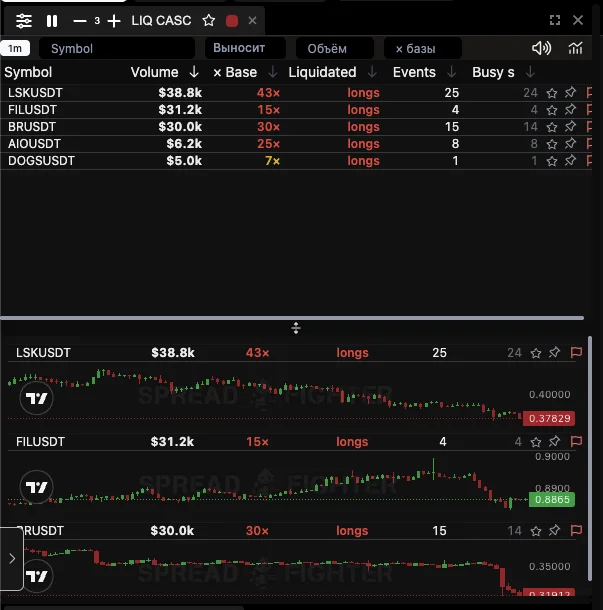
Five instruments at the moment of a market-wide wipe-out of longs. Sorted by volume; the × Base column shows how large this is for each of them.
The snapshot shows three things at once, which is what the screener is built for.
First: all five rows are longs. When the whole list is one-sided, these are not five separate stories but one market-wide wipe-out.
Second: DOGSUSDT with a volume of $5.0k sits in the same list as LSKUSDT at $38.8k, and that is correct. Comparing them in dollars is meaningless; compare them in the × Base column.
Third: LSKUSDT has 25 events and 24 busy seconds, so the events don't merge into one instant but are spread over time. FILUSDT has only 4 events worth $31.2k, which is a few large positions, not a chain.
What it is
Liquidation Spike is a screener in the Microstructure section. Each row is an instrument that has seen an unusually large number of forced liquidations over the last five minutes. Clicking a row switches the color-linked chart, where you can already look at Liquidation Map and choose the stop distance.
An empty list is a normal state, not a breakage. In about 7% of five-minute windows across the whole market, nothing happens that would be worth showing.
Why "× base" and not dollar volume
This is the main thing to understand about this screener, otherwise it is easy to misread.
The liquidation flow is sparse and extremely unevenly distributed. The median instrument sees one liquidation per 85 minutes, the top one two per minute. Of 151,106 non-empty minutes in a week, 100,392 had exactly one event.
So any single threshold in absolute numbers is really a liquidity ranking, not an event ranking. We measured this on a week of flow, taking the classic threshold of "ten liquidations per minute":
| Weekly flow | Instruments | Triggers per instrument | Never triggered |
|---|---|---|---|
| under 100 | 347 | 0.3 | 249 |
| 100 – 499 | 323 | 1.6 | 46 |
| 500 – 1,999 | 102 | 6.6 | 2 |
| 2,000 and more | 24 | 83.2 | 0 |
The gap is 277 times. A list by an absolute threshold would be an endless rotation of BTC, ETH and SOL, and 249 instruments out of 435 would never trigger, even though the map works best exactly on thin instruments.
That is why the × base column shows how many times the flow is above what is usual for that instrument at that time of day. It is the only quantity by which instruments are comparable to one another.
What the base is
The seasonal base is the expected number of liquidations per minute for a specific instrument in a specific hour. It is fitted on nine and a half months of flow and updated by reloading.
Liquidations have a distinct daily cycle, and it is the same for almost all instruments: the peak falls at 13:00–16:00 UTC (the US session open), the trough at 23:00. The swing is almost fourfold.
| Time | Multiplier to the average |
|---|---|
| Weekdays, 13:00 UTC | 1.95 |
| Weekdays, 23:00 UTC | 0.55 |
| Weekends, any hour | 0.89 |
On weekends there is no daily cycle at all, only an overall level about 15% below weekdays. We checked this separately: the hourly shape of weekends is not reproduced between quarters (the same hour gave 0.65, then 0.99, then 2.14), so these are separate cascades, not time of day.
The shape of the cycle is common to all; only the level is specific to an instrument. This was also measured, not chosen: on held-out months an instrument's own shape turned out worse than the common one by 0.45 nat per event, and a cautious blend of it is better only by 0.021.
How to read the columns
| Column | What it means |
|---|---|
| Volume | Liquidation volume over the window, in dollars. The sort is by it |
| × Base | How many times the events exceed the instrument's seasonal base |
| Liquidated | Whose positions are being wiped out: longs are forced sells, shorts are buys. This is the side of the flow, not the direction of price |
| Events | Number of visible liquidations over the window |
| Busy s | How many seconds of the window brought at least one event |
Watch Busy s in a storm. The exchange gives no more than one event per second per instrument, so when there are many busy seconds, the volume shown is a lower bound and the real flow is larger. The column is highlighted in orange when half the window or more is busy.
Why Spike and not Cascades
A cascade in the study is a thing with a precise definition: a minute with ten or more visible liquidations. The screener shows something else, a flow above the instrument's own norm, and it cuts off the strongest spikes, for a reason explained right below.
Why the strongest spikes are not in the list
The obvious solution is to sort by × base, top to bottom. It turned out to be wrong: the relationship is hump-shaped, not monotonic.
We took thirteen days of September 2026, split everything into five-minute windows and looked at what happened next:
| Excess over base | Cases | Next 15 min, × base | Next 15 min, $ |
|---|---|---|---|
| 5 – 15 | 8,591 | 0.9 | 4,472 |
| 15 – 50 | 8,041 | 3.6 | 5,324 |
| 50 and more | 4,530 | 1.4 | 484 |
In the "50 and more" bucket almost nothing happens next: $484 against $5,324 in the bucket below. These are not cascades but single large liquidations on thin coins, followed by silence.
So the screener selects the excess band from 5 to 50 and a volume threshold of $5,000, and inside the band it sorts by money. A comparison of rules on the same thirteen days:
| Rule | Next 15 min, × base | Next 15 min, $ |
|---|---|---|
| Excess band, sorted by money inside | 2.1 | 6,444 |
| By absolute volume | 0.6 | 2,575 |
| By excess without a volume threshold | 0.5 | 334 |
The chosen rule is better on both axes at once: the move after it is stronger relative to the instrument's norm, and there is more money in it in absolute terms.
What a cascade actually predicts
volume of the next 5 minutes 9.7 times above the base · 7 folds out of 7
This was measured on the same 9.5 months as the map. A minute with ten or more visible liquidations gives:
- a volume over the next 5 minutes 9.7 times above the seasonal base;
- over the next 15 minutes, 6.1 times;
- over the next hour, 3.6 times;
- the probability of at least one event in the next 5 minutes is 86%;
- 92% of the volume of the next fifteen minutes falls on the same side as the spike — unanimous, 7 folds out of 7 and 20 instruments out of 20.
So the screener reliably says: there will be movement here right now, and the same side will keep getting wiped out.
What a cascade does not predict — price direction
the move continues in 44% of cases · with 30+ liquidations in a minute, 17%
Entering "by the side of the cascade" loses to a coin flip. This was measured, not assumed.
After a spike, price more often pulls back than continues. And the stronger the spike, the more often: with thirty or more liquidations in a minute, the move continues in only 17% of cases.
The logic is simple: a cascade is the forced closing of positions, not an inflow of new money. When there is no one left to wipe out, the pressure disappears with them.
That is why the column is called Liquidated and not Side: it says whose positions are being wiped out, and this must not be confused with the direction of price.
How to use it
- The screener answers "where to look right now" and only that. It saves time; it does not give a signal.
- Clicking a row switches the linked chart to that instrument.
- Then the map takes over. Its main confirmed result is stop distance: a stop inside the colored zone is taken out noticeably more often than at the same distance beyond its edge (+0.128, unanimous, 121 cells out of 121). Place it beyond the outer edge of the hot zone.
- Look for direction elsewhere. Neither the screener nor the map gives it.
- A bright zone on the map is fuel. If price gets there, the move is more likely to accelerate than fade. It works as a place for partial profit-taking.
A cascade gives timing and the side of the flow. The map gives the stop distance and the place where volume has built up. None of these gives direction.
Limitations
The window is the last five closed minutes. An instrument disappears from the list when the flow returns to normal, not when the move is over.
After a service update the list is poorer for a while. The flow state lives in memory and is rebuilt over about twenty minutes. Rows whose window was not fully observed do not enter the list at all: better to show less than to pass off the unmeasured as silence.
The screener sees only visible liquidations. The exchange gives no more than one event per second per instrument, so in a storm all volumes are understated. Watch Busy s.
The $5,000 threshold is fixed and cuts off thin coins with single liquidations. This is deliberate: without the threshold, the volume of the next fifteen minutes falls fifteenfold.
The intensity is computed once a minute from the stream of forced liquidations on Binance USDT-M. The seasonal base is fitted on nine and a half months of history and updated by reloading. The selection rule was measured on thirteen days of September 2026, 29,882 observations.