Manipulations
The model detects manipulative activity on the micro timeframe.
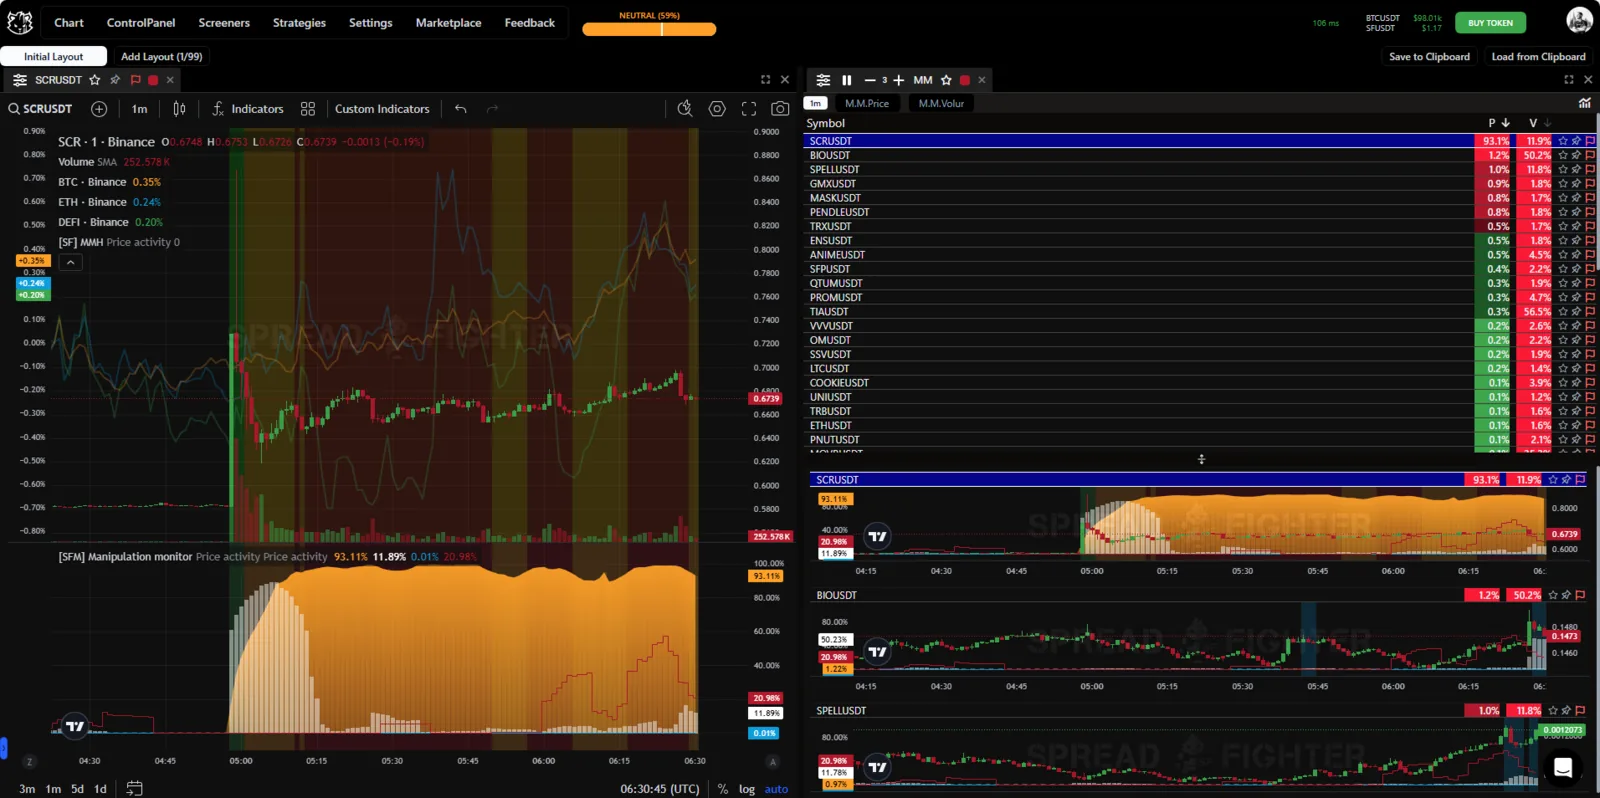
Widget and model appearance.
Model description
In the modern crypto market, subtle manipulations are not always easy to see and often go unnoticed by the human eye. Large participants who directly influence asset prices often hide their actions.
Manipulation Monitor is a high-tech, advanced model that uses a wide range of data to detect manipulative activity on the micro timeframe. The model has two values. Formally, we call them PRICE ACTIVITY and VOLUME ACTIVITY. Both values range from 0% to 100%.
The model analyzes the state of an asset relative to the broad market and records anomalous bursts of activity. Price activity corresponds to anomalies in the asset's volatility. Volume activity corresponds to anomalies in the trade tape.
This powerful tool is designed to detect most market manipulations in any coin. It does not predict price behavior, but it effectively assesses the manipulative activity of algorithms.
Manipulation Monitor:
- highlights all actions that can potentially lead to significant price changes, while filtering out order book imbalances caused by market makers as well as the activity of various kinds of arbitrageurs;
- frees traders from manually monitoring order books and from decorrelations between an individual asset and the general market conditions;
- gives a clear and simple answer on how pronounced the activity of high-frequency manipulative algorithms is, reducing the answer (like any good quantitative model) to a number.
Model tests
Strategy logic
A short position is opened when the following conditions are met:
-
The asset price crosses the lower boundary of the linear regression channel (from top to bottom), built on a 10-minute interval, at the first standard deviation.
-
Additional entry filter: signs of manipulative activity are present. Manipulation in volumes exceeds the threshold value of 75.
-
Manipulative activity in price is non-zero (above 0).
Position management:
- Holding time: 720 minutes (12 hours).
- Take profit (TP): 7% of the entry price.
- Stop loss (SL): 5% of the entry price.
Early closing of the position is considered when two conditions are met at the same time:
- The level of manipulative activity in price falls below 5.
- A decline of manipulative activity in volume is recorded: its value falls from extreme levels (above 95) below this threshold.
Quantitative metrics of the strategy
- Start Index: 2023-01-01 00:00:00+00:00
- End Index: 2024-12-30 23:59:00+00:00
- Total Duration: 730 days 00:00:00
- Start Value: 1000.0
- Min Value: 844.30816
- Max Value: 2072.69332
- End Value: 1662.335589
- Total Return [%]: 66.233559
- Benchmark Return [%]: 125.738511
- Position Coverage [%]: 32.10664
- Max Gross Exposure [%]: 619.34869
- Max Drawdown [%]: 30.601342
- Max Drawdown Duration: 171 days 03:58:00
- Total Orders: 3186
- Total Fees Paid: 429.231523
- Total Trades: 1593
- Win Rate [%]: 49.843063
- Best Trade [%]: 6.9035
- Worst Trade [%]: -5.1025
- Avg Winning Trade [%]: 5.022391
- Avg Losing Trade [%]: -4.600367
- Avg Winning Trade Duration: 0 days 07:10:54.861460957
- Avg Losing Trade Duration: 0 days 03:36:52.265331664
- Profit Factor: 1.06642
- Expectancy: 0.415779
- Sharpe Ratio: 0.961174
- Calmar Ratio: 0.945435
- Omega Ratio: 1.00788
- Sortino Ratio: 1.385862
Infographics
Returns
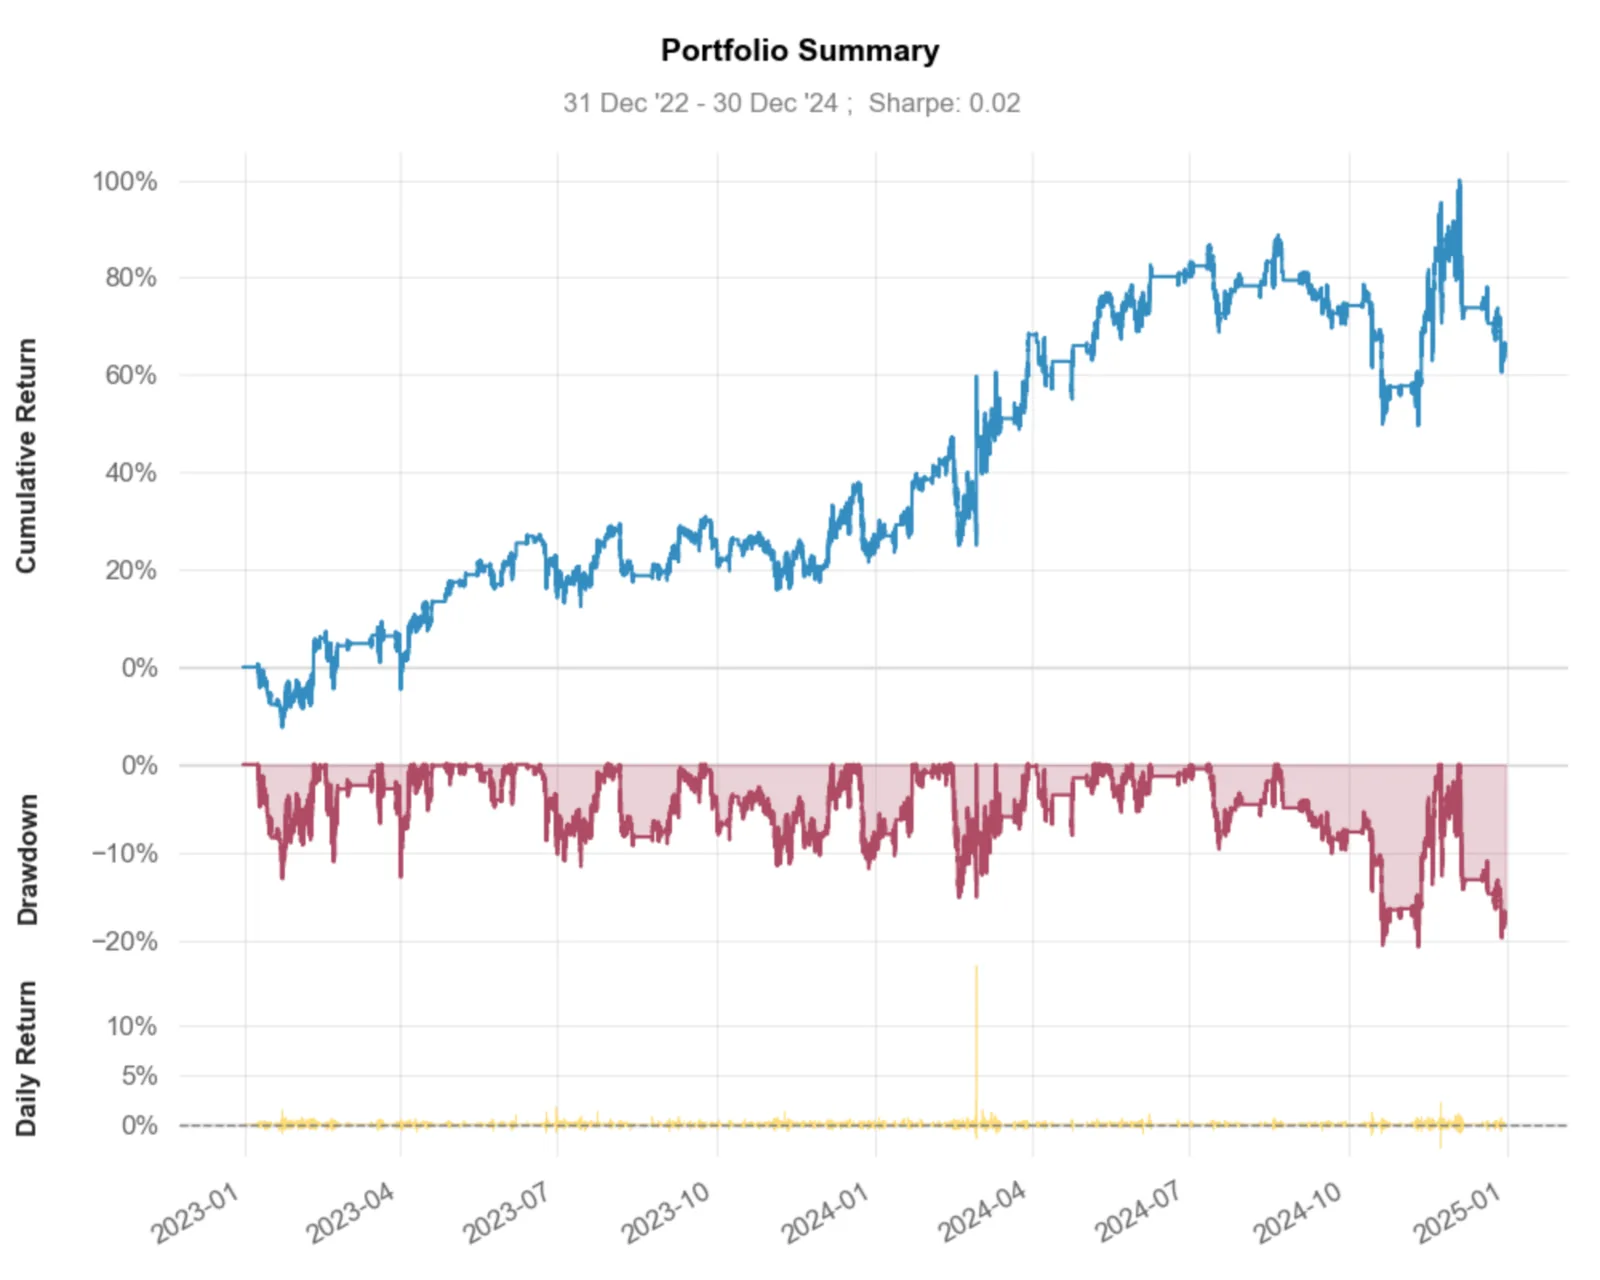
Return on investment.
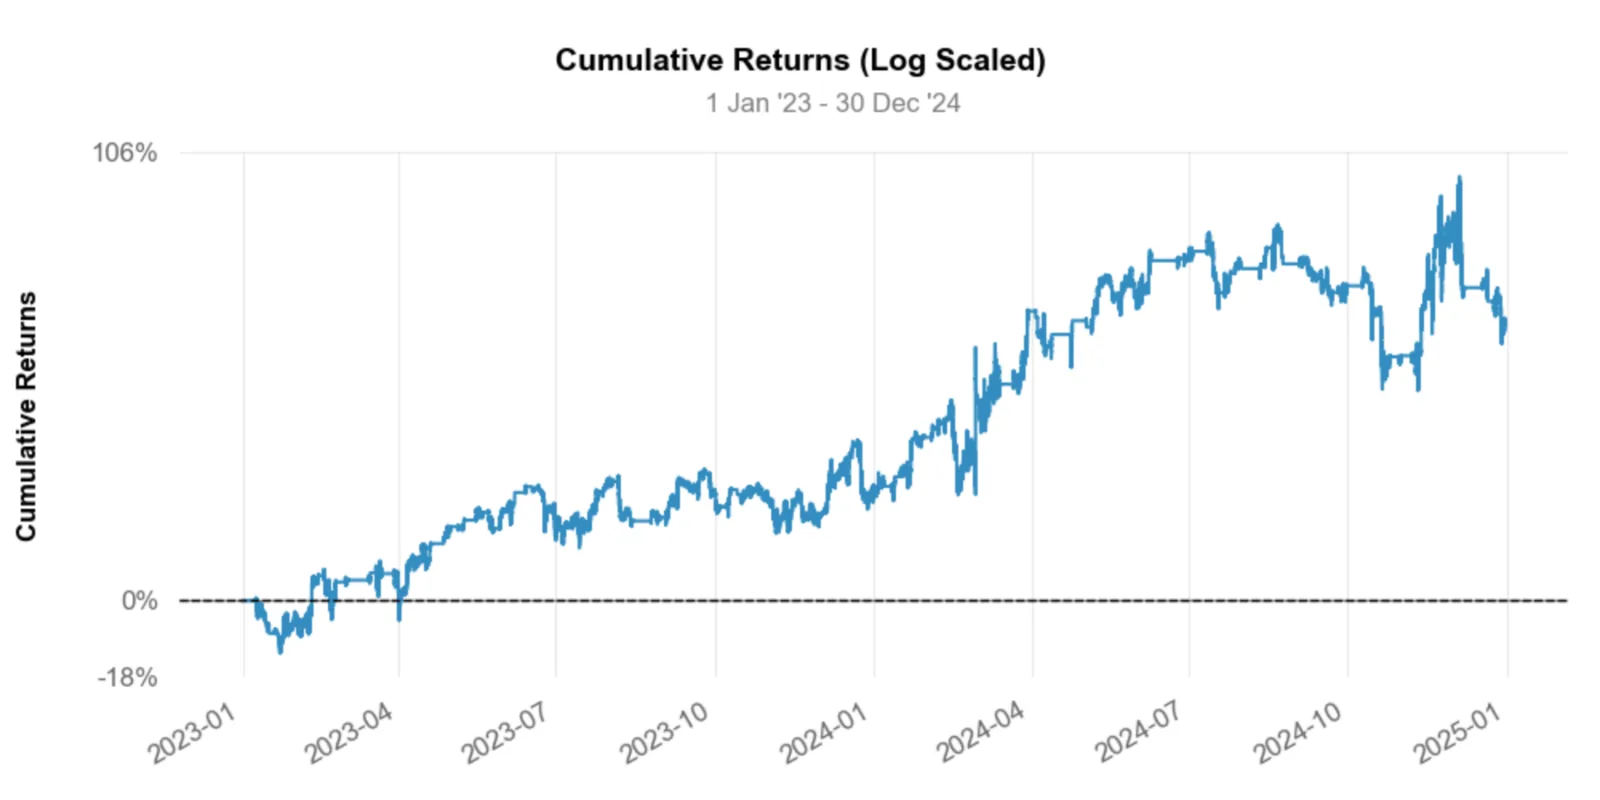
Logarithmic chart of return on investment.
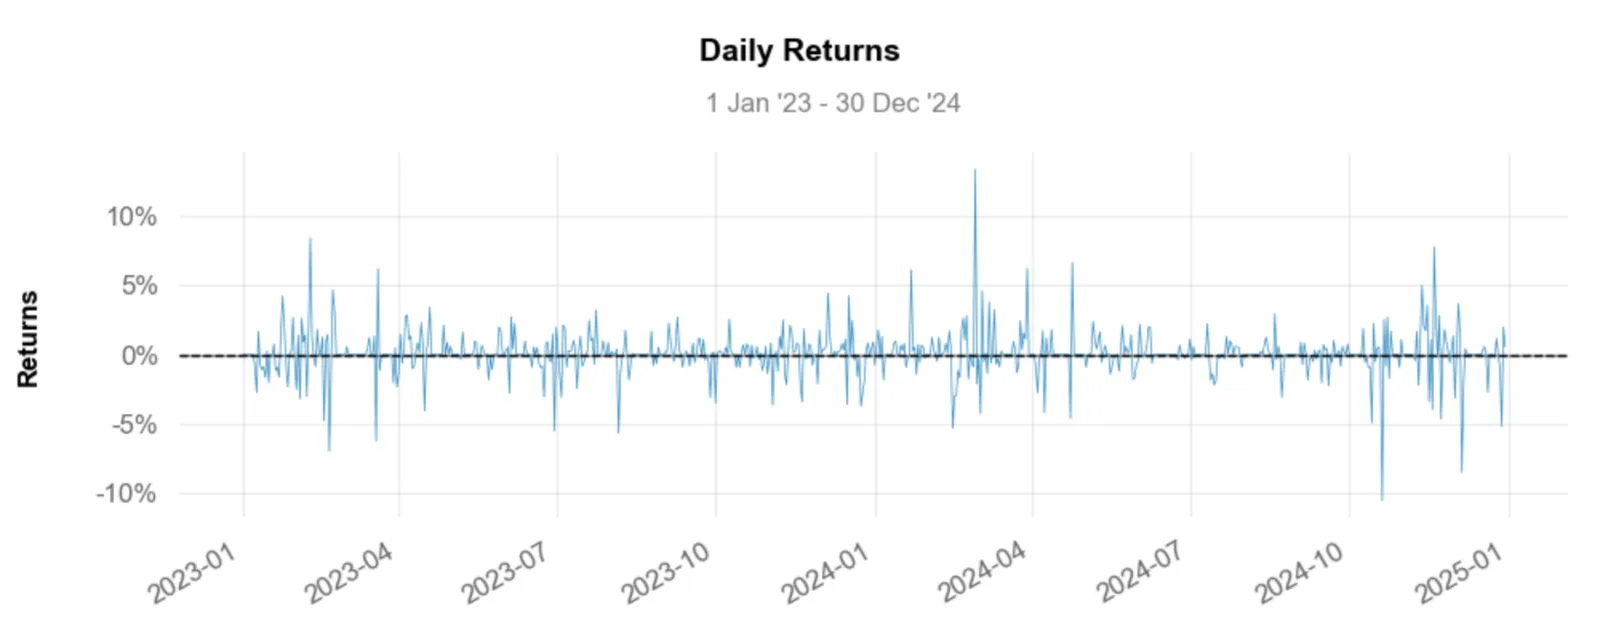
Daily return on investment.
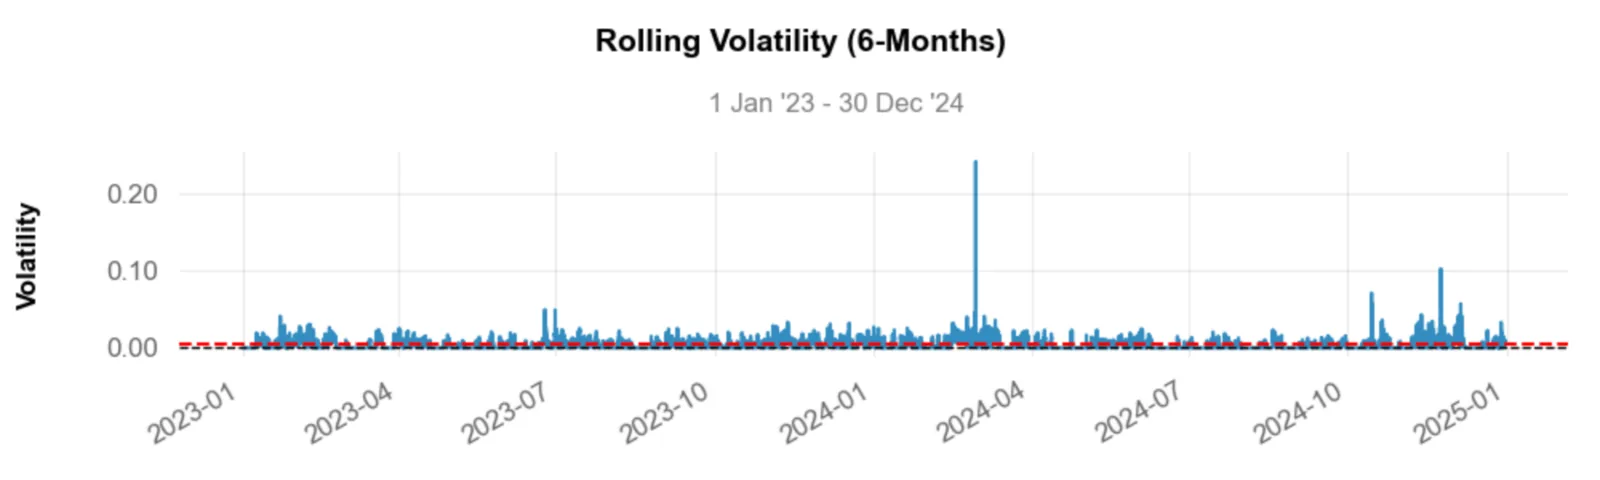
Rolling volatility of return on investment over 6 months.
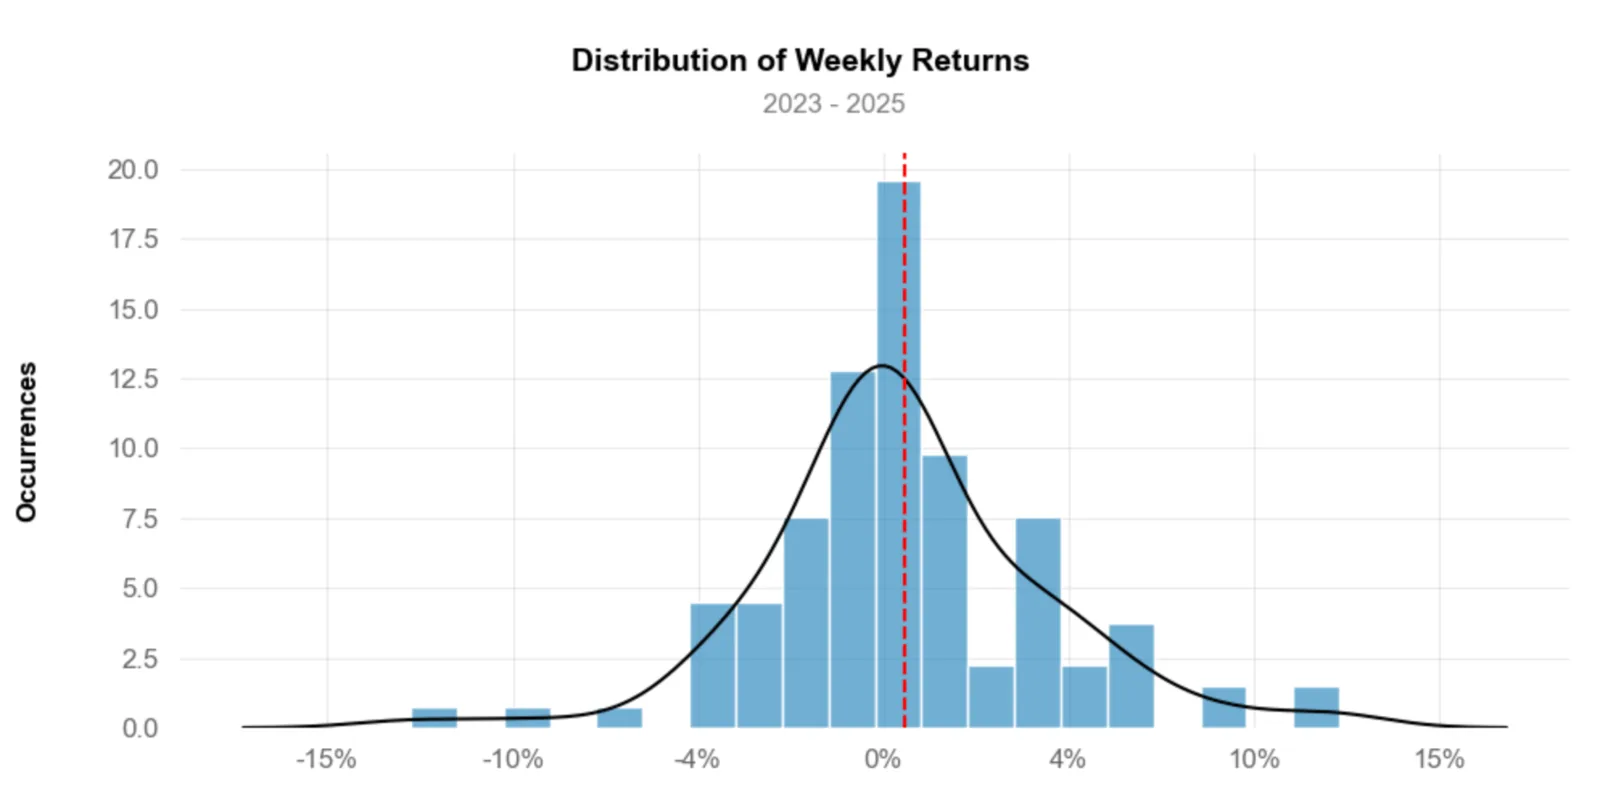
Distribution of weekly returns.
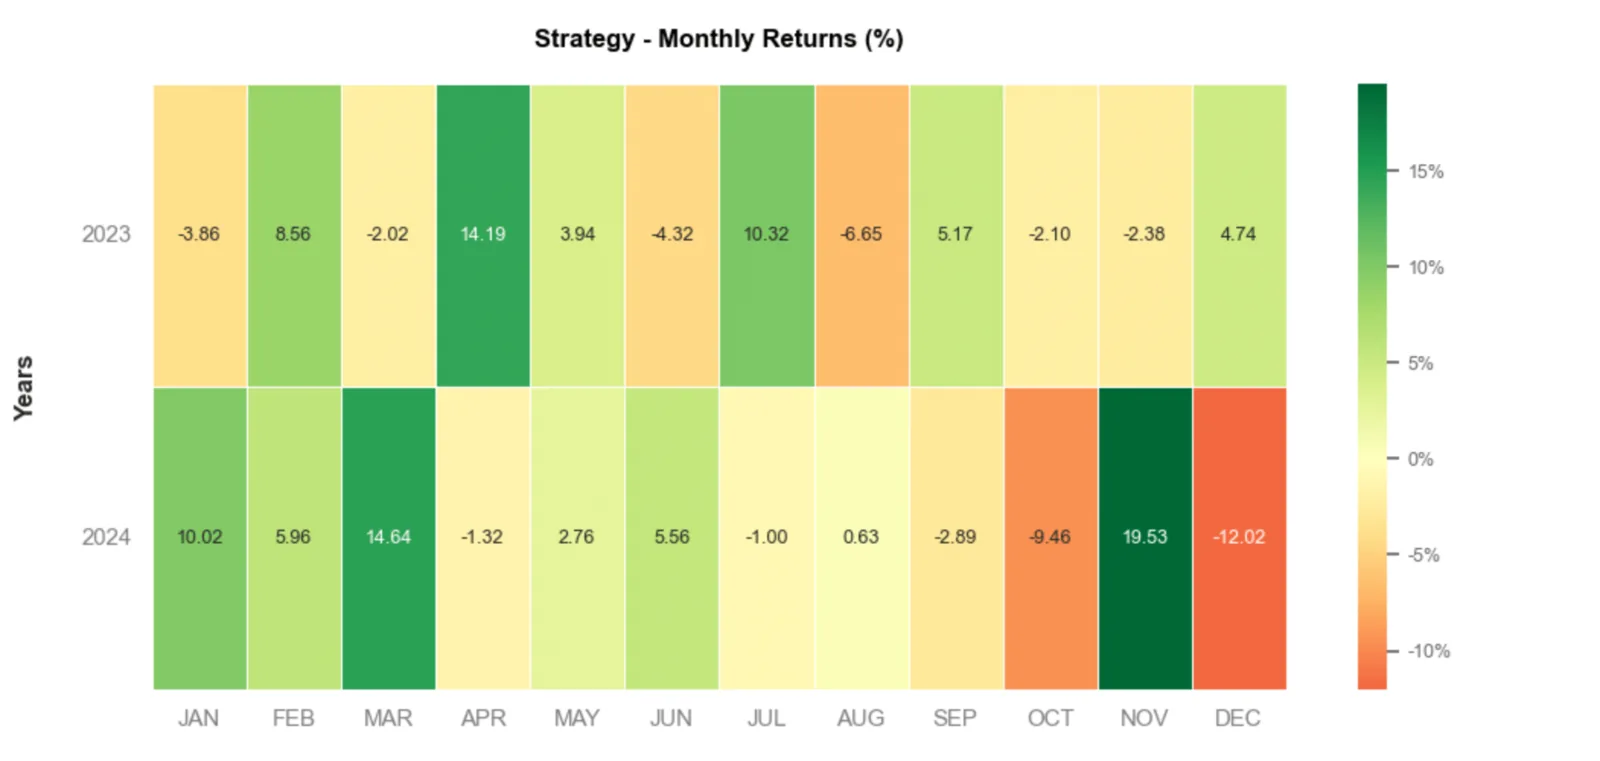
Return on investment by month.
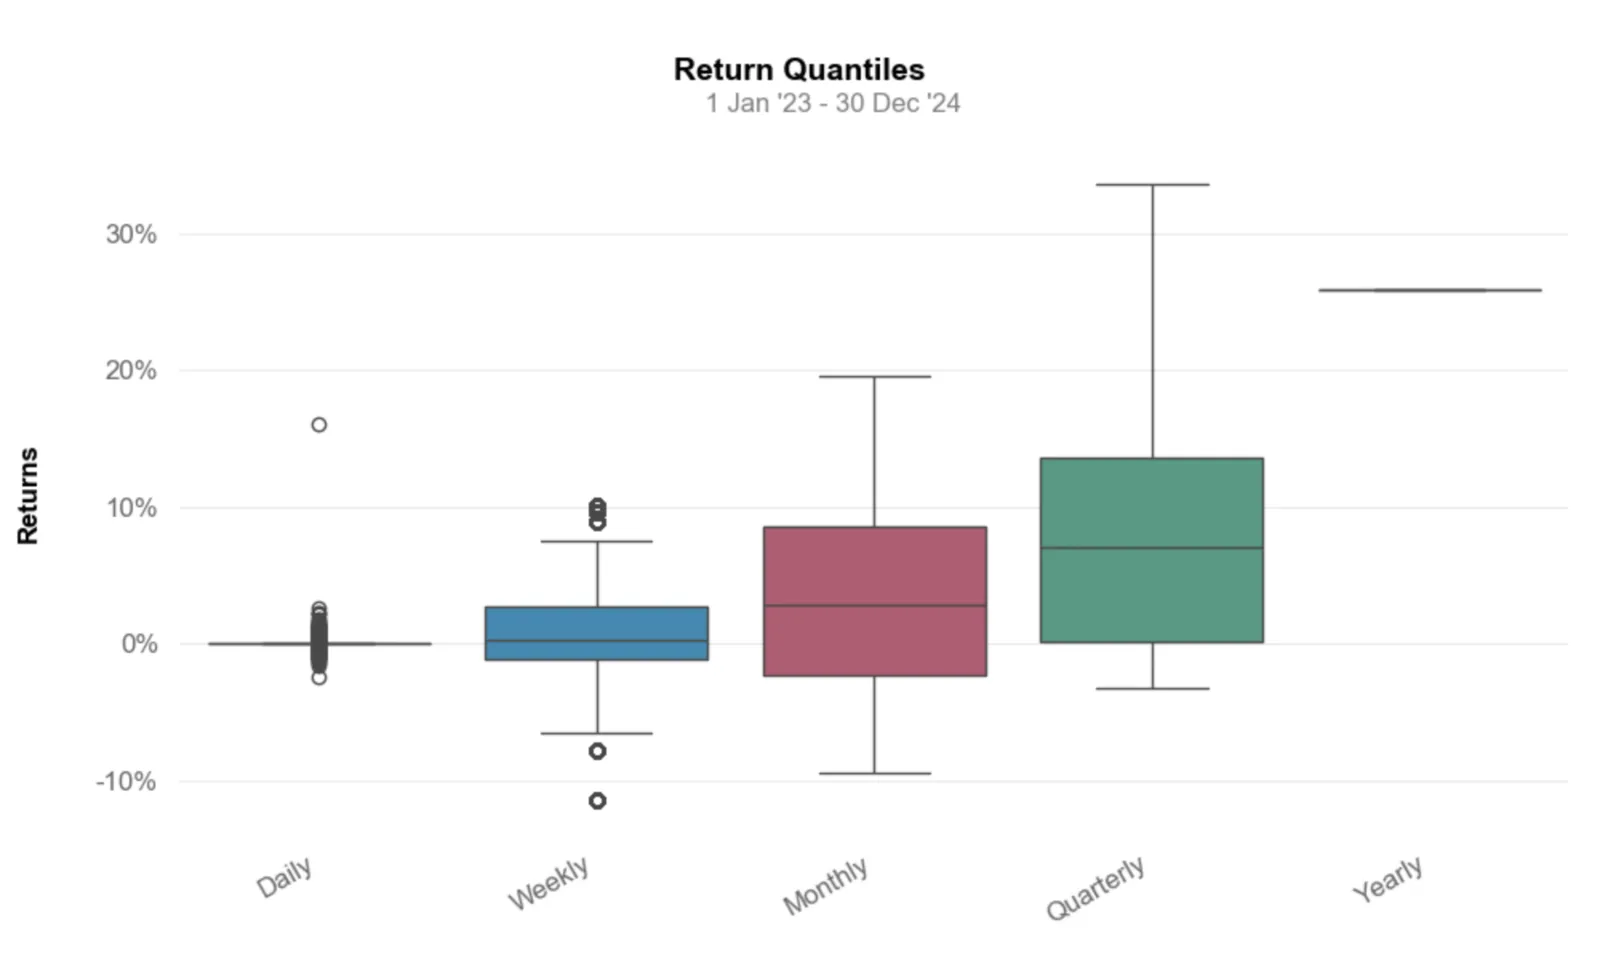
Quantiles of return on investment.
Risks & Drawdowns
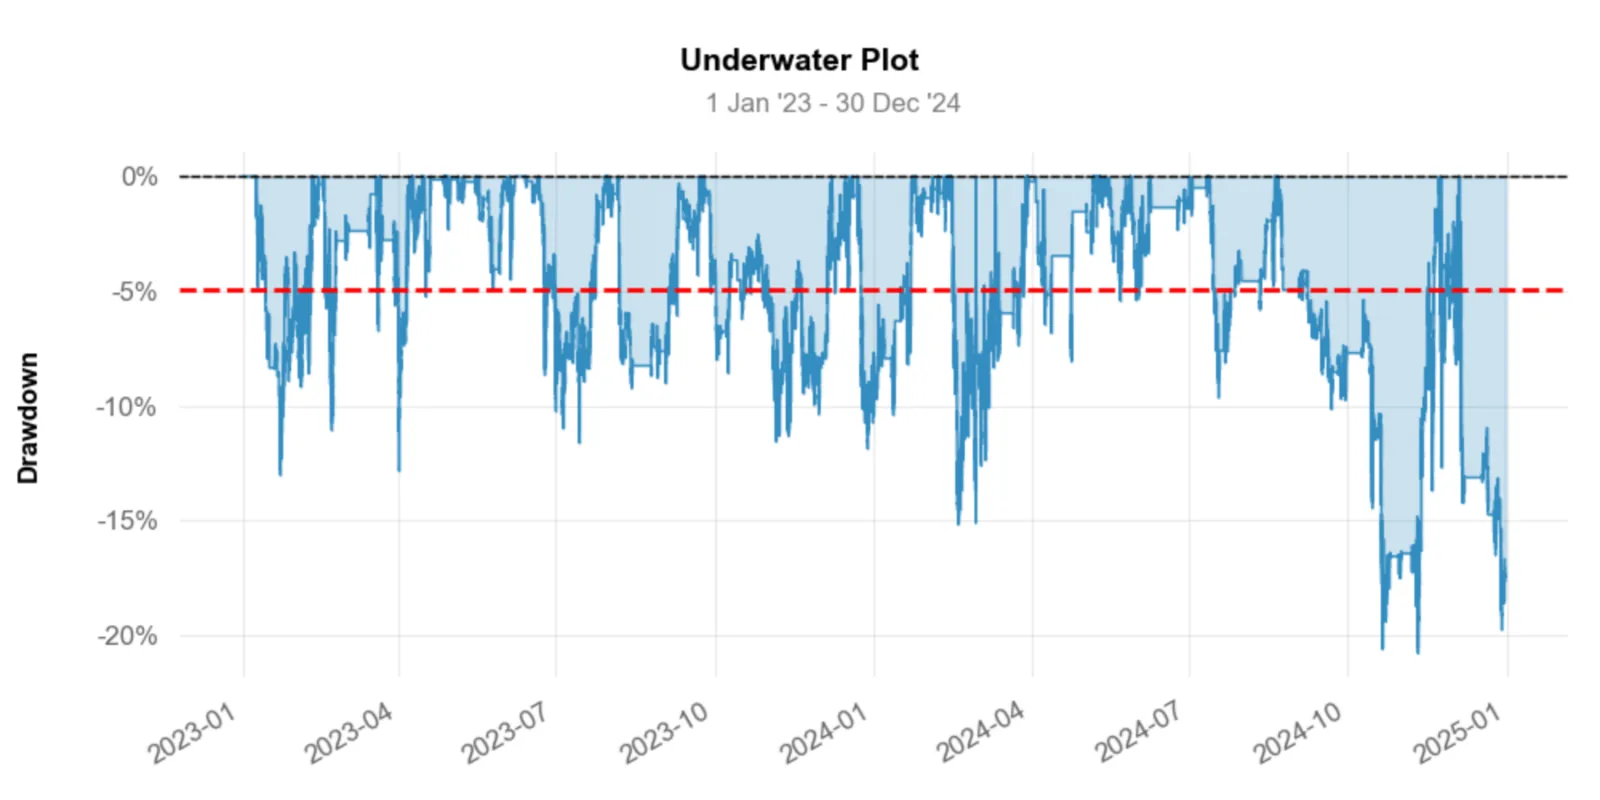
Drawdowns.
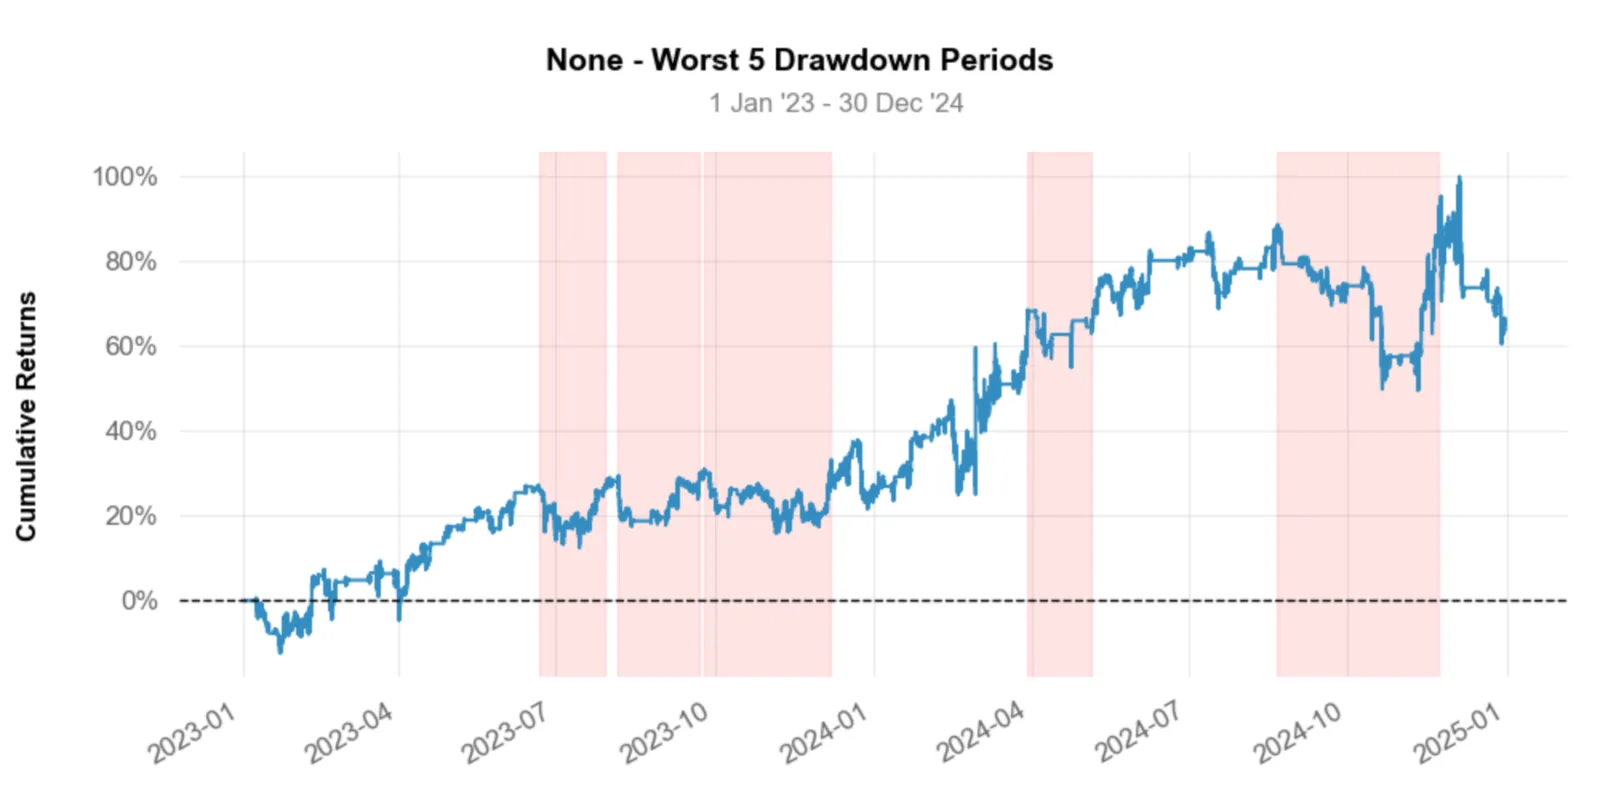
Periods of maximum drawdown.
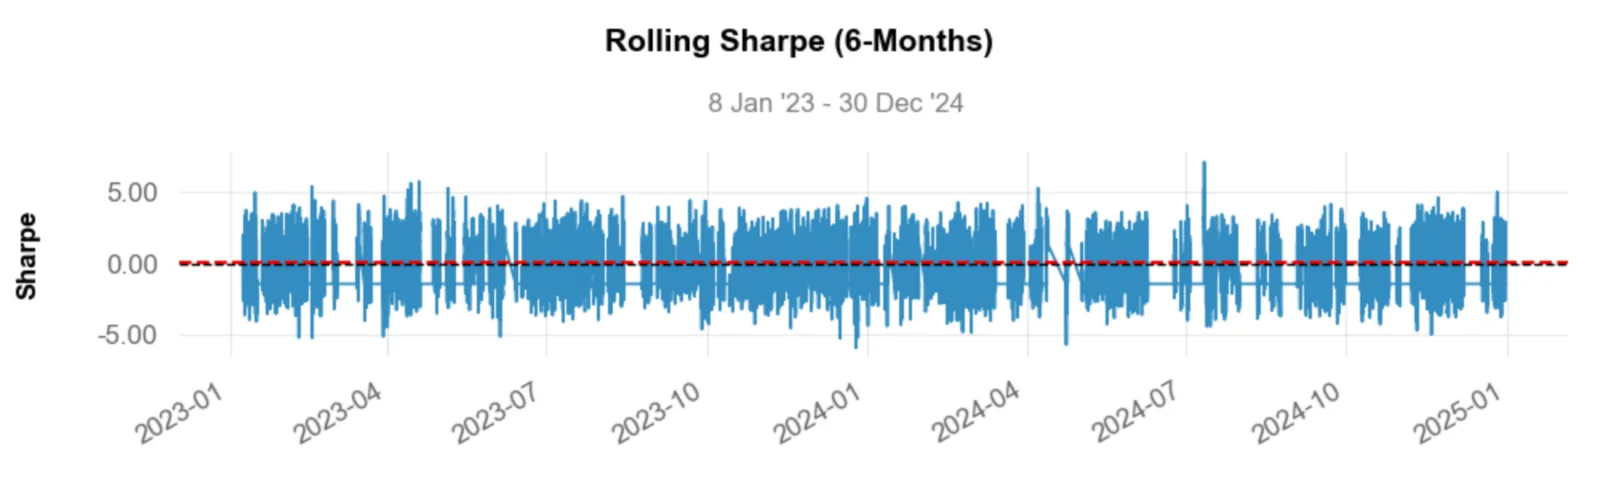
Rolling Sharpe ratio over 6 months.
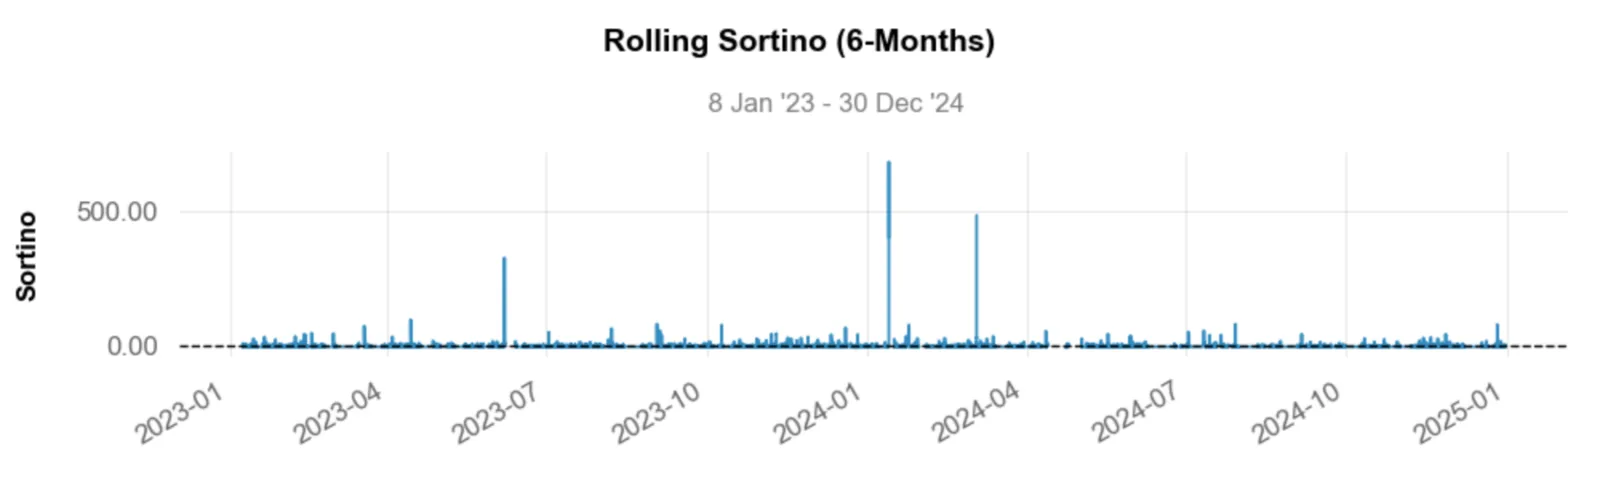
Rolling Sortino ratio over 6 months.
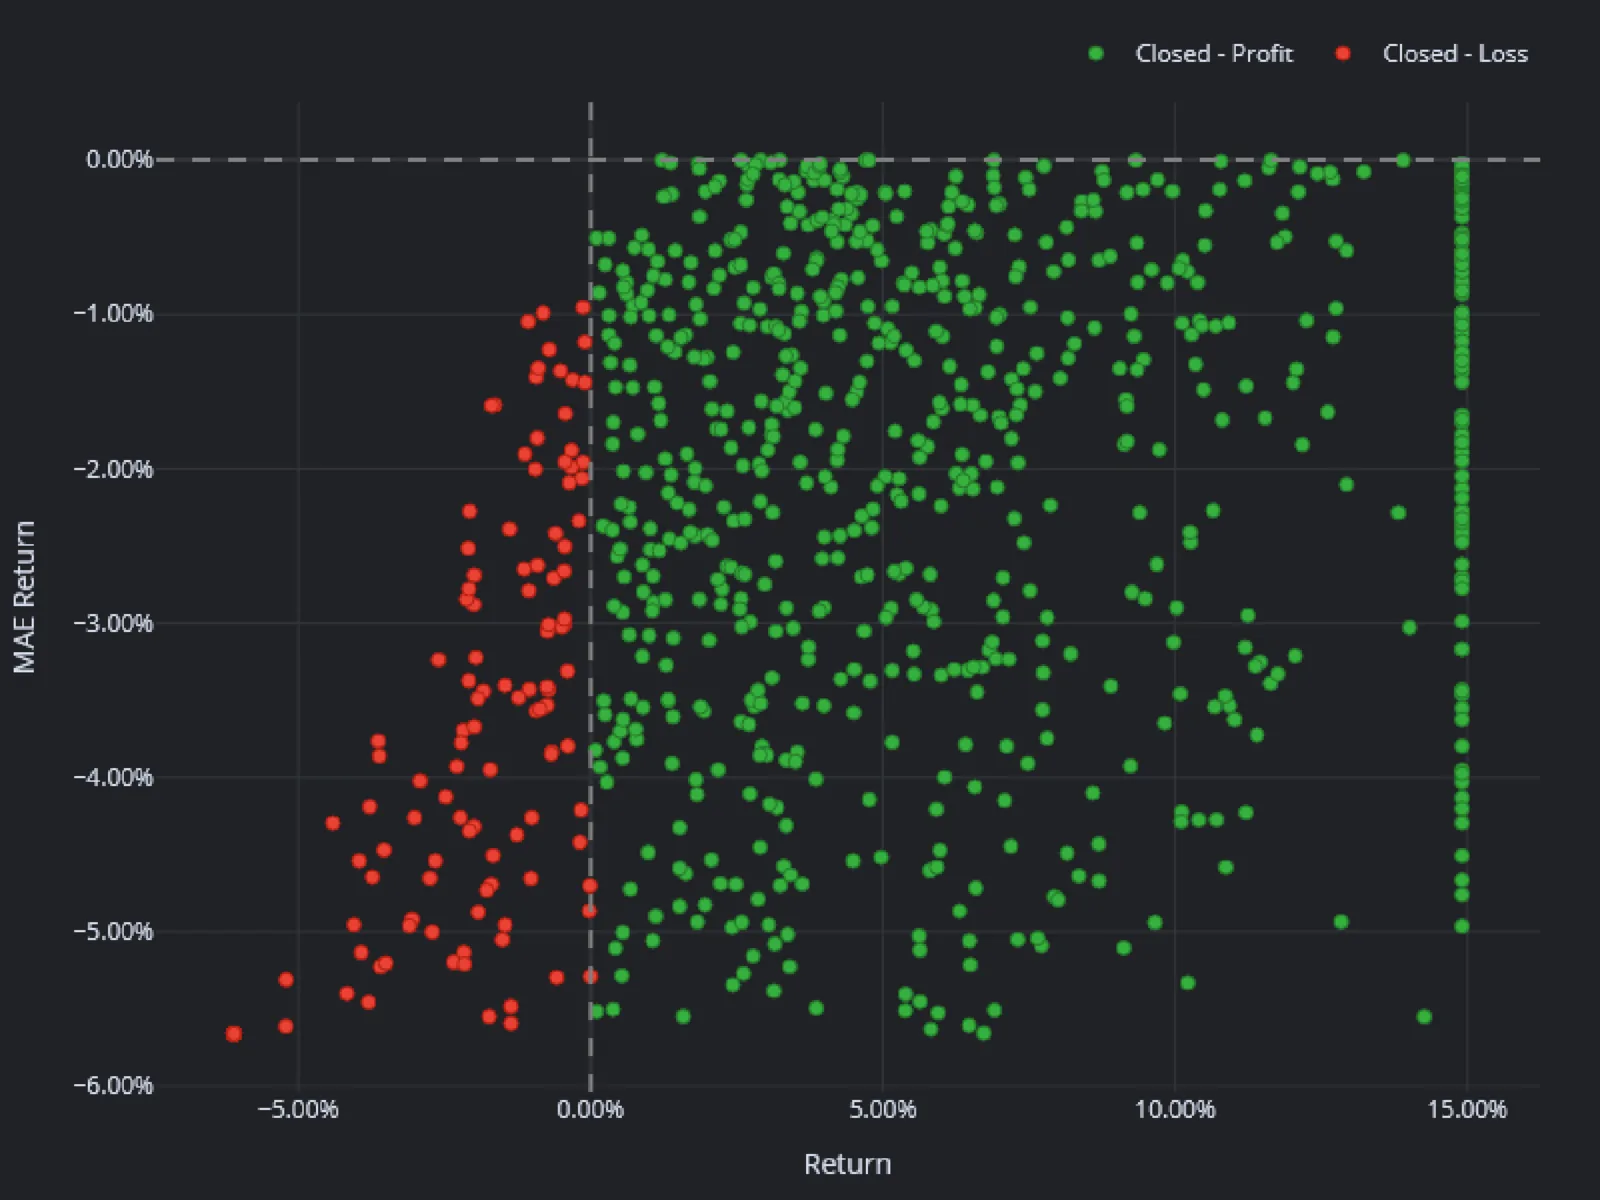
Distribution of Maximum Adverse Excursion (MAE).
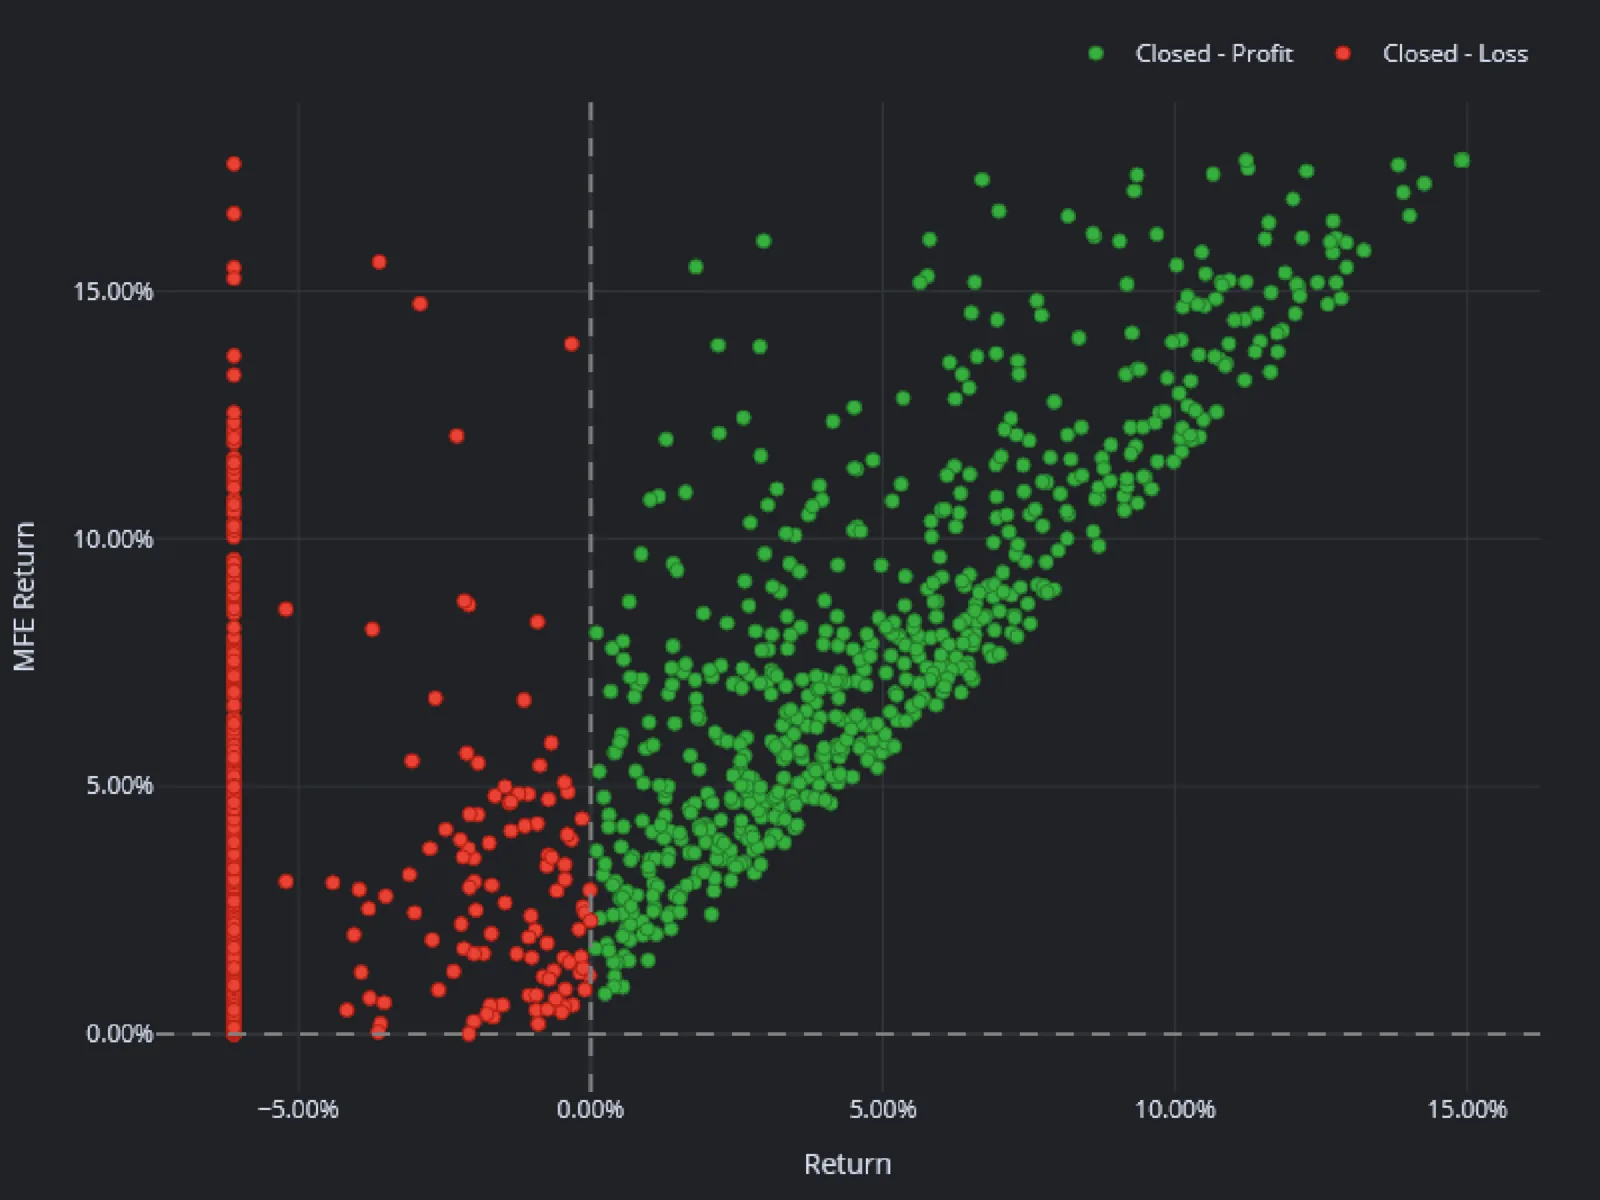
Distribution of Maximum Favorable Excursion (MFE).
Model location
To add the "Manipulations" tool to the workspace, first click the "Screeners" button in the platform header. Then click the button of the same name in the "Microstructure" section.
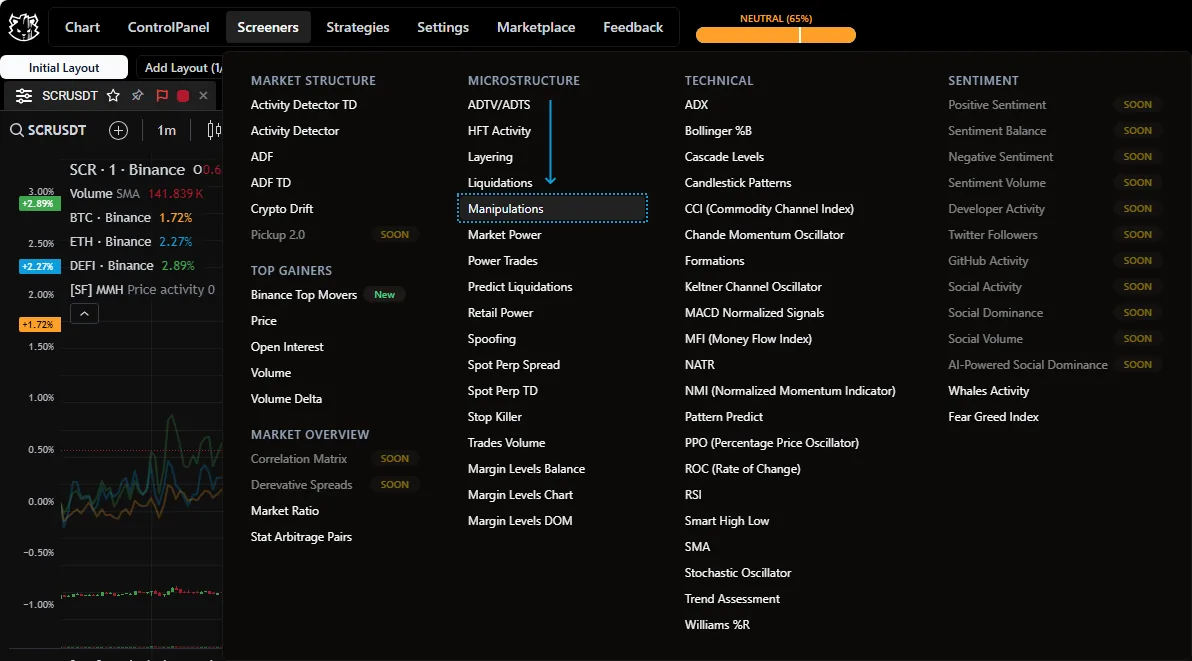
Widget location.
Tool features
Indicator
The Manipulations tool is very easy to read: the assessment of manipulative activity is reduced to a number and shown in a familiar graphical form. This lets experienced traders run a correlation analysis to build their own strategies.
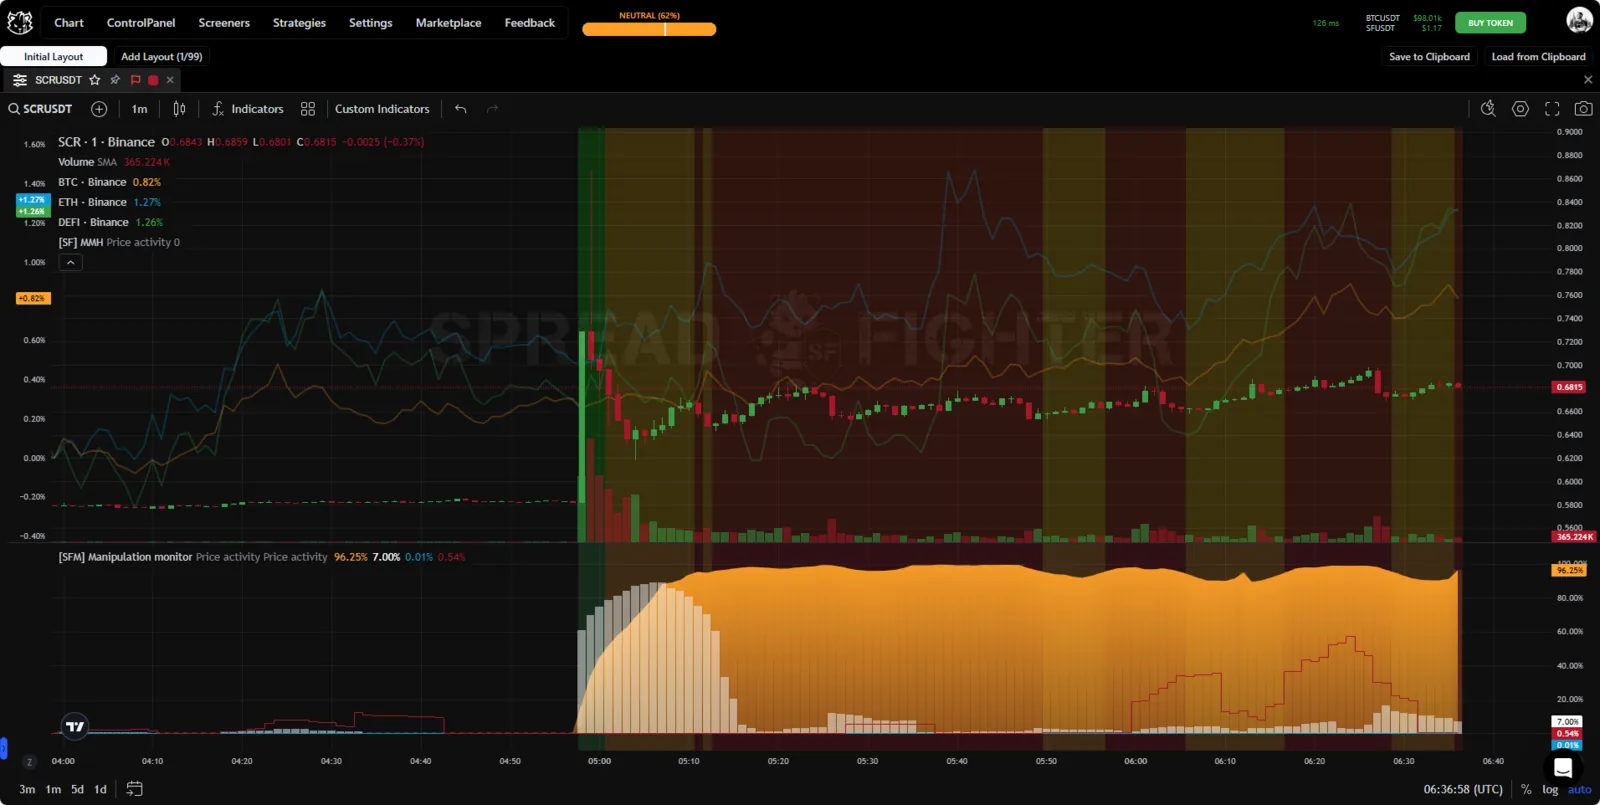
Model appearance.
The data is shown on two percentage scales:
- orange gradient - price manipulation;
- gray line - volume manipulation.
The chart scales are expressed in percent from 0% to 100%, where 0% means no manipulation and 100% means extreme manipulative activity. The percentage scale itself also has its own gradation depending on the value of manipulative activity:
- The zone from 1% to 4.99% is conventionally called the INITIATION phase, but it may turn out to be noise. It is marked in turquoise.
- The zone from 5% to 49.99% is considered the DEVELOPMENT phase and is marked in green.
- The zone from 50% to 94.99% is a kind of ACTION phase and is marked in orange.
- The zone from 95% to 100% is considered the CLIMAX phase and is marked in red.
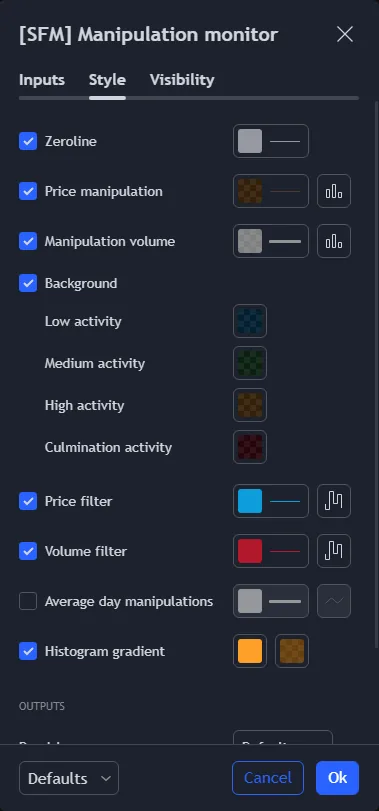
Filter data is an additional indicator that shows the market-average value of the model metrics for all assets. If Filter data is higher than Price activity and Volume activity, the Price activity and Volume activity readings can be considered noise.
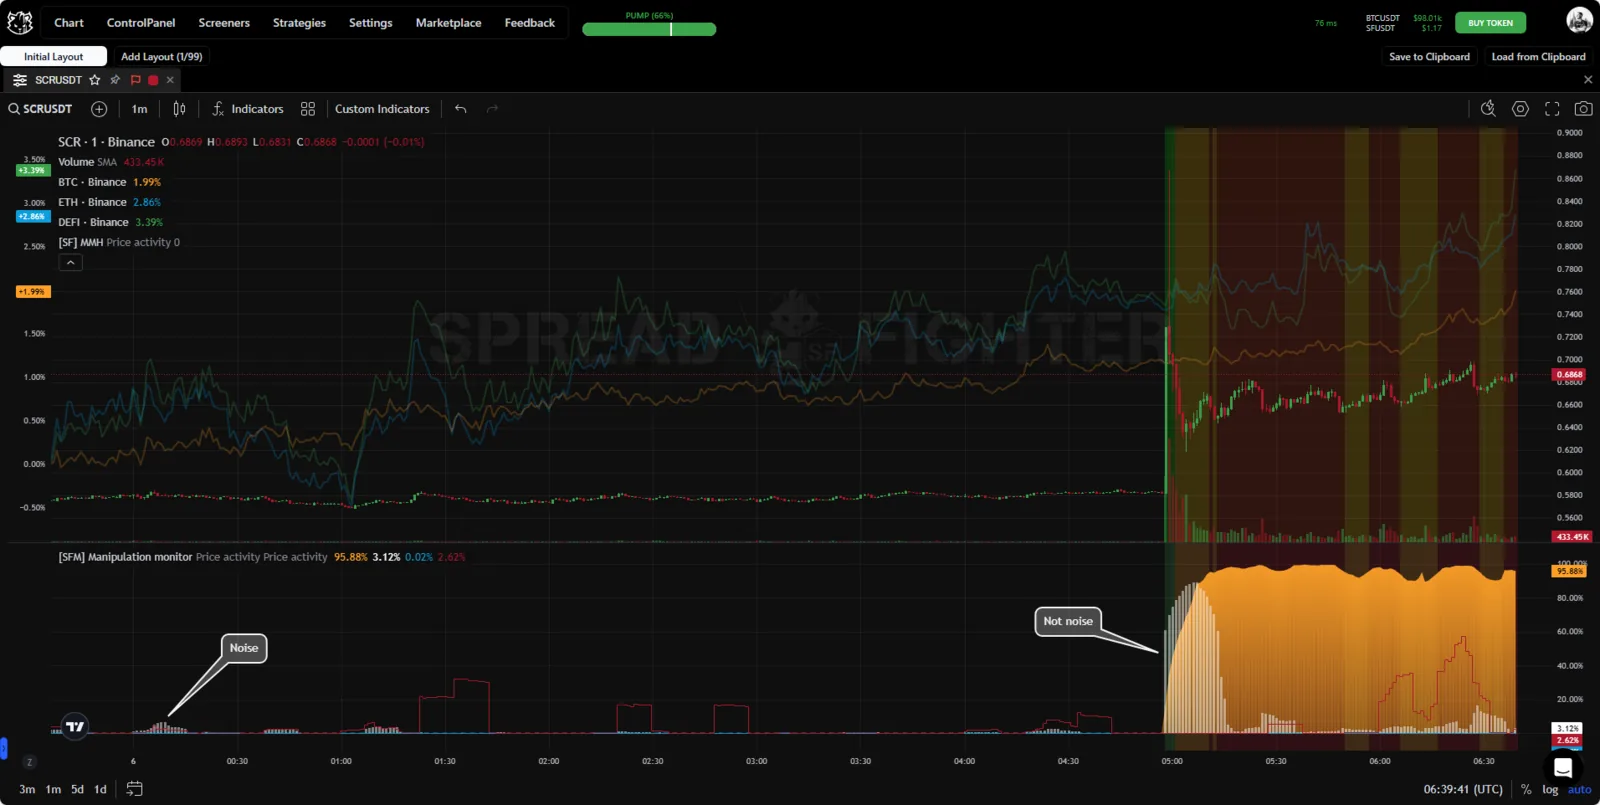
Filtering market noise.
Widget
The widget table shows 2 values:
- P - the value of the model's price activity,
- V - the value of the model's volume activity.
Incoming signals can be filtered by the displayed values.
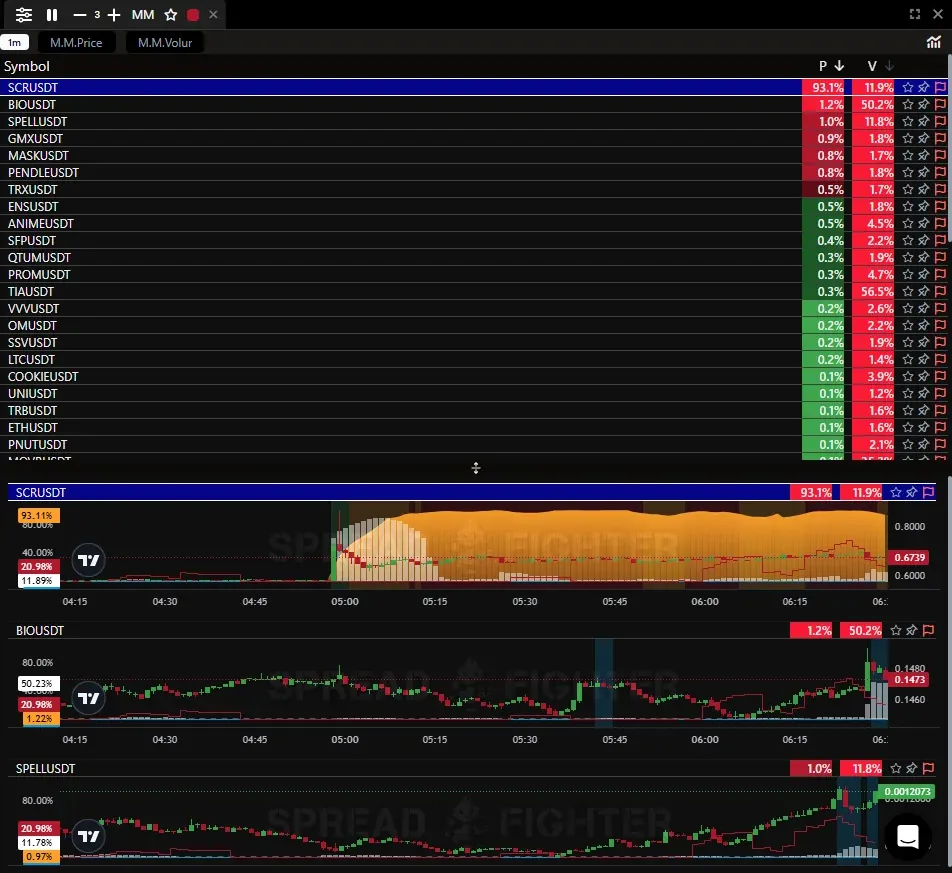
Manipulation Monitor widget.
Use cases
Manipulation Monitor can make a trader's life much easier. Statistically, when manipulative activity grows, assets are repriced relative to their fair prices. Such inefficiencies are therefore a direct loss for mean reversion and an opportunity to make a profit for momentum strategies. Manipulation Monitor gives a trading edge for every type of strategy.
- It tells the user clearly and accurately that a participant is present in the asset, which improves the accuracy of intraday trading decisions.
- To some extent, it removes the need to track in parallel the dynamics of the spot and futures order books of the traded instrument and of the index. This improves working comfort and the psycho-emotional and mental health of the trader.
- It protects medium- and long-term investors from opening positions at unfavorable prices during pump seasons.
- It lets analysts tell organic asset growth from manipulation.
Momentum
Let's look at the pump & dump of HOT on 13 Oct 2023. On 13 Oct 2023 at 17:52, 18:10 and 19:45 UTC, manipulative activity grows in the asset, signaling that a participant has appeared in the token. At the same time the tape accelerates, the Power trades model records large volume injections, and open interest takes on a steady upward trend.
The combination of these factors signals a high probability of a pump move in the asset, which does happen some time later.
In this situation, you can make a profit by opening a long position, expecting quotes to rise.
The point to open a position can be the appearance of the first volume manipulations.
The setup invalidation point is the first large volume injection in Power trades. The moments to close the position:
- readings of the Stop killer model about the triggering of stop-loss orders of short positions,
- a drop in the participant's manipulative activity,
- a slowdown of the tape,
- a break of the lower boundary of the open interest trend channel.
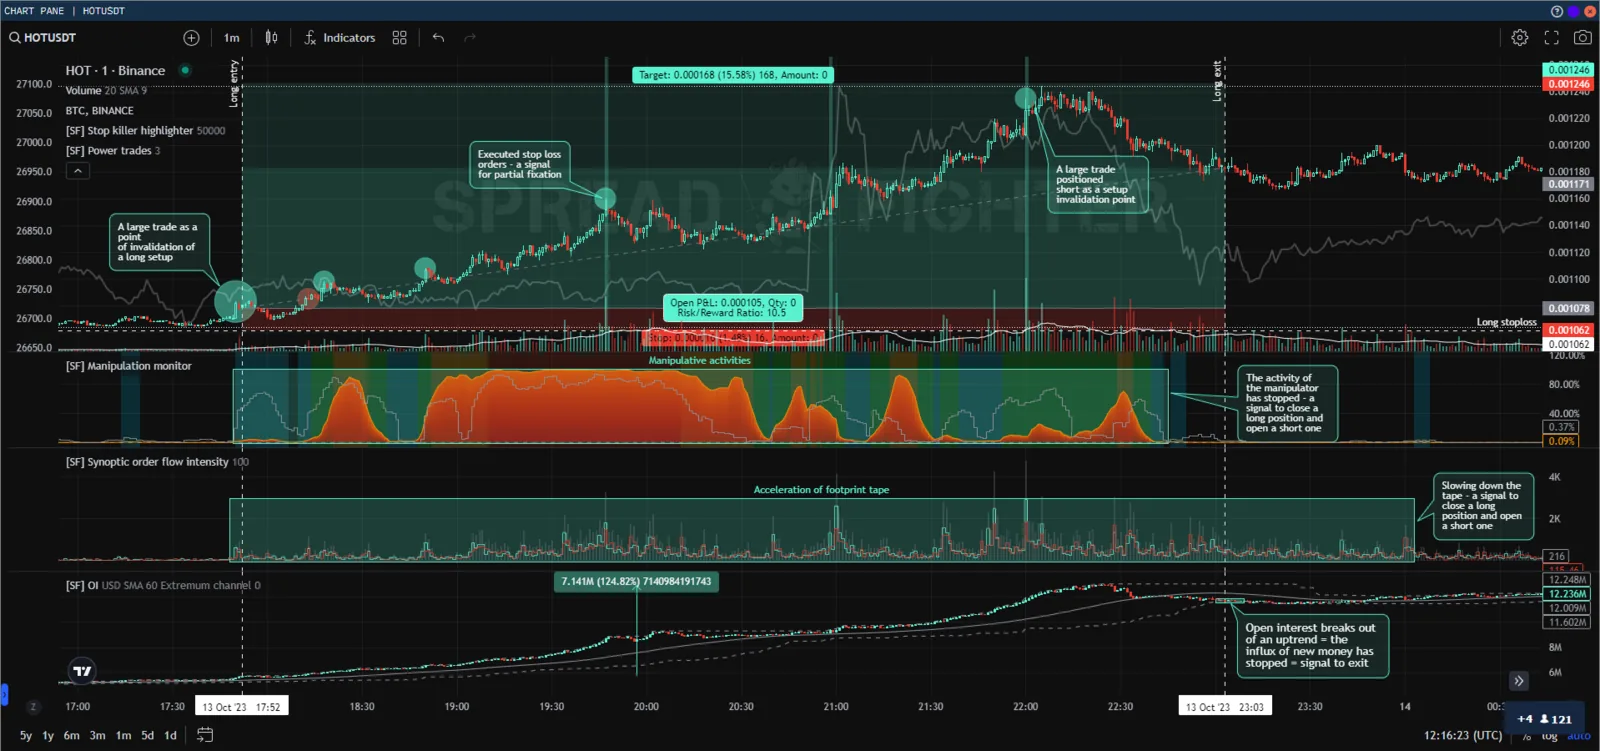
Trend trading.
In this case, the Manipulation Monitor model lets you:
- detect the participant's activity much faster than other participants, open a position earlier than other traders and realize the potential of the move to the fullest. The Manipulation Monitor model provides this;
- improve the accuracy of entries, thereby raising the winrate compared with classic momentum tools.
Mean reversion
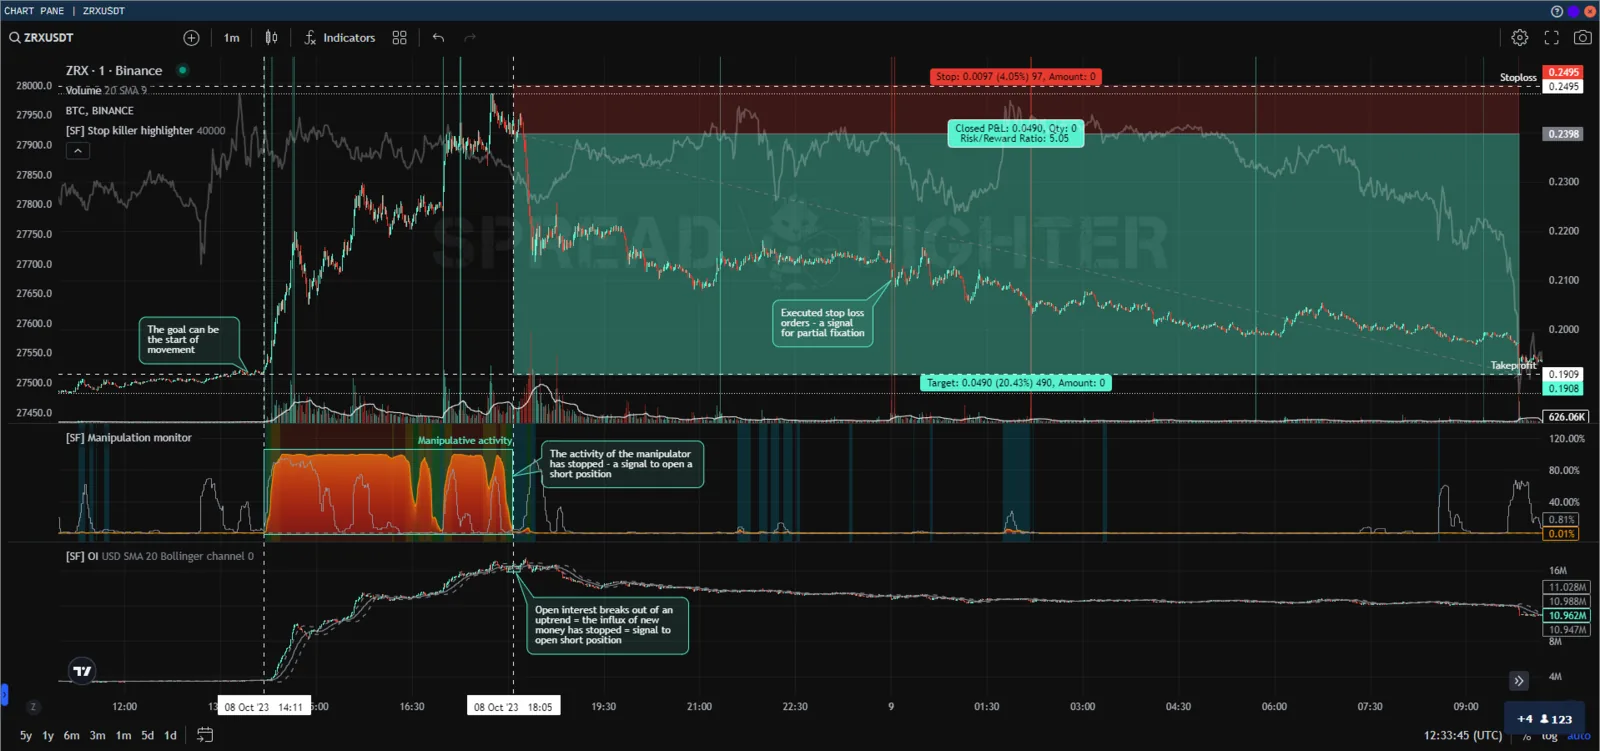
Let's look at ZRX on 8 Oct 2023. On 8 Oct 2023 at 14:11 UTC, manipulative activity grows in the asset, signaling that a participant has appeared in the token. At the same time open interest takes on a steady upward trend, and the ZRX price starts to rise rapidly.
In this situation, you can make a profit by opening a short position, expecting quotes to fall back to the market-average values.
The point to open a position can be a drop in manipulative activity in the asset, as well as the open interest chart crossing the lower boundary of the ascending channel.
The local maximum of the ZRX price can be taken as the invalidation point.
The common practice is a risk / reward ratio < 1-2-3. That is, the potential profit is one, two, three or more times larger than the potential loss. However, professional quantitative finance has no such paradigm, and the potential risk can be several times larger than the potential profit. We recommend reading articles on this topic on Wikipedia and Investopedia.
As the profit-taking point, you can consider the appearance of signals from the Stop killer model, as well as the ZRX price returning to its average fair values from before the pump & dump.
Counter-trend trading.
For mean reversion strategies, the Manipulation Monitor model lets you determine more precisely the moment to open a position toward regression to the mean, and exit the position in time if the participant has not left the asset. The model thus lets the trader cut potential losses, which improves the mathematical expectation of the strategy's final financial result.
To exclude the general market rise and to keep a short position against the broad market, a trader can apply delta hedging through BTC derivatives.
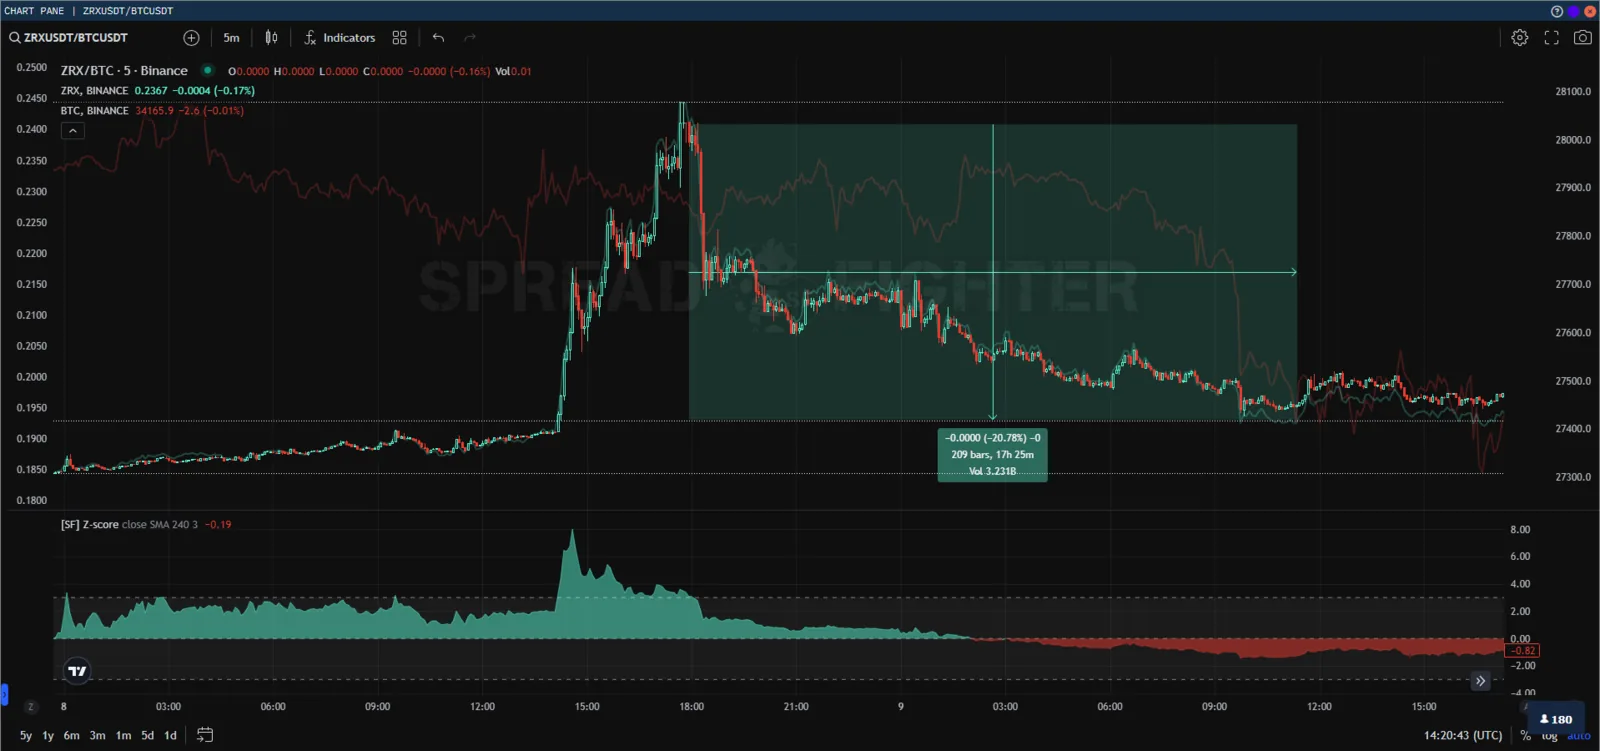
Synthetic position ZRXUSDT/BTCUSDT.
Risk management in synthetic positions
A synthetic position is an instrument that is not offered by an exchange or broker but that a trader can assemble on their own by combining ordinary directional positions in other instruments. A classic example is a Long/Short Straddle in the options market, where a trader buys/sells call and put options at the same time, thereby betting on a rise/fall in volatility. Another example of a synthetic is basket trading. In this case the trader buys or sells a number of instruments, betting in one or several directions across different instruments. An example of a basket: short BTCUSDT.PERP + long BTCUSD.CALL + long DEFIUSDT.PERP.
Let's look at an example in which a trader trades a classic mean reversion strategy on the synthetic instrument LQDTYUSDT/ICXUSDT. The double exponential moving average WMA is taken as the conventional average fair price. The position is entered when the asset price returns into the zone of three standard deviations toward regression to the mean. Risk/reward is set at 1 to 1. Signals are also filtered with the Manipulation Monitor model: the position is not opened if the asset shows manipulative activity in price and volume.
The strategy takes profit on 5 Oct 2023, 6 Oct 2023 and 8 Oct 2023 by the logic described above. On 9 Oct 2023, the price of the synthetic instrument LQDTYUSDT/ICXUSDT goes beyond three standard deviations relative to the WMA and immediately returns. This is a signal to open a short position toward the WMA. The previous times, there was no manipulative activity in the asset, but this time there is. So the position is not opened, which avoids a loss. The final move against the position was more than 20%.
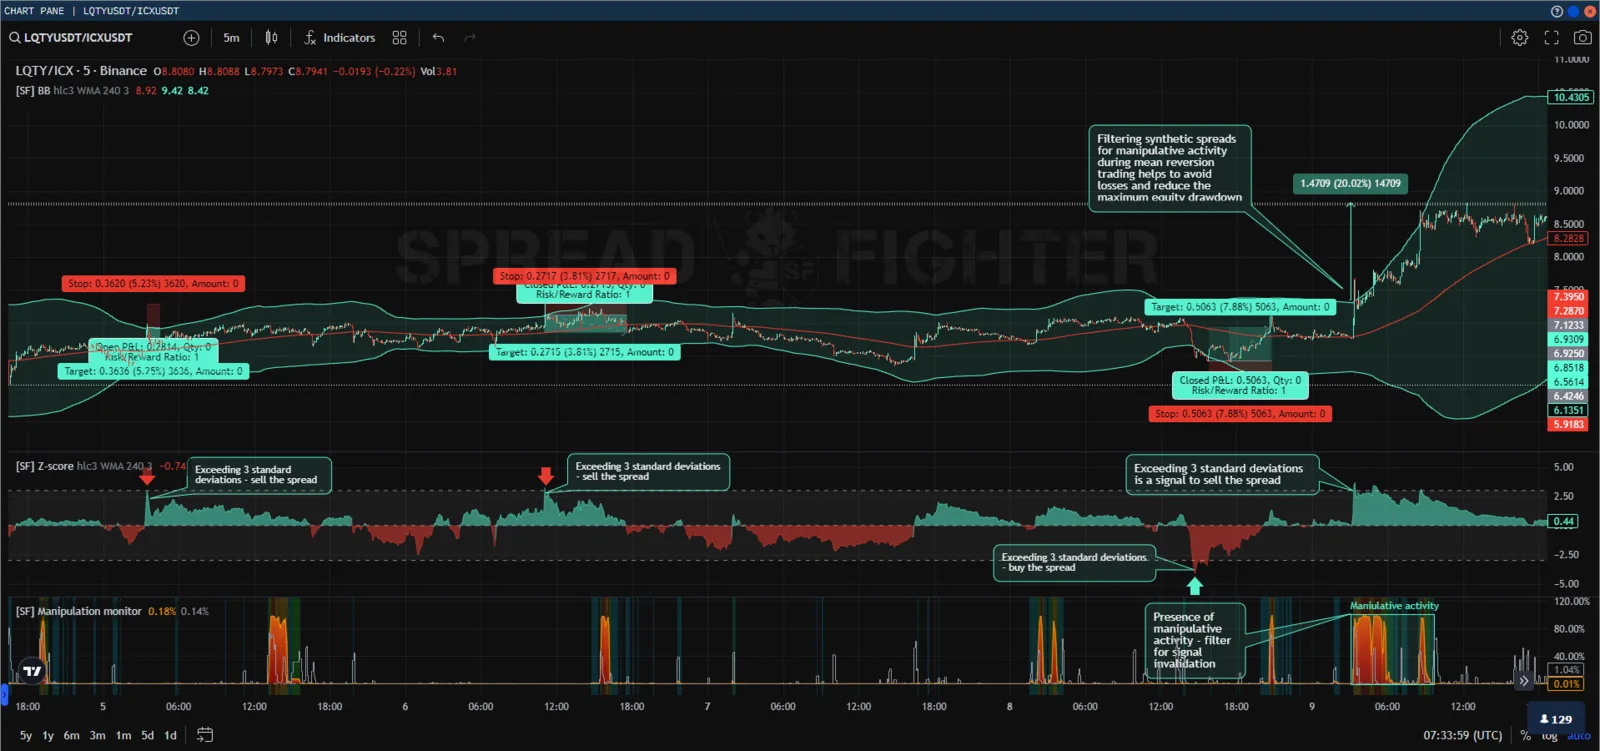
Trading a synthetic.
In this case, the Manipulation Monitor model lets you filter out trades with a potentially critical loss. This is a source of significant loss.
Finding inefficiencies and arbitrage opportunities
Besides detecting unnatural trading patterns, the Manipulation Monitor model also detects arbitrage opportunities and market inefficiencies, since in most cases market manipulation directly contributes to them.
For example, when manipulative orders cause short-term price divergences between related assets or markets.
Below is an example with the ONT coin, its perpetual futures contracts and swaps. On 13 Feb 2025, the model identified toxic activity in the microstructure.
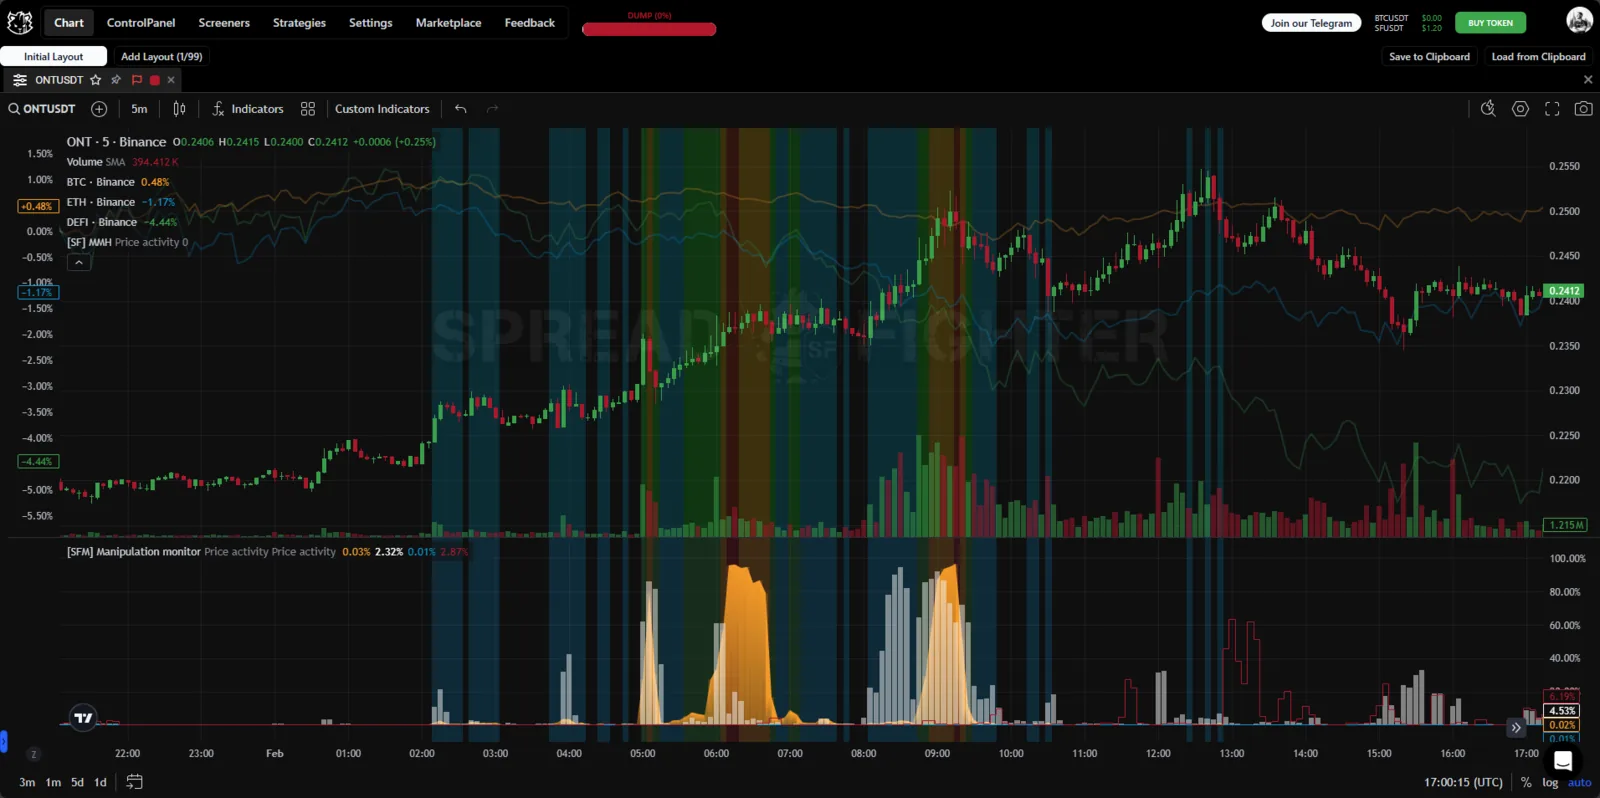
Manipulation Monitor readings for ONT on 13 Feb 2025.
If you open the limit order book and the liquidity heatmap, you can see various toxic trading practices: spoofing, layering, stuffing, etc.
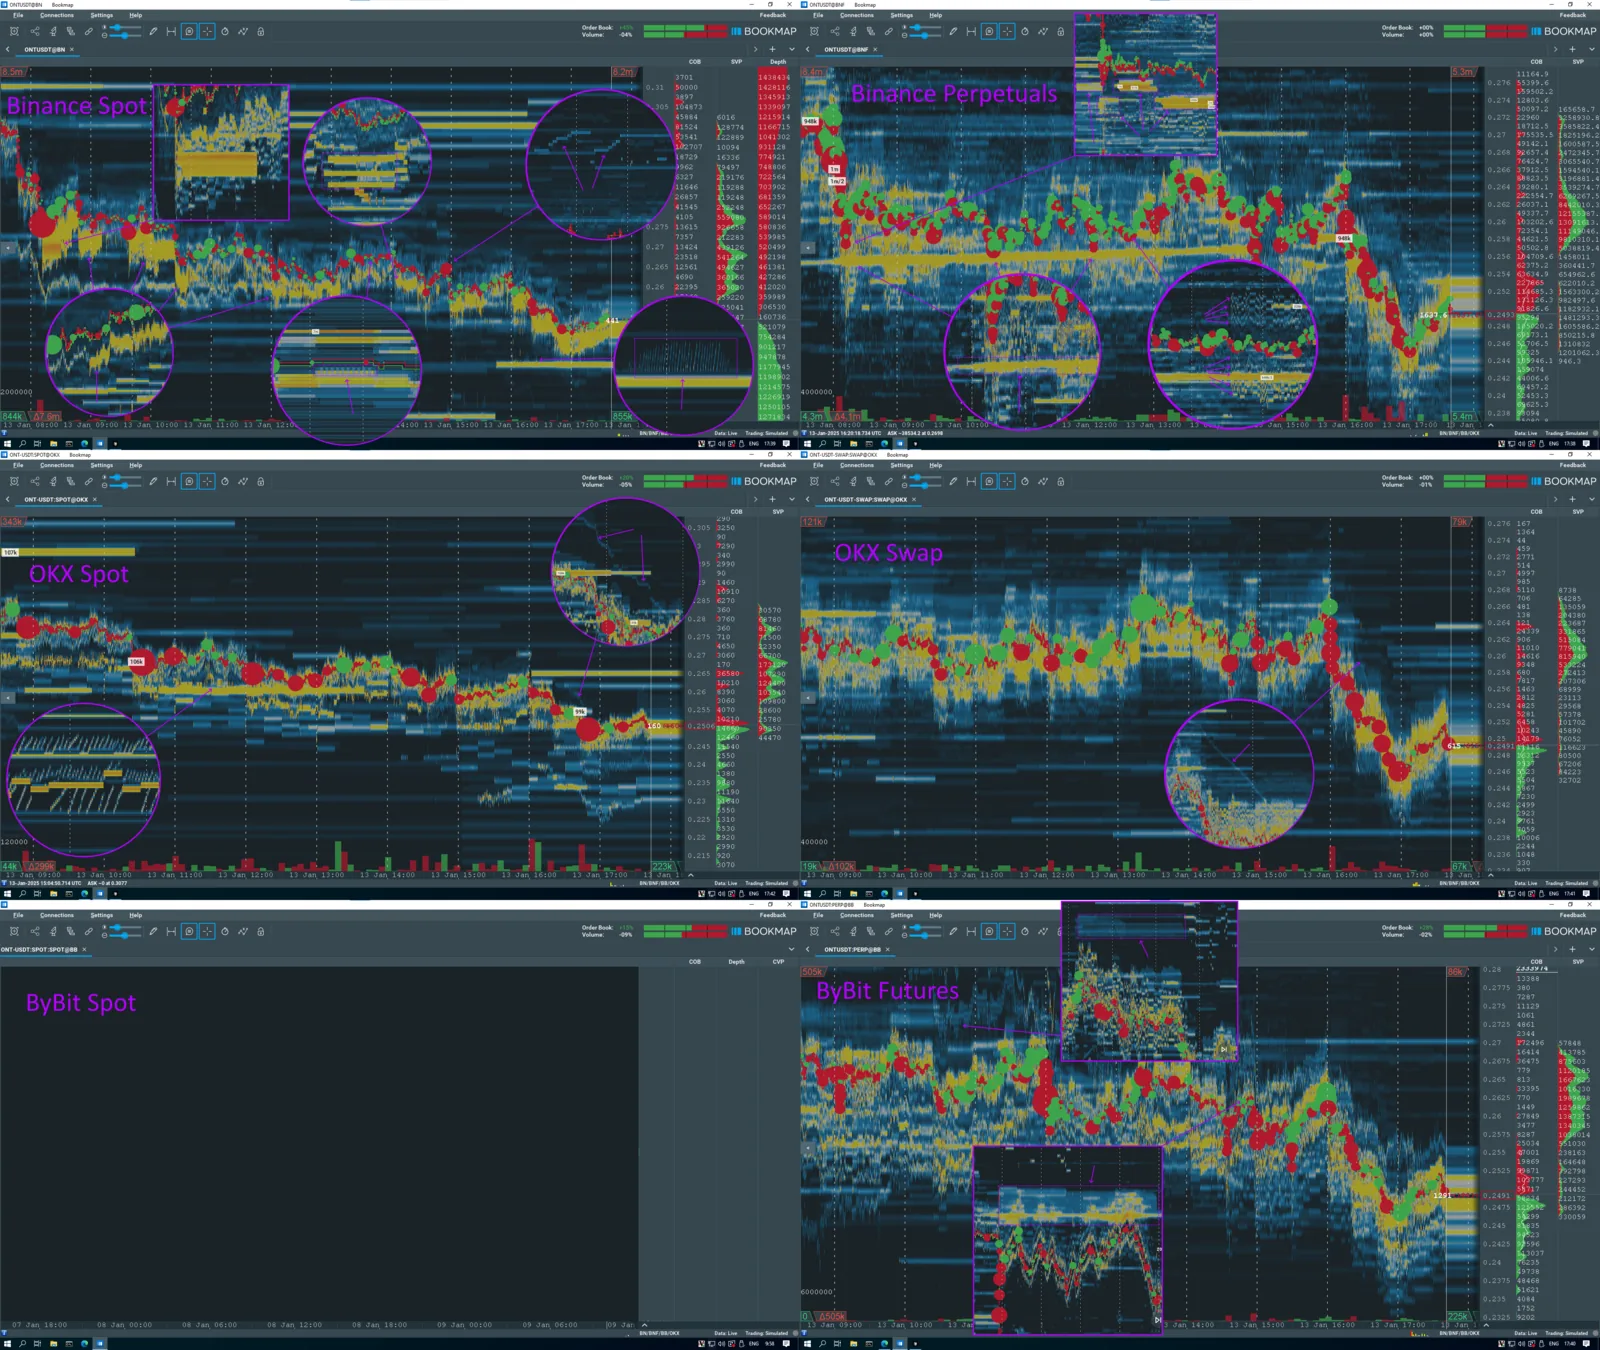
BookMap liquidity heatmap
Such activity creates strong imbalances in the market, which leads to price mismatches. In this case, the spread between the underlying asset and the perpetual futures reached 12%. The difference between derivatives on different trading venues was over 1%.
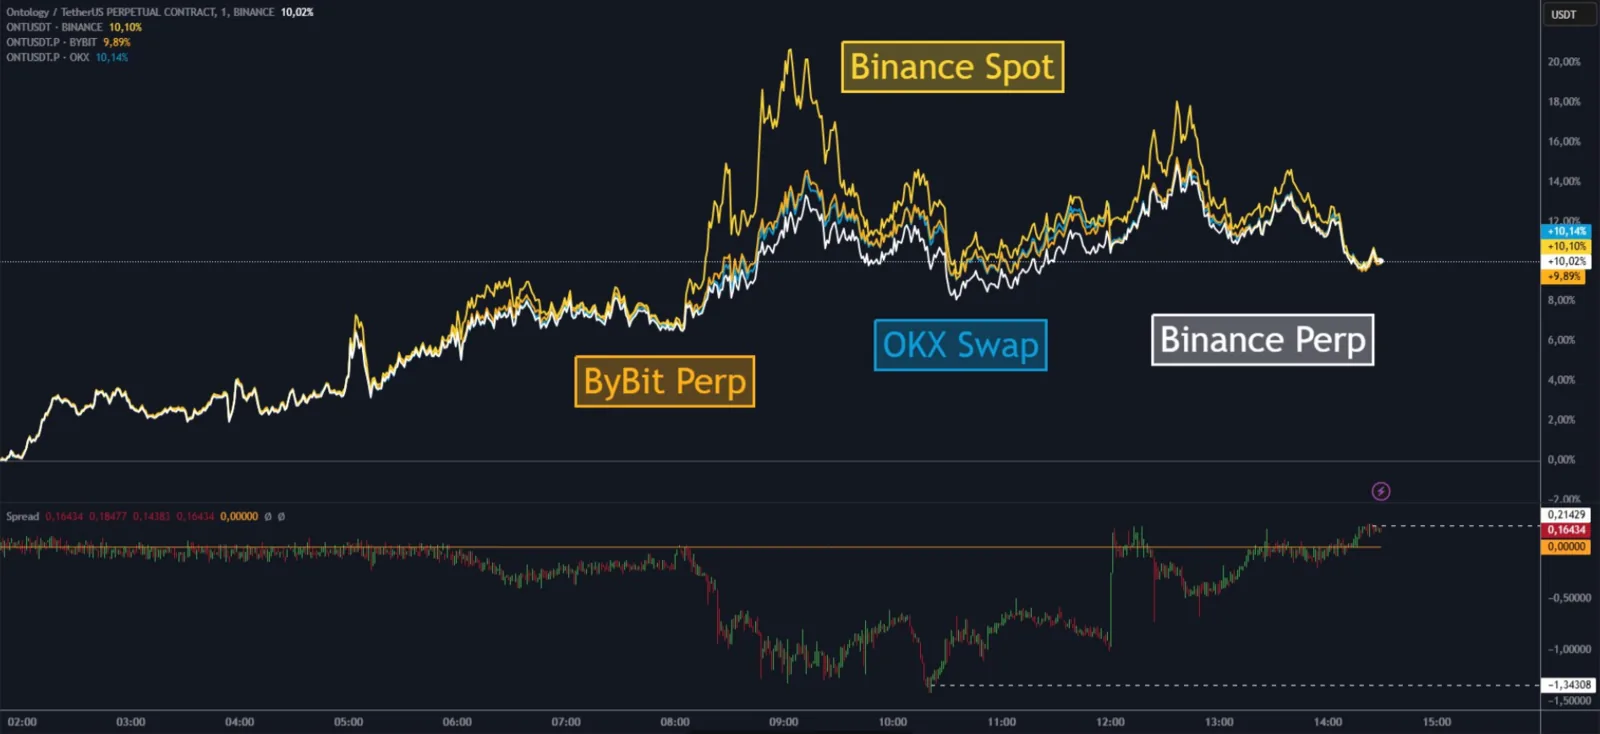
Arbitrage spreads between futures contracts and the underlying asset.