Net open interest, Net open interest delta, Net open interest spike
The model decomposes net open interest into the taker and maker sides.
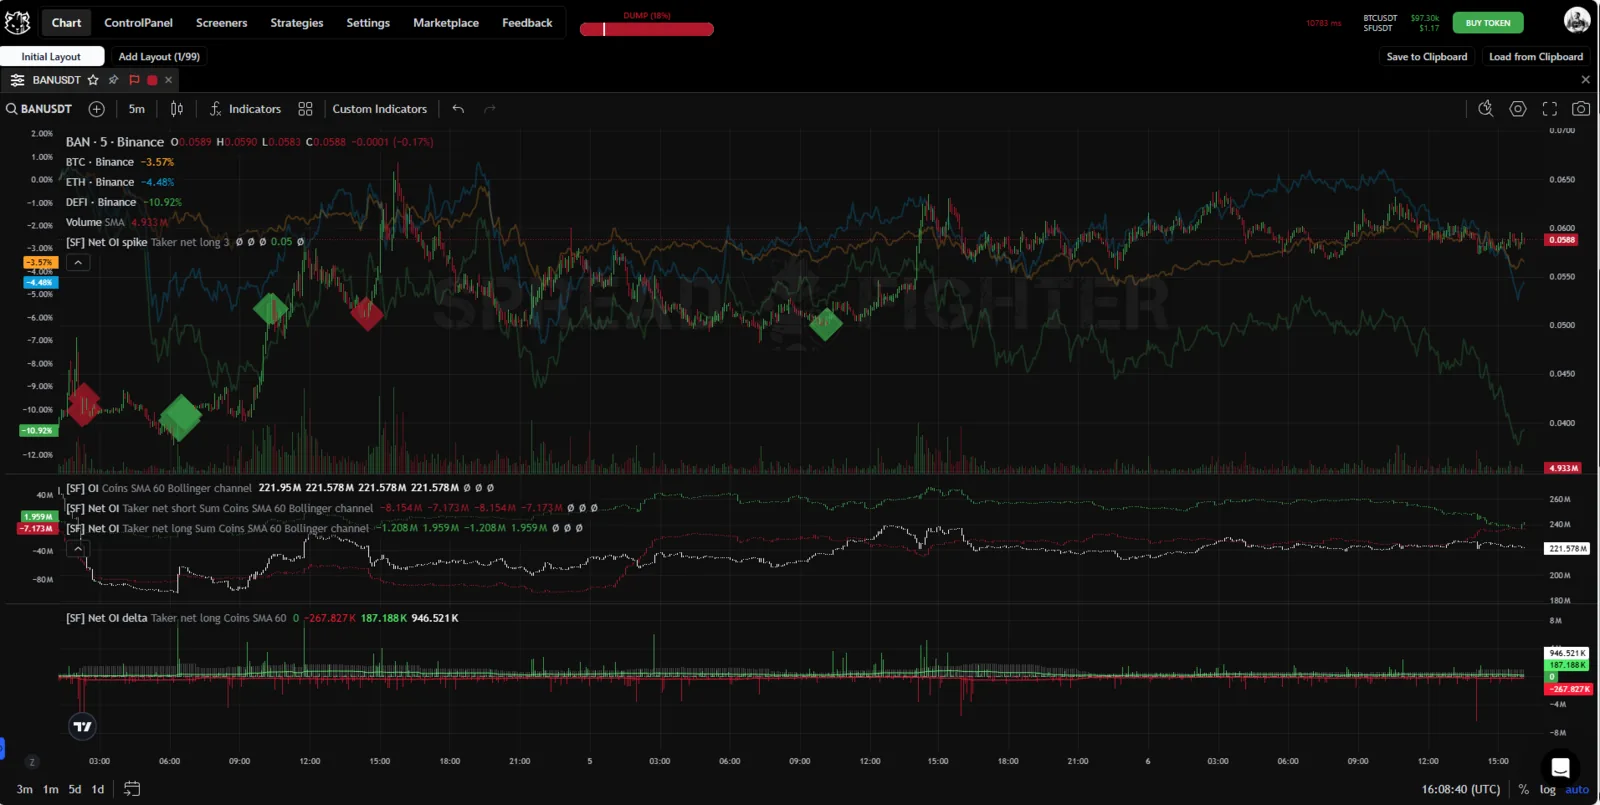
Indicator appearance.
Description
The indicator takes 2 input variables, Volume delta and Open interest delta, which are then matched by the following logic:
| Open interest delta > 0 | Open interest delta < 0 | |
|---|---|---|
| Volume delta > 0 | Net taker long delta = Open interest delta Net taker short delta = 0 | Net taker long delta = 0 Net taker short delta = Open interest delta |
| Volume delta < 0 | Net taker long delta = 0 Net taker short delta = Open interest delta | Net taker long delta = Open interest delta Net taker short delta = 0 |
As a result, the indicator gets 2 new variables:
- Net taker long delta - net long interest opened by market orders,
- Net taker short delta - net short interest opened by market orders.
From the Net taker long/short delta variables, the following are calculated:
- Net maker long delta - net long interest opened by limit orders,
- Net maker short delta - net short interest opened by limit orders.
The following holds:
- Net maker long delta = Net taker short delta;
- Net maker short delta = Net taker long delta.
At the same time:
Open interest = Net taker long delta + Net taker short delta = Net maker long delta + Net taker maker delta
Every buy/sell trade opened by a market/limit order always has a trade in the opposite direction with the opposite order type.
Important note! Since the indicator is calculated from data aggregated bar by bar, its readings on different timeframes may differ. We recommend using the smallest available timeframe. Later we will move the model calculation to the backend, on a tick frame.
The Net open interest indicator has one peculiarity: its values can sometimes be negative. This comes from how it is calculated. The Net open interest delta matrix model itself is calculated on the platform's server (backend) side. The candlestick chart is calculated on the client (frontend) side by integrating (a cumulative sum of) Net open interest delta over the whole historical interval loaded by the user. Because of this, the absolute values of the indicator can change as more historical data is loaded. Net open interest values can also go into negative territory if negative values dominate Net open interest delta. However, the relative changes of the model do not change.
Net open interest has 3 display forms: candlestick chart, histogram and highlighting of spikes.
Net open interest is a candlestick chart in which the open, high, low and close take the corresponding net open interest values.
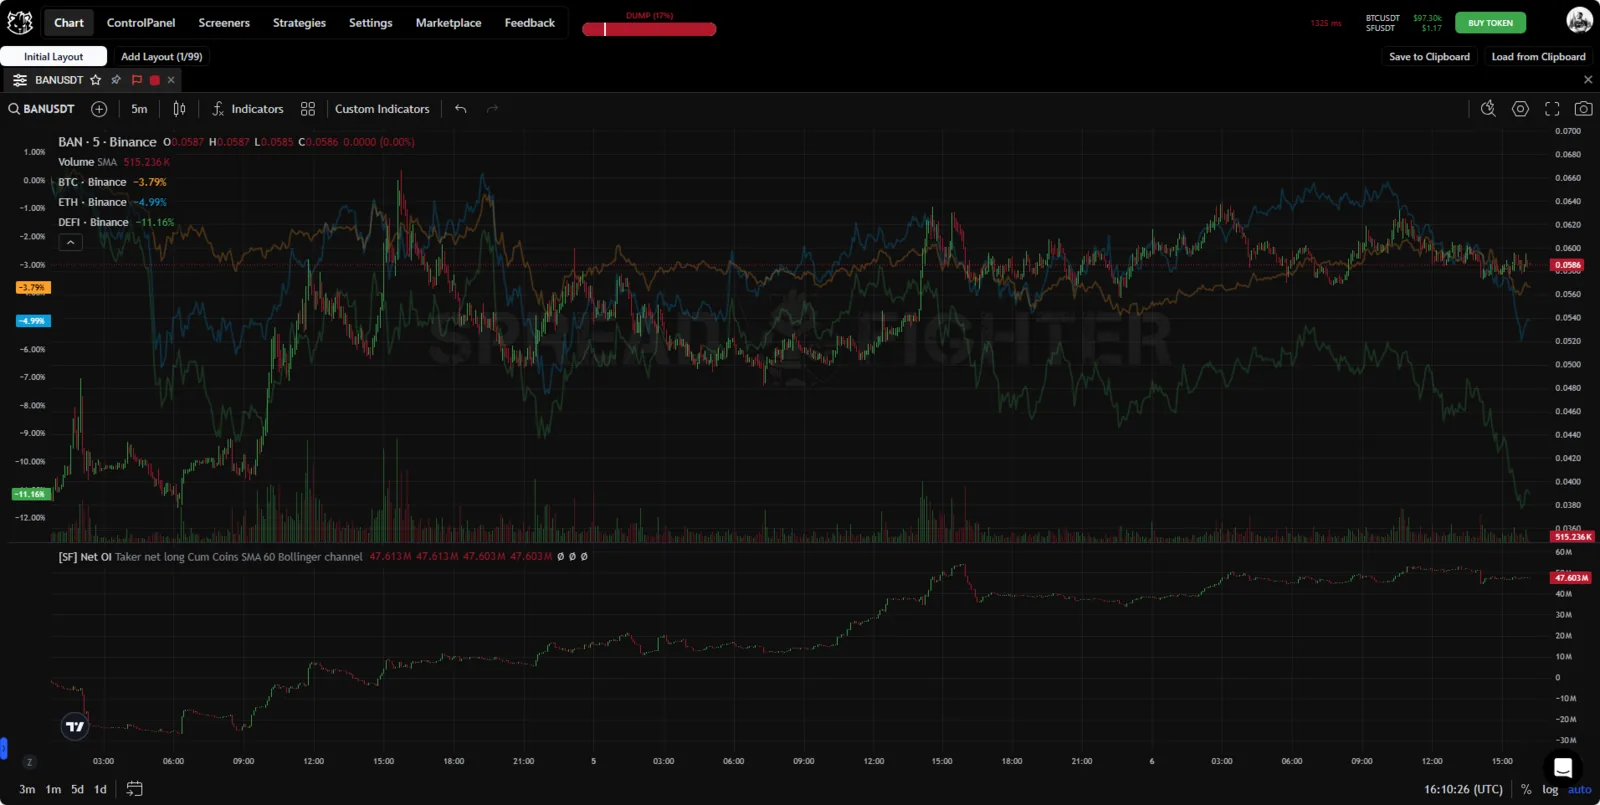
Net open interest candlestick chart.
Net open interest delta is a histogram that shows the change in net open interest. Besides the histogram, the standard deviation and 2 types of moving averages are calculated, for positive and negative changes respectively.
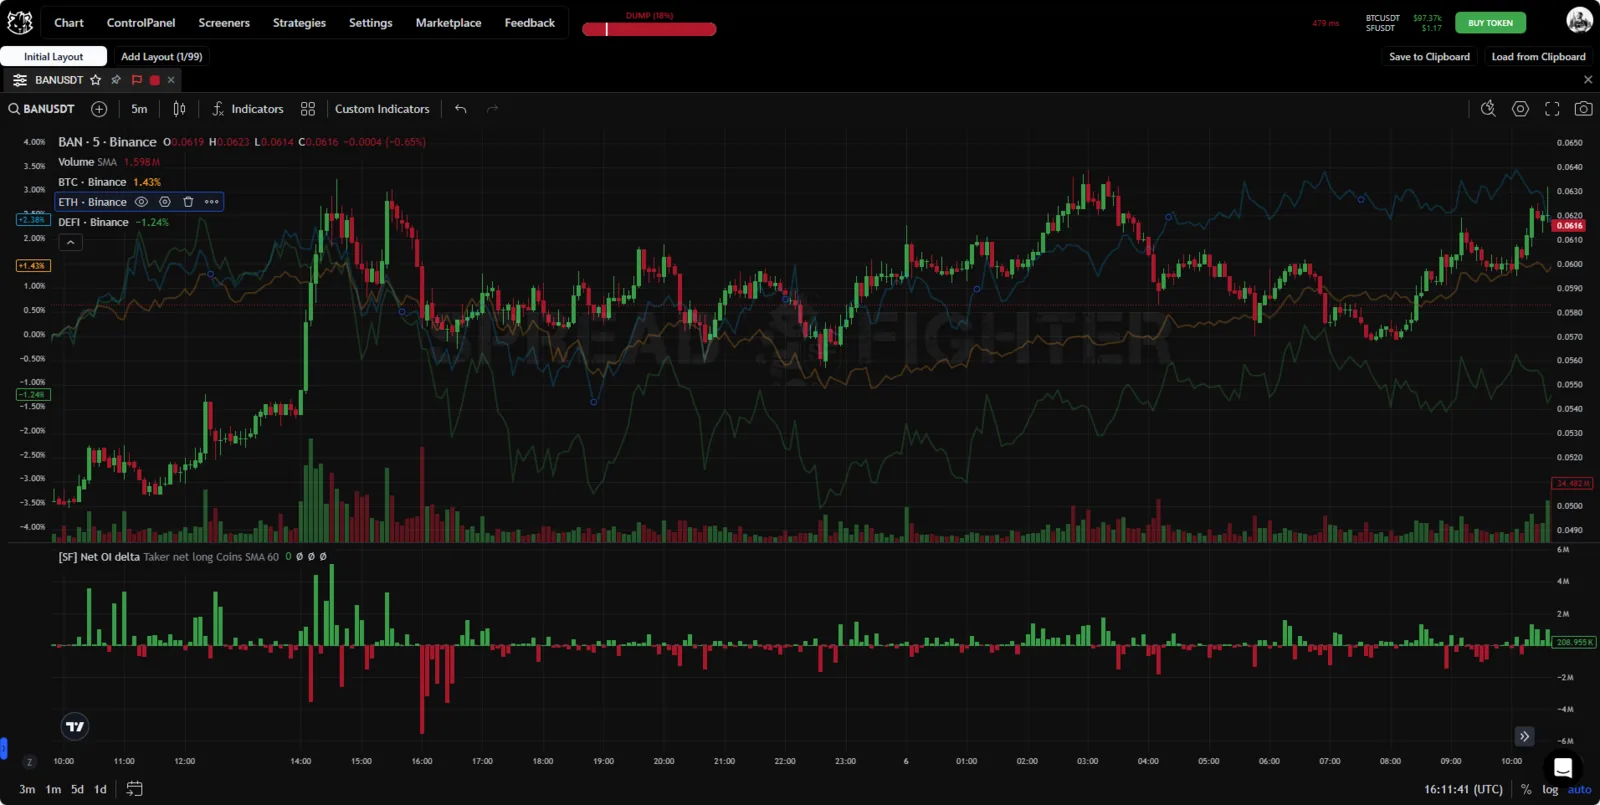
Net open interest delta histogram.
Net OI spike shows abnormal spikes in net open interest on the chart. Positive spikes ("money in") are highlighted in green, negative ones ("money out") in red. The indicator uses a Z-score, so the model adapts to changing market conditions and works in any market environment.
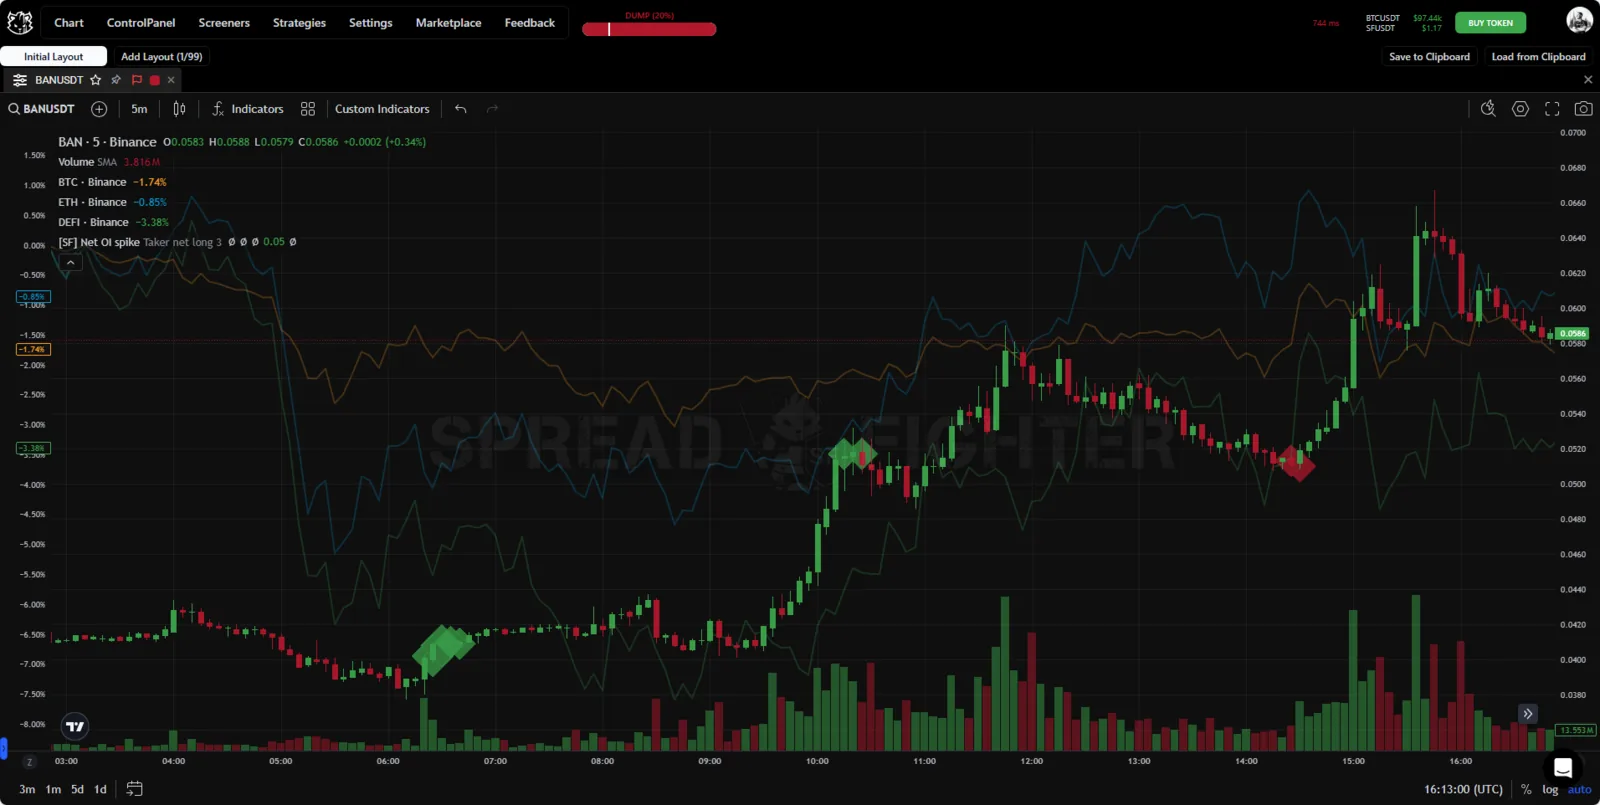
Net open interest spike spikes.
Use cases
The Net open interest model, with a fairly significant assumption, still lets you separate the direction and volumes of trades of large participants and retail traders from each other.
The model shows its full value together with other tools. Below we look at 4 cases: 2 pump&dump campaigns and 2 ordinary situations in which Net open interest helps avoid unpleasant losses.
LQDTY pump&dump
On 9 Oct 2023 at 3:15:00 UTC, the LQDTY coin starts a substantial rise of almost 30%, amid heightened activity in the project's social media. The rise is accompanied by manipulative activity, which is shown in the corresponding indicator.
Over the next day, until 10 Oct 2023 12:00:00 UTC, market taker participants opened long positions on the perpetual futures contract (and, accordingly, market maker participants opened the same amount of short positions) worth ~$30M, and short positions worth $4.3M. The average position open price was $1.4418.
From 10 Oct 2023 12:00:00 UTC to 13 Oct 2023 8:00:00 UTC the asset was in a distribution stage, during which market maker participants reduced their long exposure by ~$3.2M from the start of the campaign, or $7.5M in total. Right after the distribution ended and the market maker participants rebalanced their positions, the asset started a steady move. As of 13 Oct 2023 16:40:00 UTC it was ~13%.
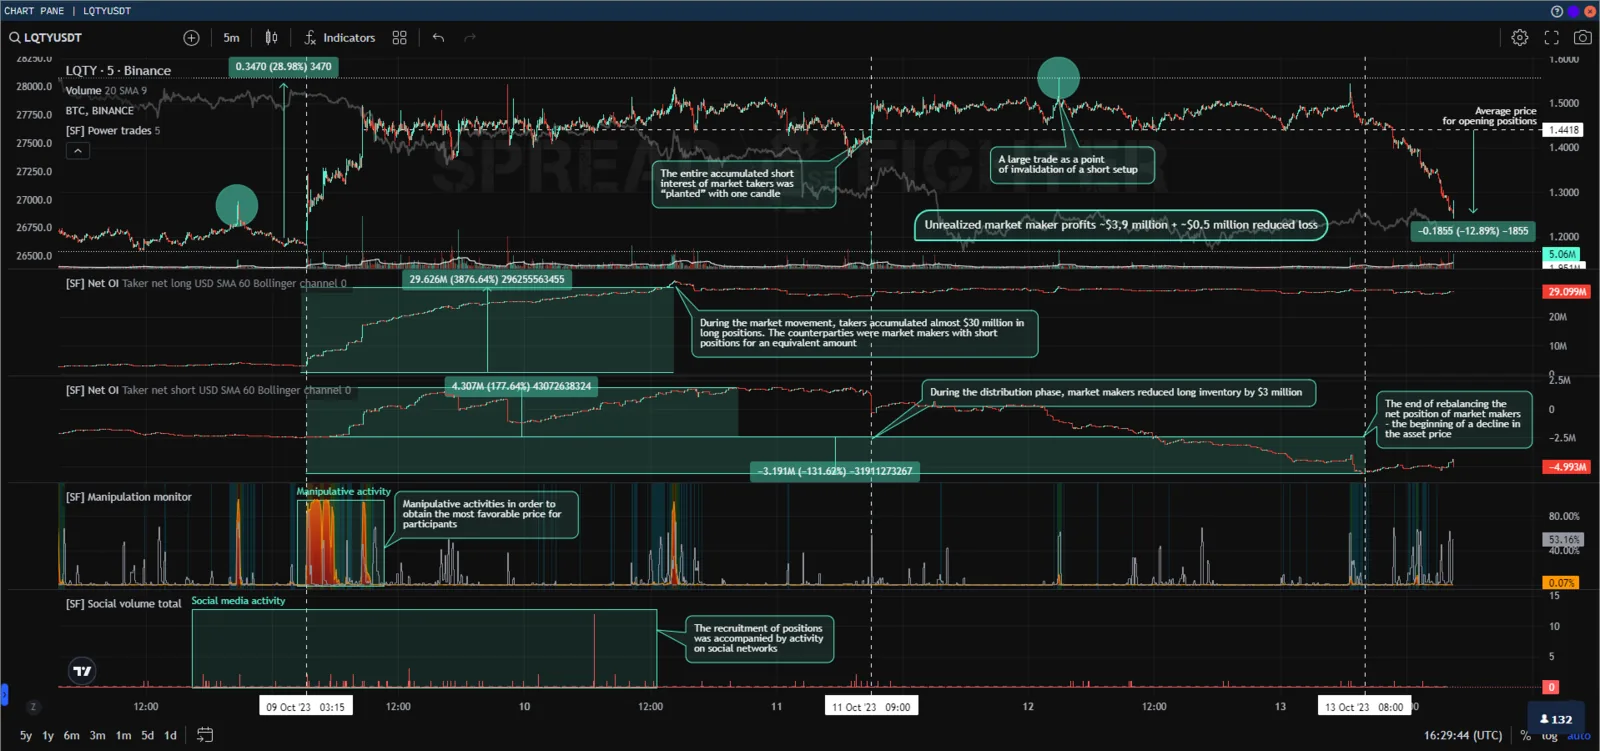
LQDTY pump
So market taker participants were left with a total unrealized loss of $3.9M. Market maker participants became their counterparties and got an equivalent unrealized profit. They also cut their potential loss by $0.5M by closing their long positions in the distribution phase at prices above the average fair value.
In this case the Net open interest model lets you track the rebalancing of portfolios of different categories of participants. It shows who opened or closed, in which direction, and against whom.
ZRX pump&dump
The next case is less obvious. Consider the ZRX pump of 8 Oct 2023. At 14:00:00 UTC the asset starts a rapid rise of ~30%, which, as in the previous example, was accompanied by a participant's manipulative activity and by sharply higher positive sentiment in the project's social media.
The balance of power here is not so strikingly different. Market taker participants opened ~$7.6M long and $5.4M short. Market maker participants opened the opposite positions of the same volume. The average price of all open positions was $0.2225.
So market taker participants have an exposure of ~$2.2M long at a price of $0.2225, and market makers have the same in short.
The rise continued until ~17:45 UTC, exactly as long as social media activity stayed at fairly high levels and new money was coming into the market. Once the inflow ends and positive sentiment fades, the price quickly returns first to the average open price of most of the open interest, and then steadily drifts down to its fair values.
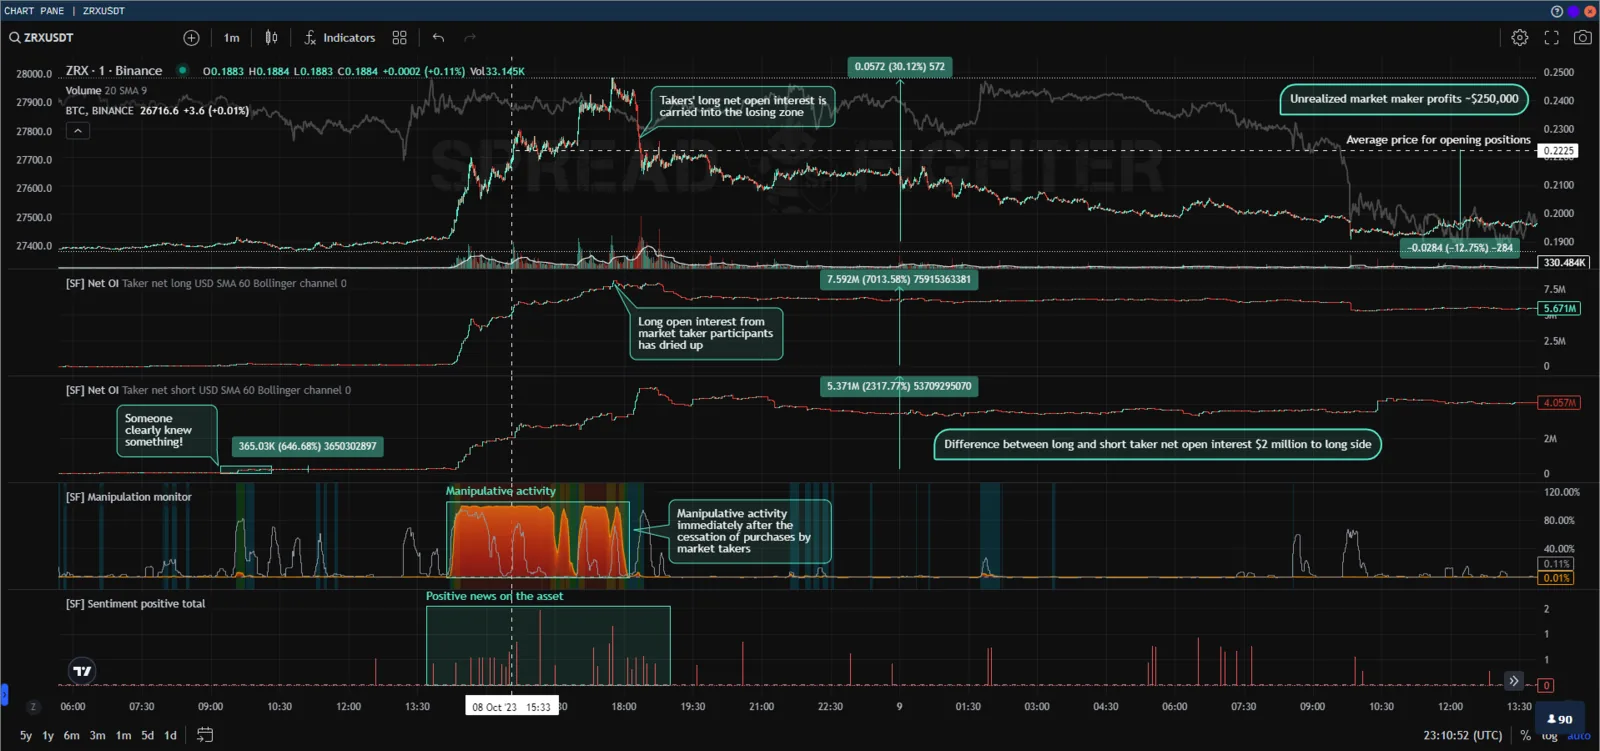
ZRX pump
As a result of the campaign, market taker participants were left with a total unrealized loss of $0.25M. Market maker participants became their counterparties and got an equivalent unrealized profit.
Nobody usually writes rigid plans for manipulative campaigns and pump&dumps. How the "game" develops depends on how loaded the order book is and on the participant's net exposure. In this case the Net open interest model lets you calculate the latter.
Short squeeze BNB
The next example is not as large a campaign as the previous two. But such situations happen much more often.
On 12 Oct 2023 from 9:30:00 UTC to 9:57:00 UTC, during a market flush, market maker participants used high-frequency algorithms to buy back a significant part of the liquidations and stop-loss orders. This is shown in the Stop killer, Manipulation monitor and HFT activity models. As a result, their net long exposure in the asset grew by $2M.
On 12 Oct 2023 at 11:30:00 UTC a participant appears in the asset, which is shown in the Manipulation monitor model. The price starts rising, exactly until the short positions opened by the market taker side are closed at a loss. This is shown in Net open interest, Power trades and Stop killer. The climax of the move was a short squeeze, after which BNB deviated from the overall market by ~1.61%. This is shown in the synthetic pair BNBUSDT/BTCUSDT and the Z-score model.
Right after the market makers' excess long exposure was liquidated, manipulative activity faded.
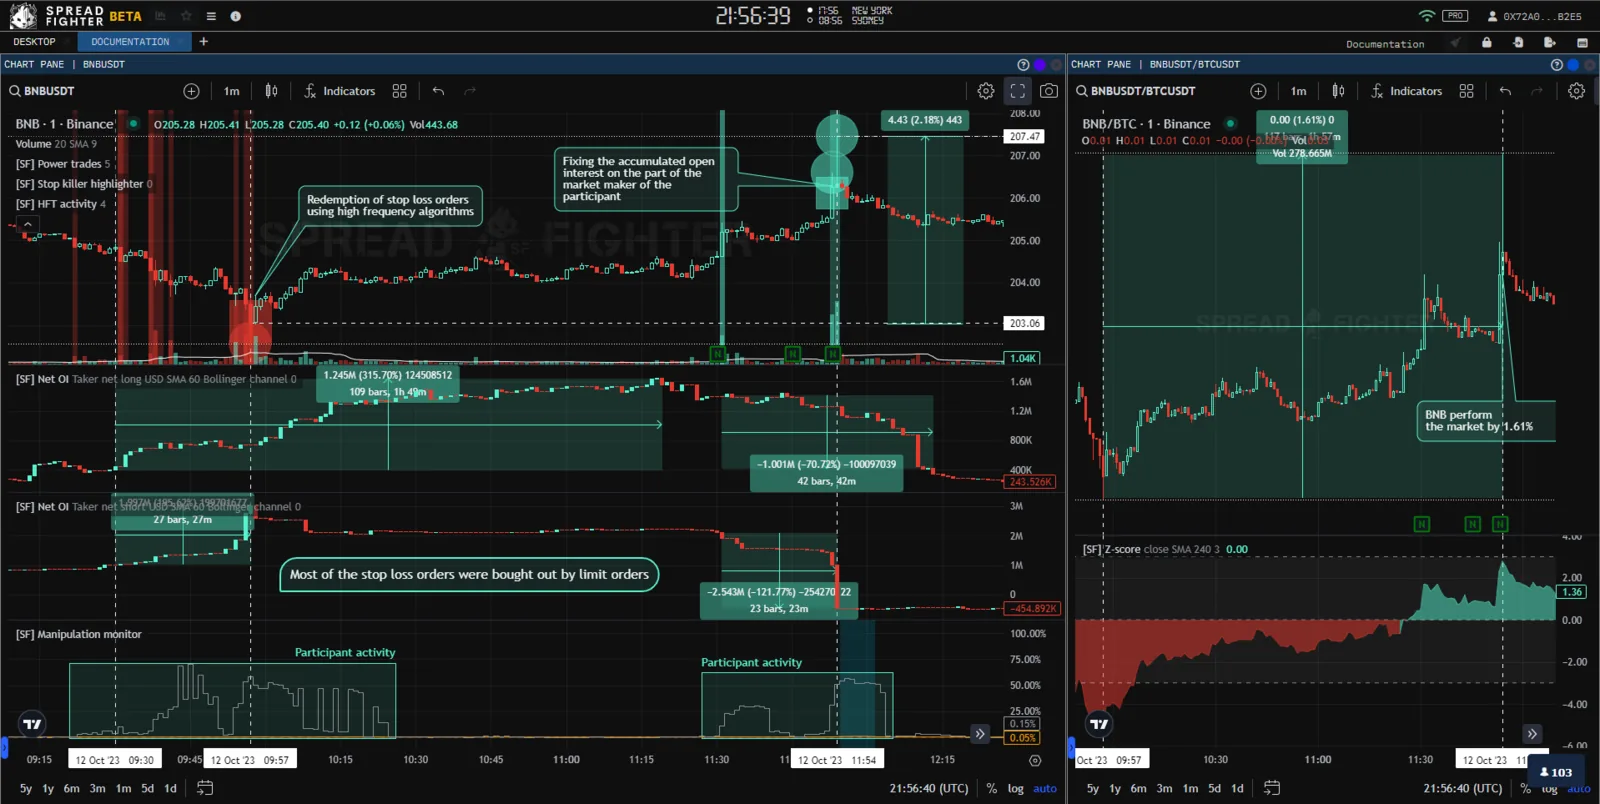
Short squeeze BNB
As a result of the campaign, market taker participants got a net realized loss of ~$25k. Market maker participants became their counterparties and got an equivalent unrealized profit.
Trapping a large BLUR short position in a loss
The BLUR example is similar to the previous one. On 12 Oct 2023 at 19:50 UTC, in the BLURUSDT perpetual futures contract, market taker participants open a large short position of ~$300k. This is shown in the Net open interest and Net open interest spike models, and in trading volume.
Market maker participants, who became the counterparty to the trade, react immediately. A few minutes later, manipulative activity appears in BLUR, and quotes move ~4.3% against the short position the market taker participants just opened. The BLUR price deviates from the overall market by 5.8%. This is shown in the synthetic pair BLURUSDT/BTCUSDT and the Z-score model.
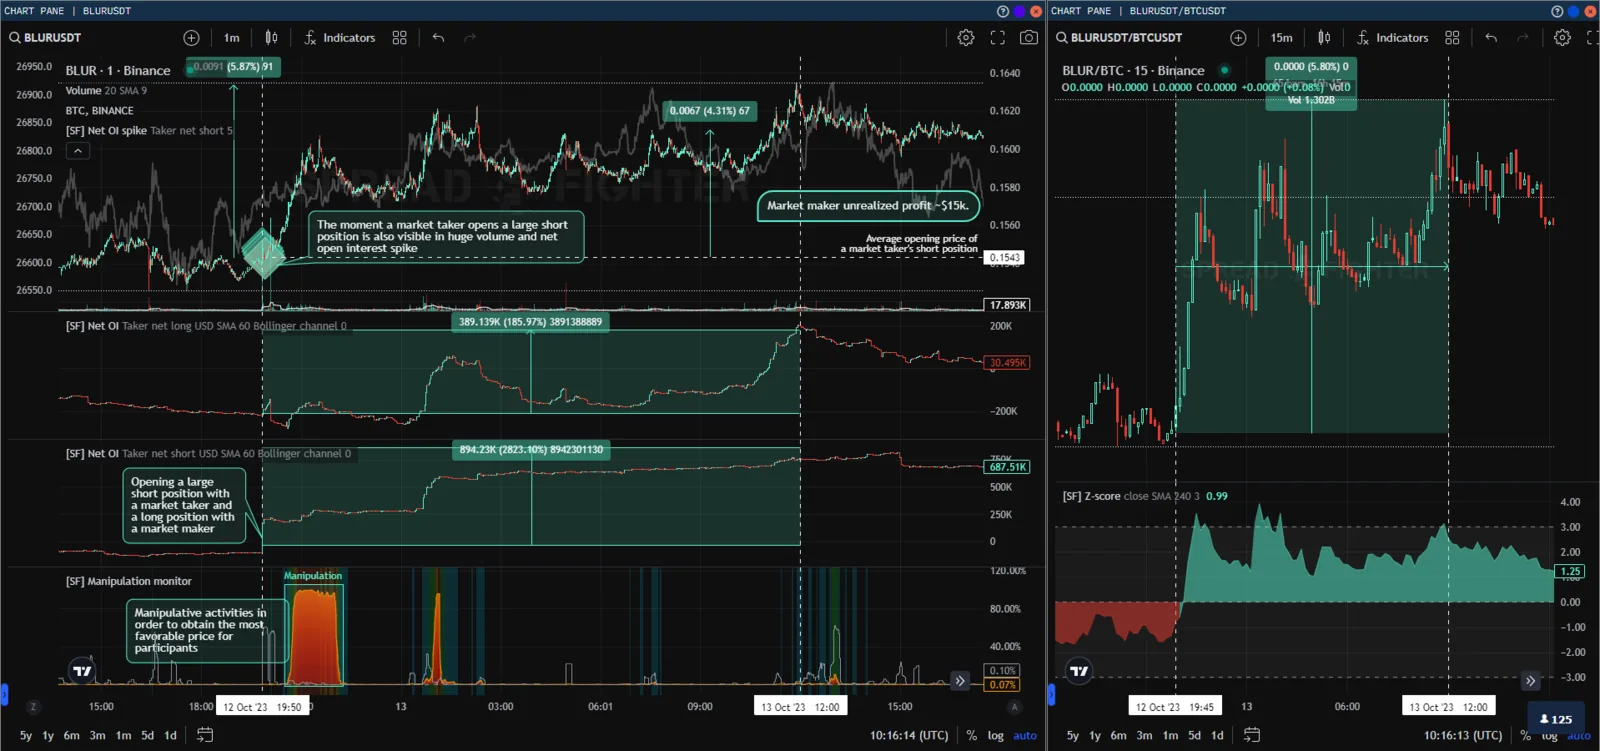
Trapping a large BLUR short position in a loss
As a result of the campaign, market taker participants got a net realized loss of ~$13k. Market maker participants became their counterparties and got an equivalent unrealized profit.
Setups like BNB and BLUR do not bring extreme profits. They help you avoid standing against participants whose counterparty you really do not want to be, or exclude certain positions from trading baskets or portfolios. Here Net open interest helps compare the balance of power between the long and short sides and make a correct decision on opening or closing positions, which avoids unnecessary losses. Importantly, the model also lets you adjust position sizes and control inventory risk, so you do not become "food" and a source of profit for other participants. This is especially relevant for low-liquidity instruments.