Open interest, Open interest delta, Open interest spike
The volume of open positions on a futures contract.
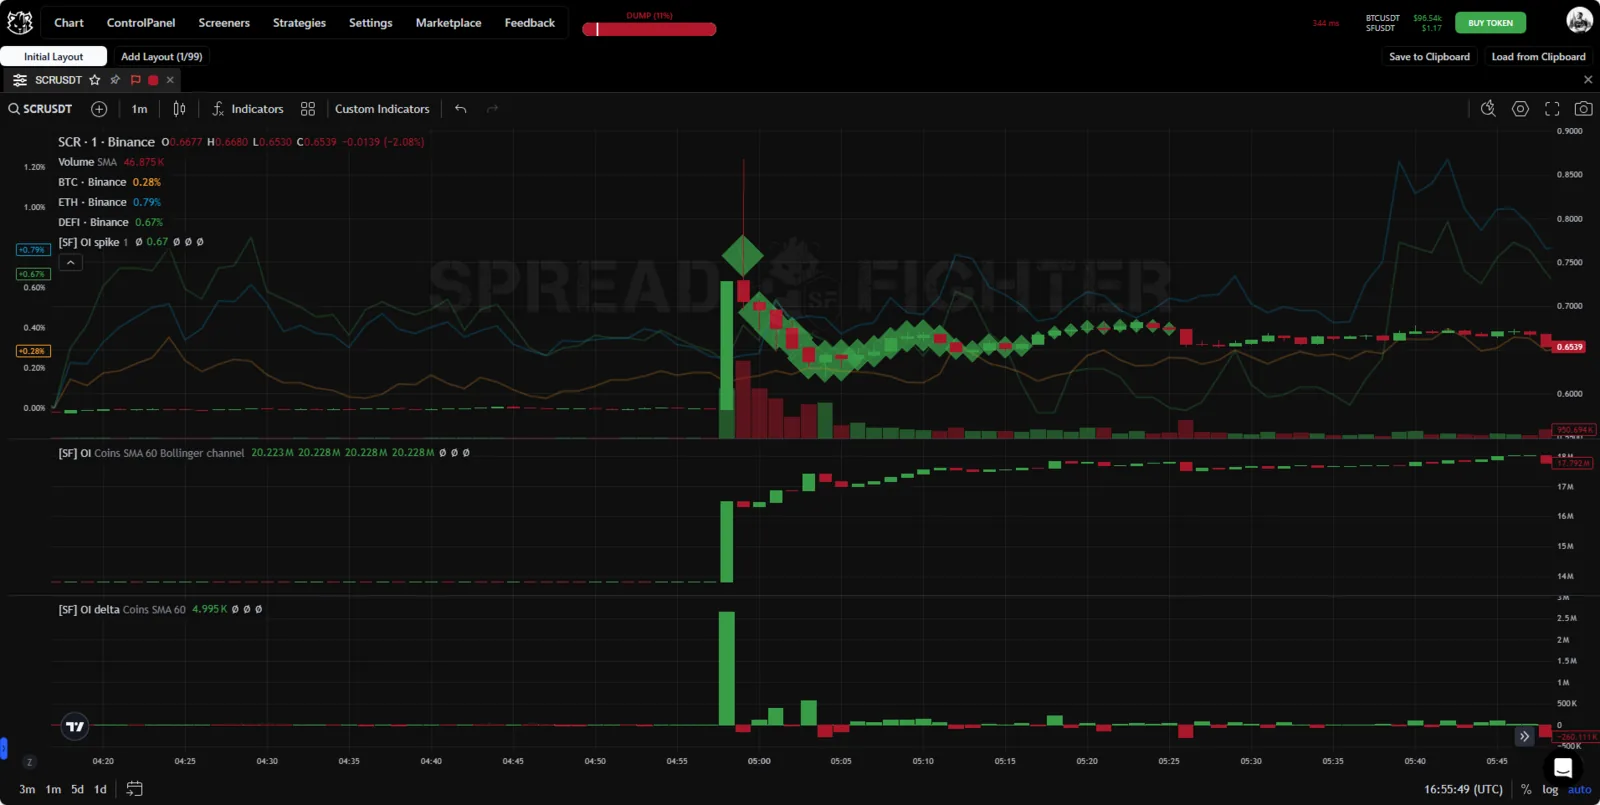
Indicator appearance.
Description
Open interest is the total of open contracts on a futures contract. Every contract opened long has a matching contract opened short. The data comes directly from the exchange.
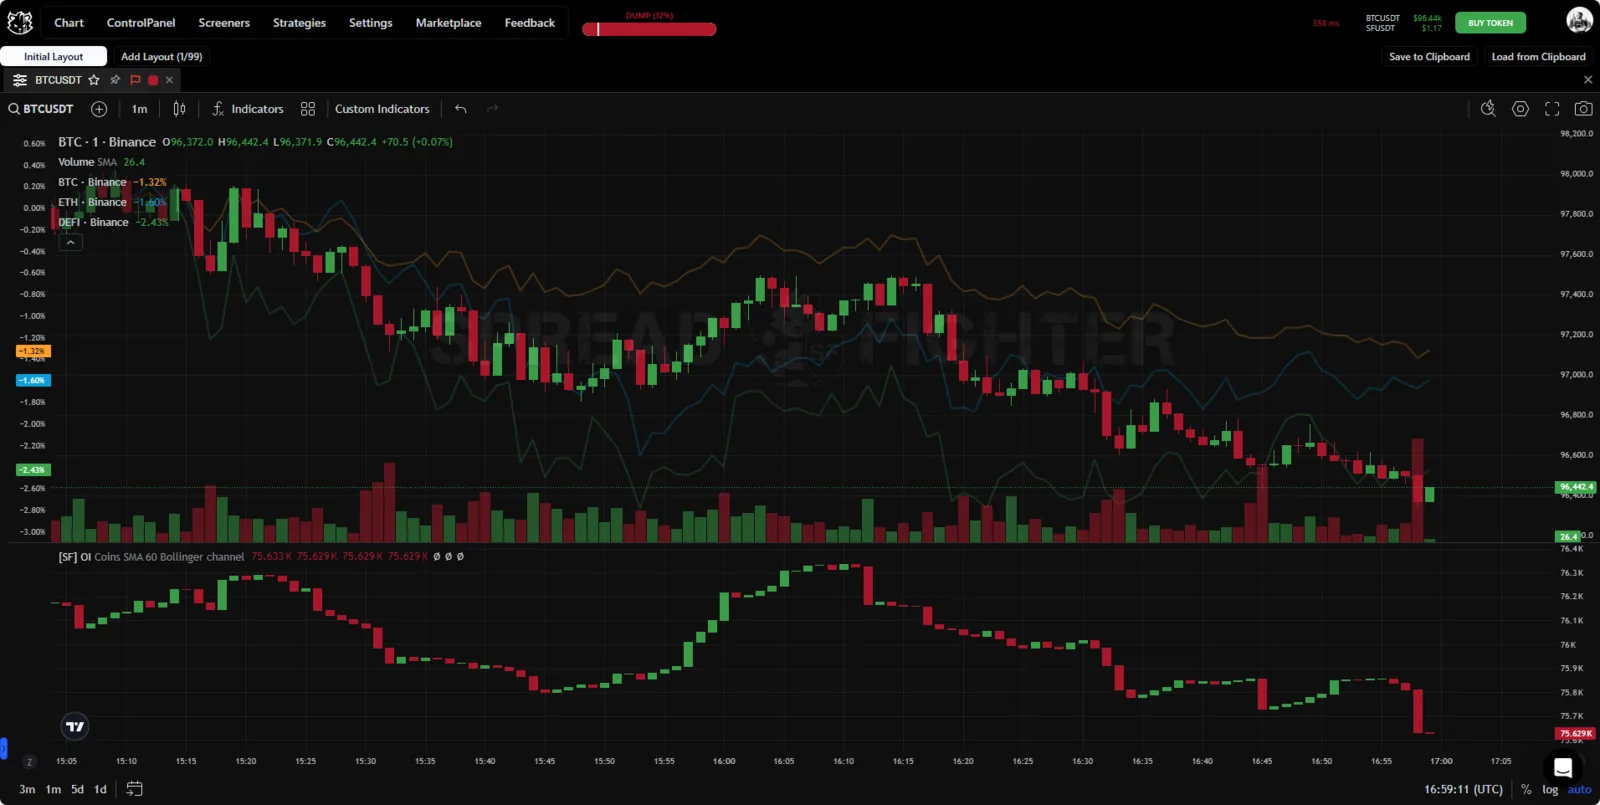
Open interest indicator.
Besides the candlestick chart, open interest has 2 alternative display forms:
- histogram,
- highlighting of spikes.
Open interest delta is a histogram that shows the change in open interest. Besides the histogram, the standard deviation and 2 types of moving averages are calculated, for positive and negative changes respectively.
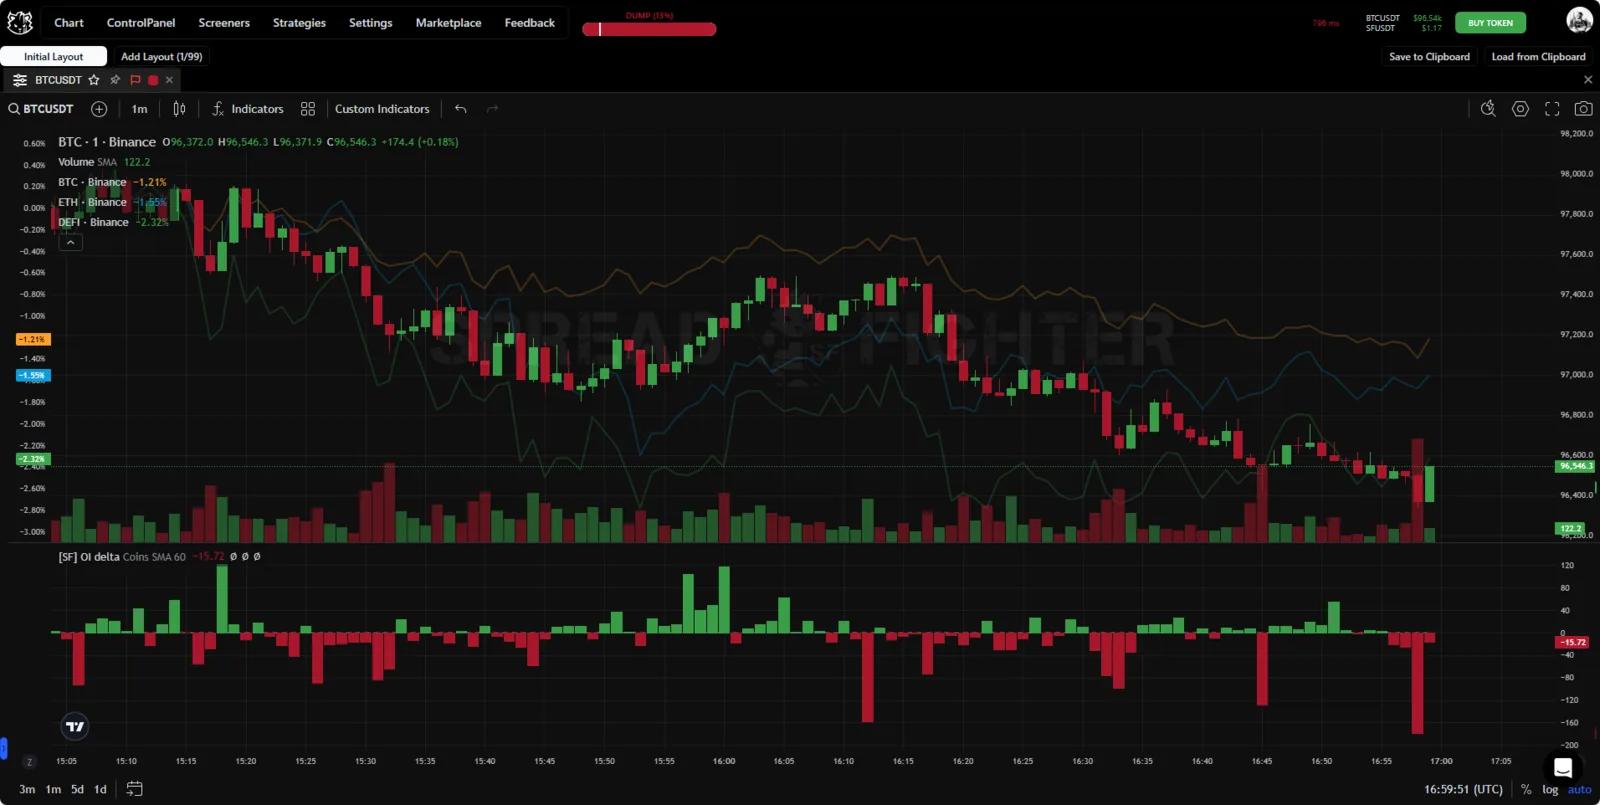
Open interest delta.
Open interest spike shows abnormal spikes in open interest on the chart. Positive spikes ("money in") are highlighted in green, negative ones ("money out") in red. The indicator uses a Z-score, so the model adapts to changing market conditions and works in any market environment. The spike indicator has one parameter to change: the filter, which takes values from 1 to 5. The higher the filter value, the more abnormal the spikes that get highlighted.
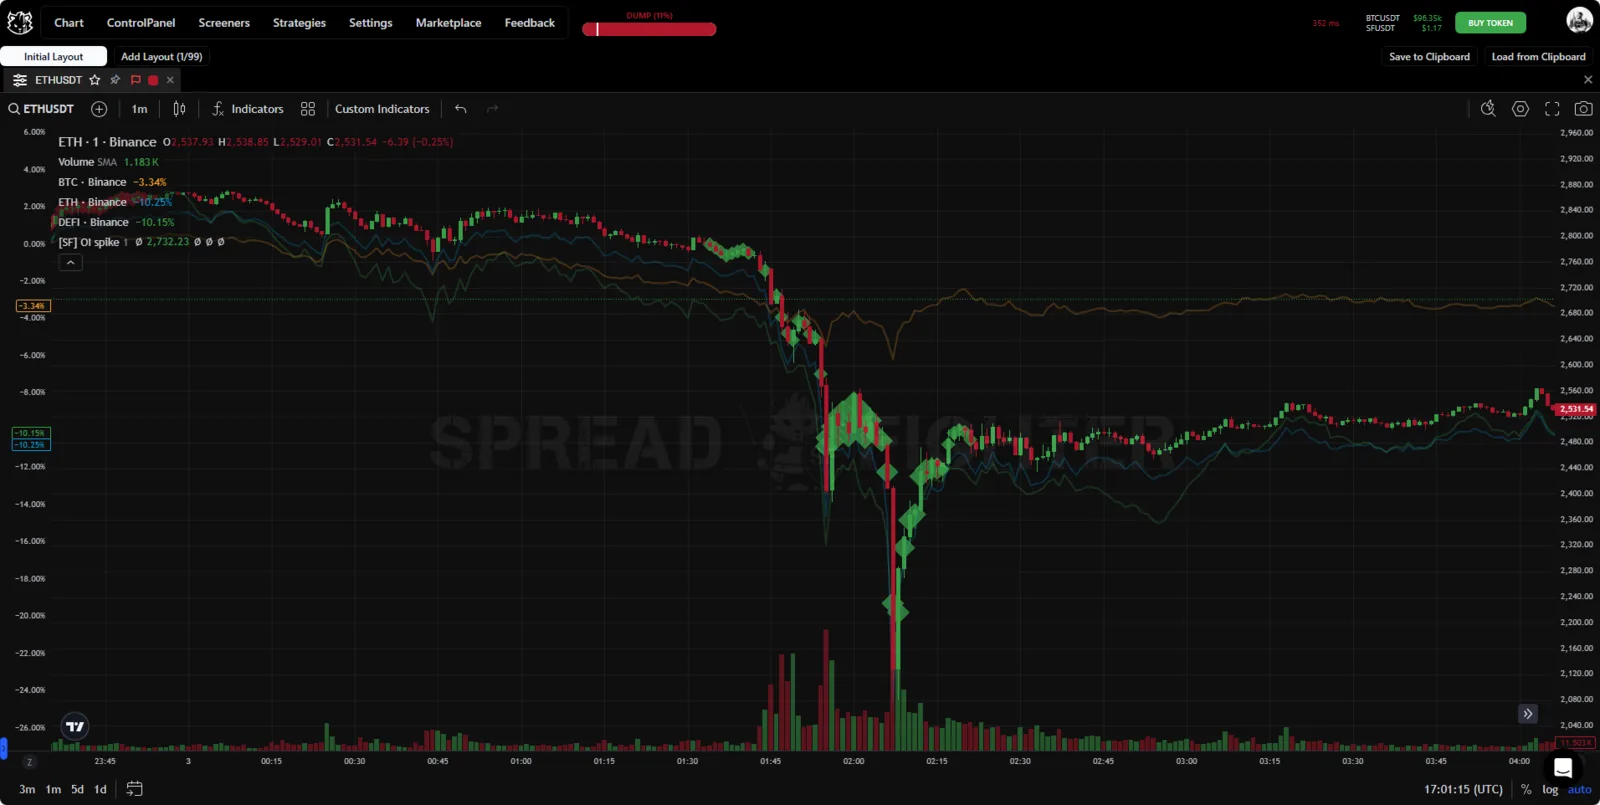
Open interest spike.
Use cases
Open interest (OI) is a technical indicator equal to the number of outstanding derivative contracts, such as futures and options, that have not yet been settled. In simple terms, it is a tool that shows in real time the total number of ALL open derivative positions held by market participants, regardless of direction.
It is determined by adding up all opened trades and then subtracting all closed ones.
For example, if open interest in BTC futures grows together with a small rise in the BTC price, this usually points to a continuing uptrend. Conversely, a drop in open interest in BTC futures during a small pullback in BTC usually points to a forming downtrend.
A simultaneous rise in open interest and price shows an active upward market move. But if the price rises while open interest falls, the upward move is weakening. A drop in both open interest and price shows a consolidation phase. Conversely, a falling price together with growing open interest shows market weakness.
The Open interest indicator alone gives no trading edge. But together with other indicators, such as Price, Volume and Delta (Volume Delta), it lets you assess the prevailing sentiment of market participants at the moment, both large and small.
Patterns that OI readings can point to, to confirm the current trend and detect potential trend changes:
- Rising price & Rising delta (volume) & Rising open interest = Market buyers are building positions (Bullish trend)
- Rising price & Falling delta (volume) & Falling open interest = Bearish trend
- Falling price & Rising delta (volume) & Rising open interest = Bearish trend
- Falling price & Falling delta (volume) & Falling open interest = Market sellers are taking profit on positions (Bullish trend)
Compared with Volume, Delta gives insight into the direction of trader sentiment. So in the examples we will analyze the relationship between Price, Delta and Open interest.
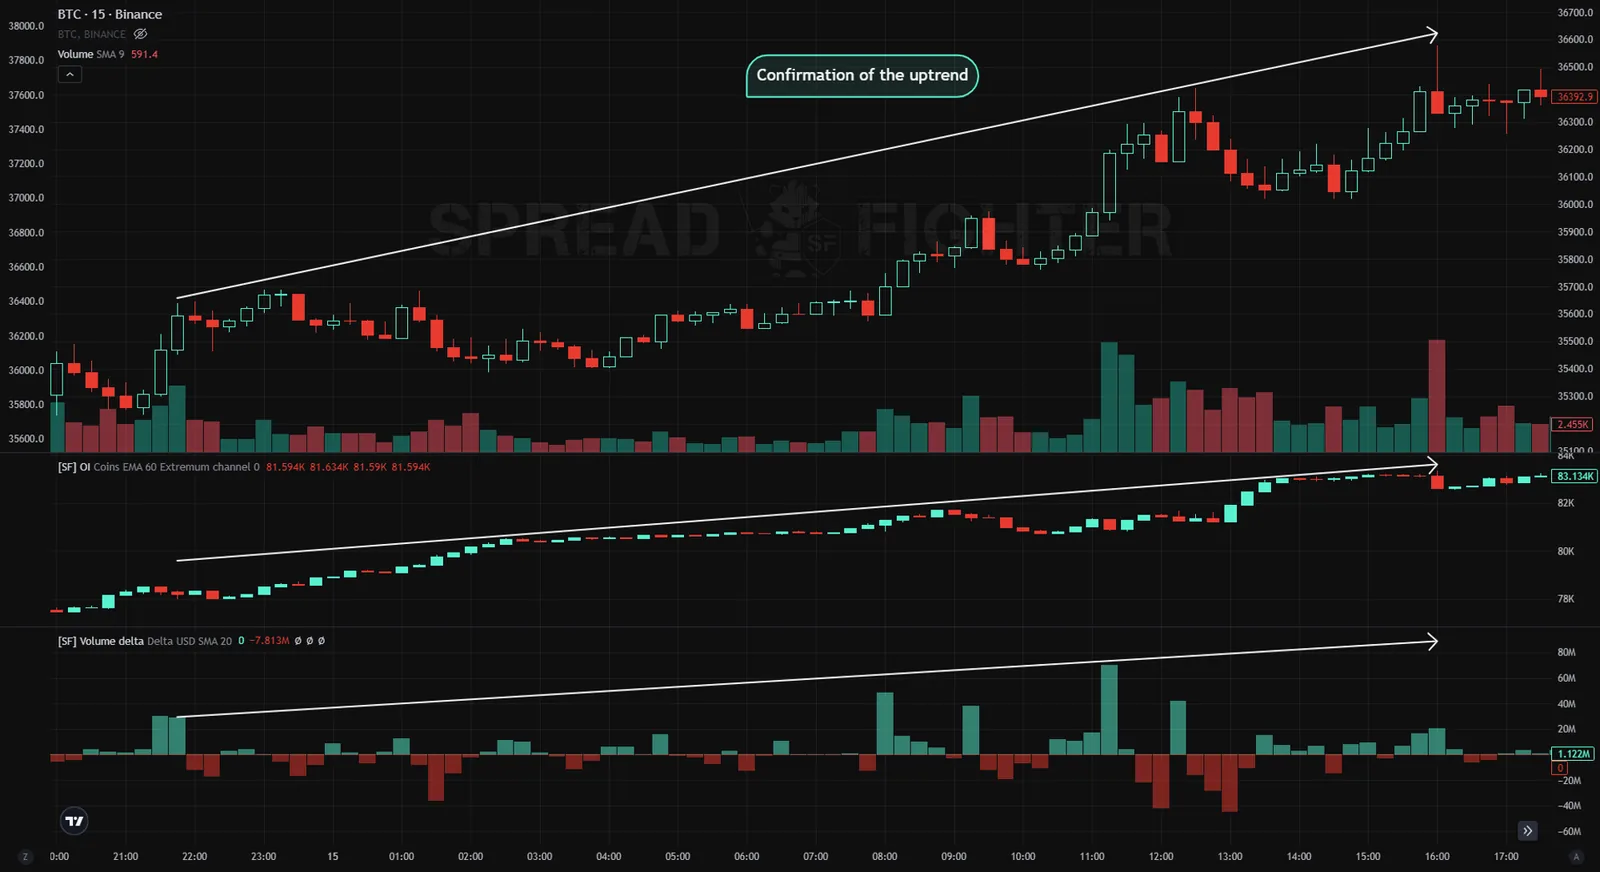
Confirmation of an uptrend by OI and Delta. Open interest is positioned in buys.
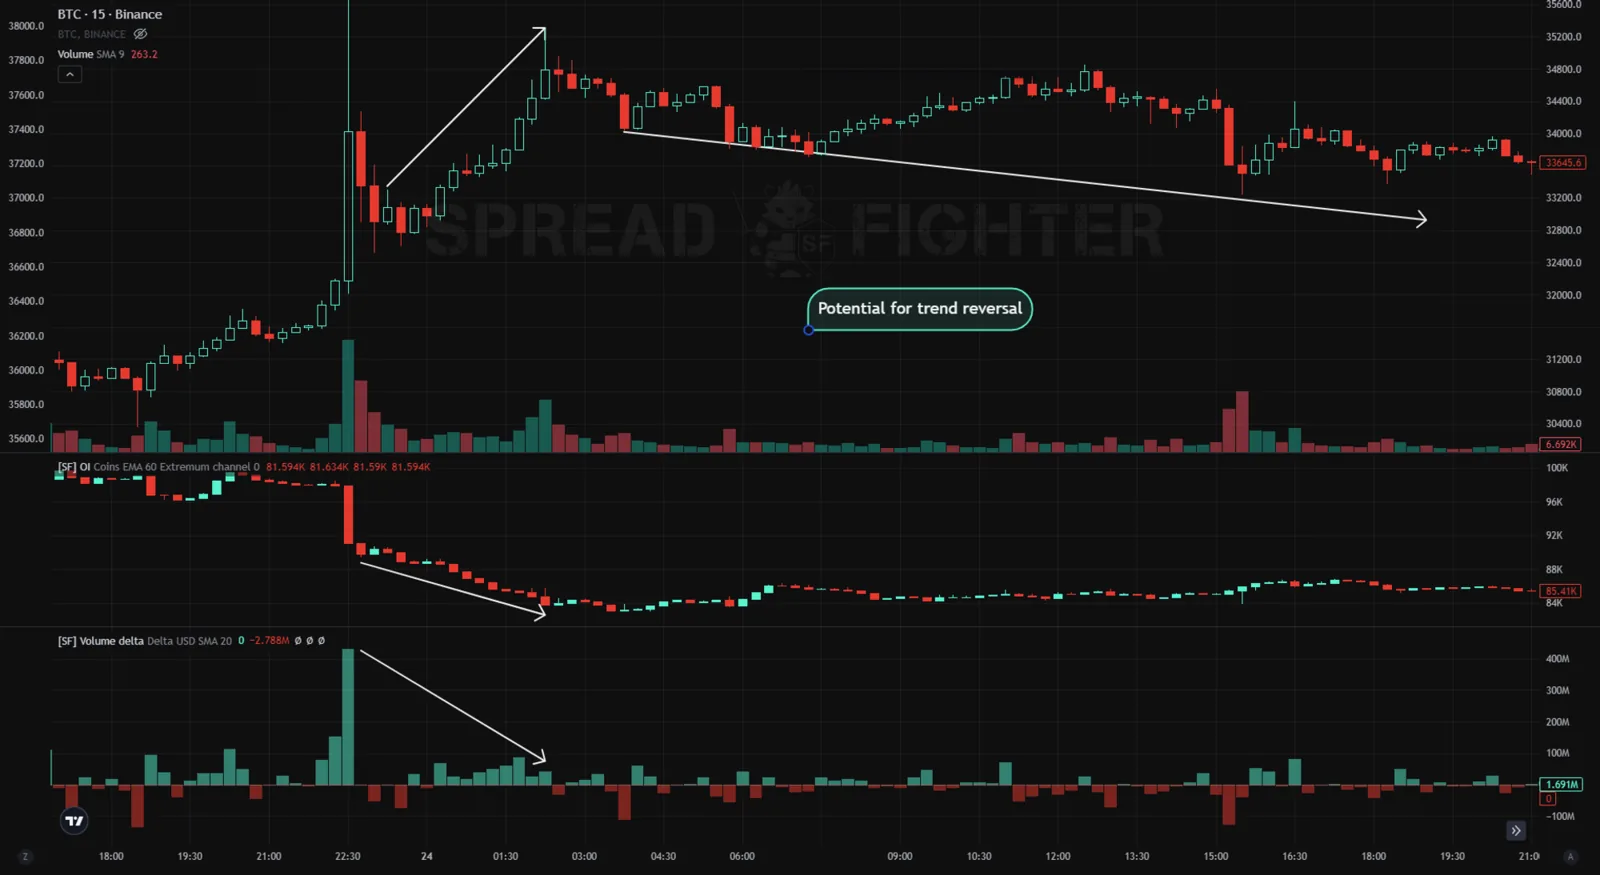
Formation of a potential trend reversal by OI and Delta as buys are closed.
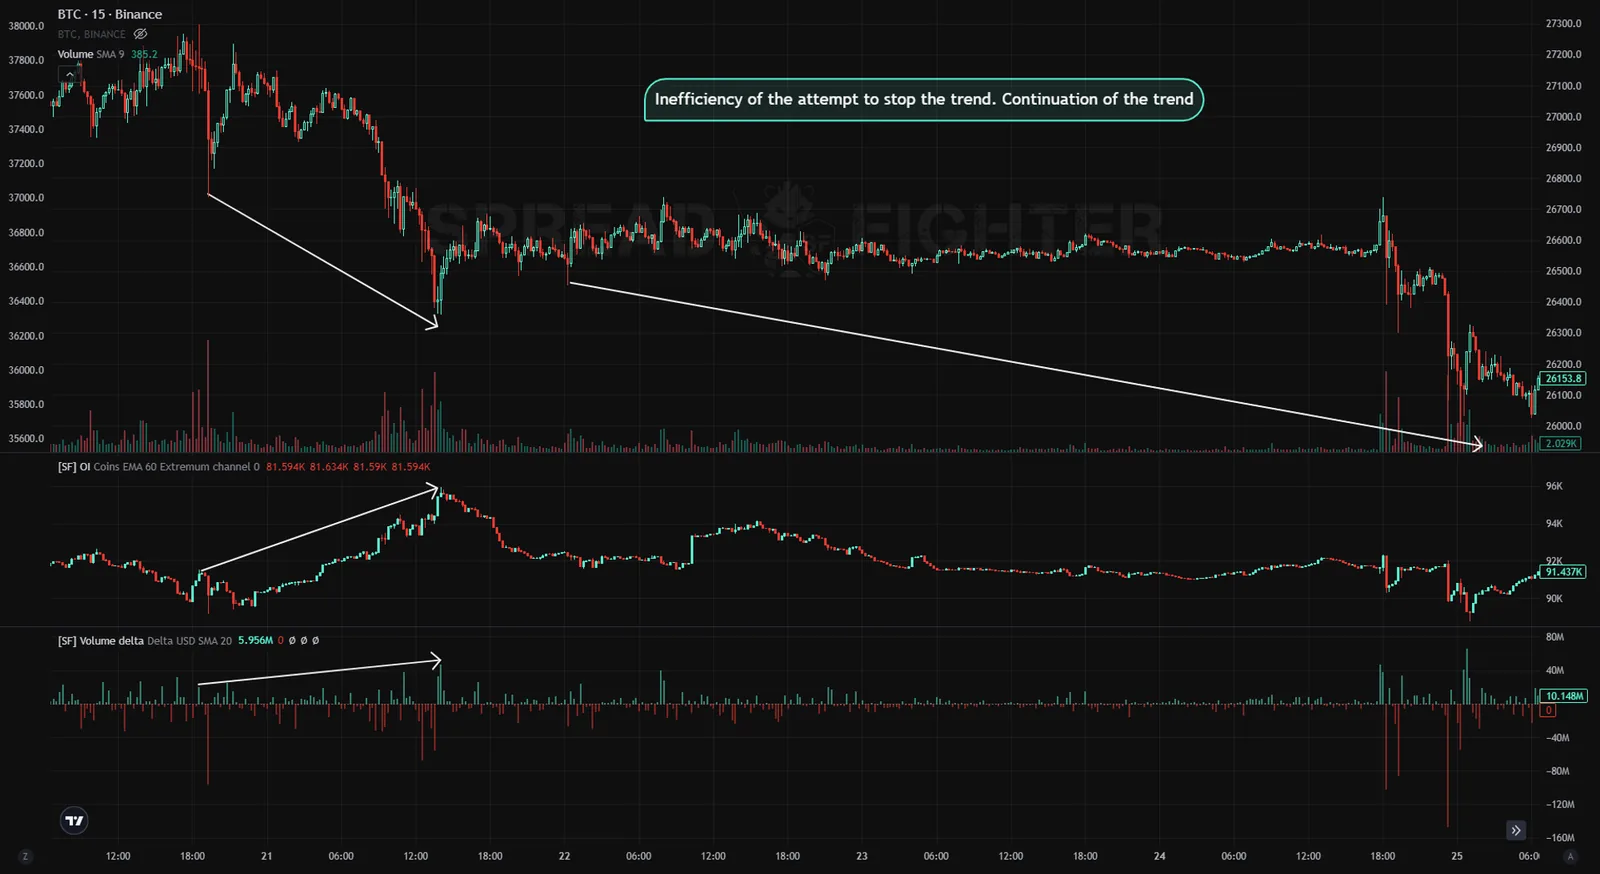
Retail traders' attempts to buy the dip failed. The downtrend continued.
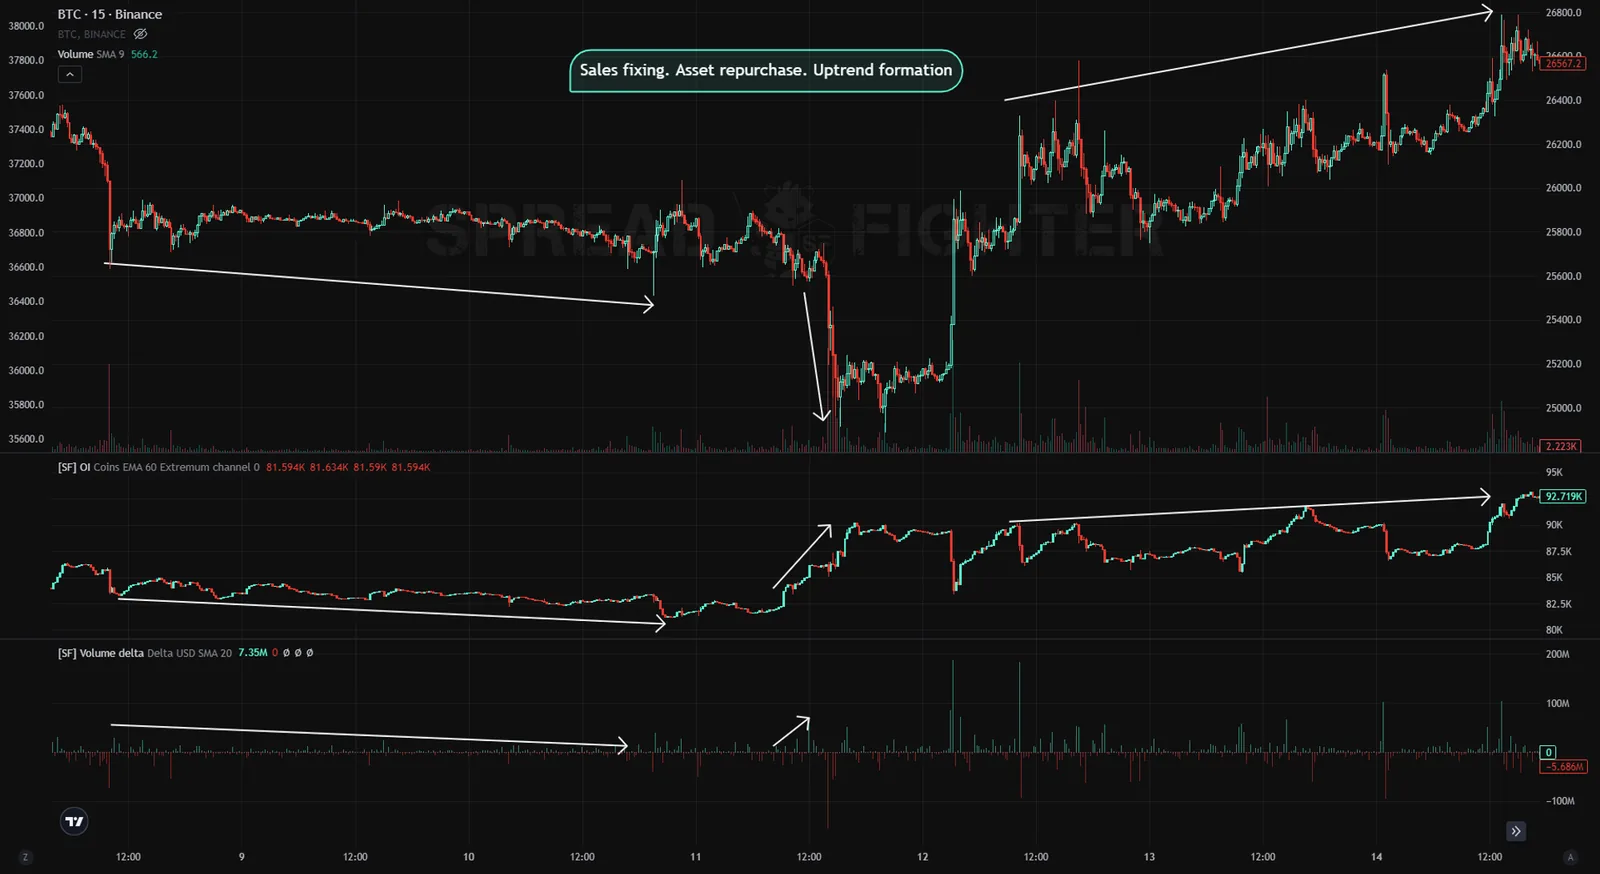
Closing of short positions and the following buyback of the "finishing move" led to an uptrend.
If, after a significant price move, there is no significant increase or decrease in open orders, this points to consolidation of the current trend, which may lead to a market reversal or sideways movement. A sharp spike or drop in open orders points to higher market volatility in the near future.
When most retail buyers are too optimistic, open interest rises, and behind that rise hides a further price drop meant to shake out the overly optimistic players. A drop in the number of optimistic traders leads to lower open interest, after which the price starts a new growth cycle, leaving most of them without profit.
Let's look at some cases of retail traders being "shaken out".
We will analyze OI together with Delta. We are interested in moments of Open interest spikes, both positive and negative (OI Delta), namely combinations of their abnormal values. So instead of the OI indicator, we add the OI Delta indicator to the chart.
Note that this analysis is not a standalone method. It must take into account the current state of the macrostructure to avoid false reversal signals. That is, when you find reversal patterns in Delta and OI Delta on a lower timeframe, you need to check whether there are support or resistance levels from a higher timeframe at that price level. Recommended timeframes are from 15 minutes to 4 hours. On smaller timeframes there is too much "noise" and too many false combinations.
We will look for the following reversal patterns:
- Delta positive & OI Delta rising = Market buyers are building positions
- Delta positive & OI Delta falling = Market buyers are taking profit on positions
- Delta negative & OI Delta rising = Market sellers are building positions
- Delta negative & OI Delta falling = Market sellers are taking profit on positions
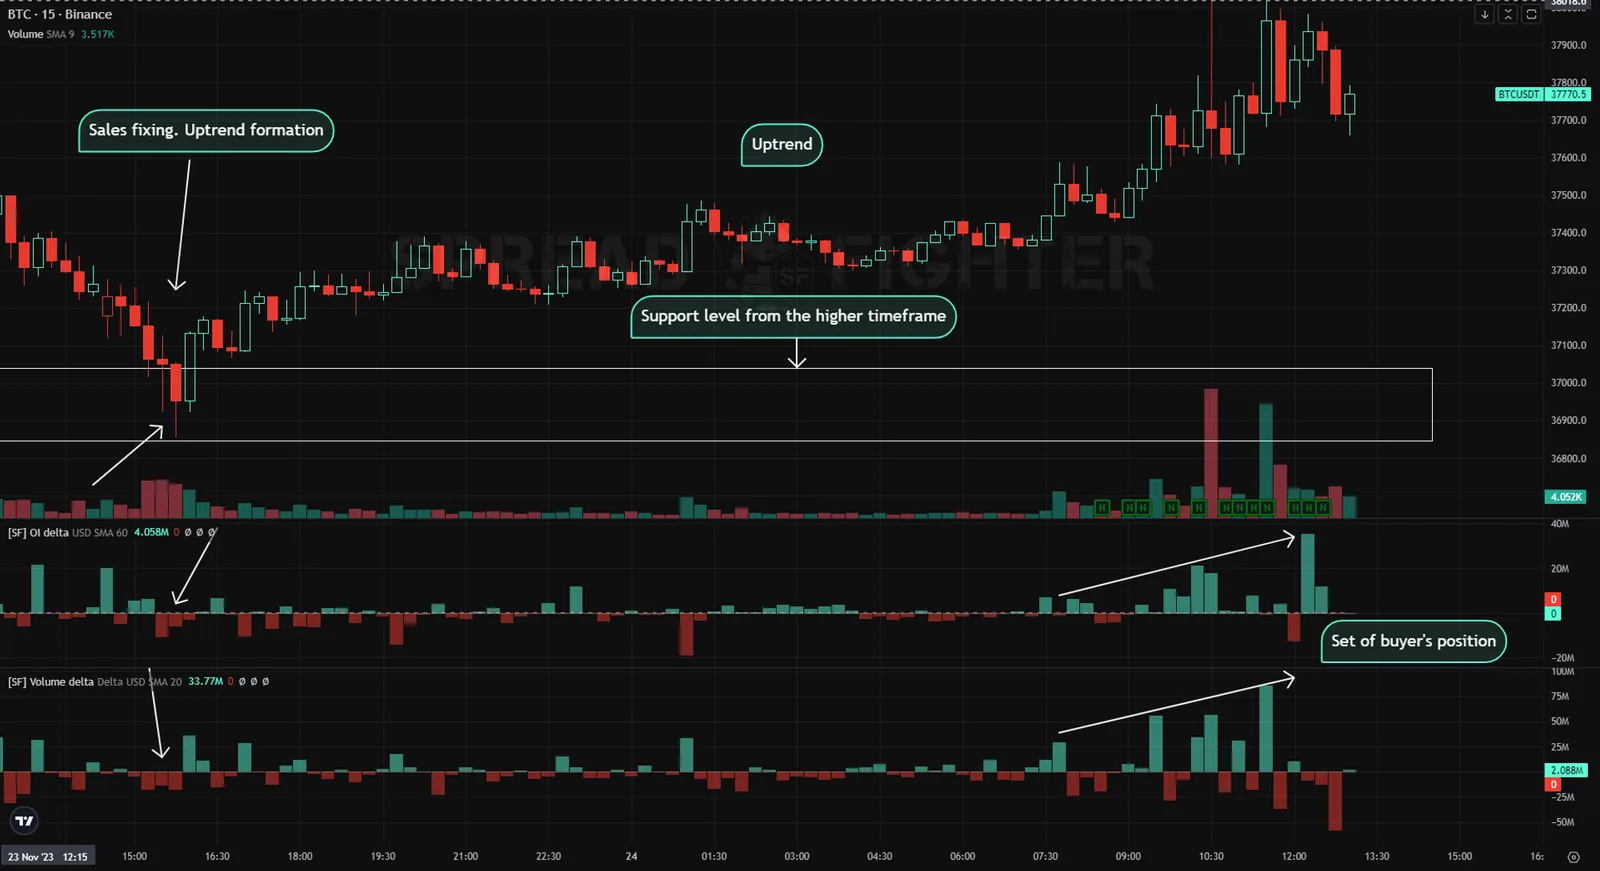
A market buyer builds a position after sellers took profit.
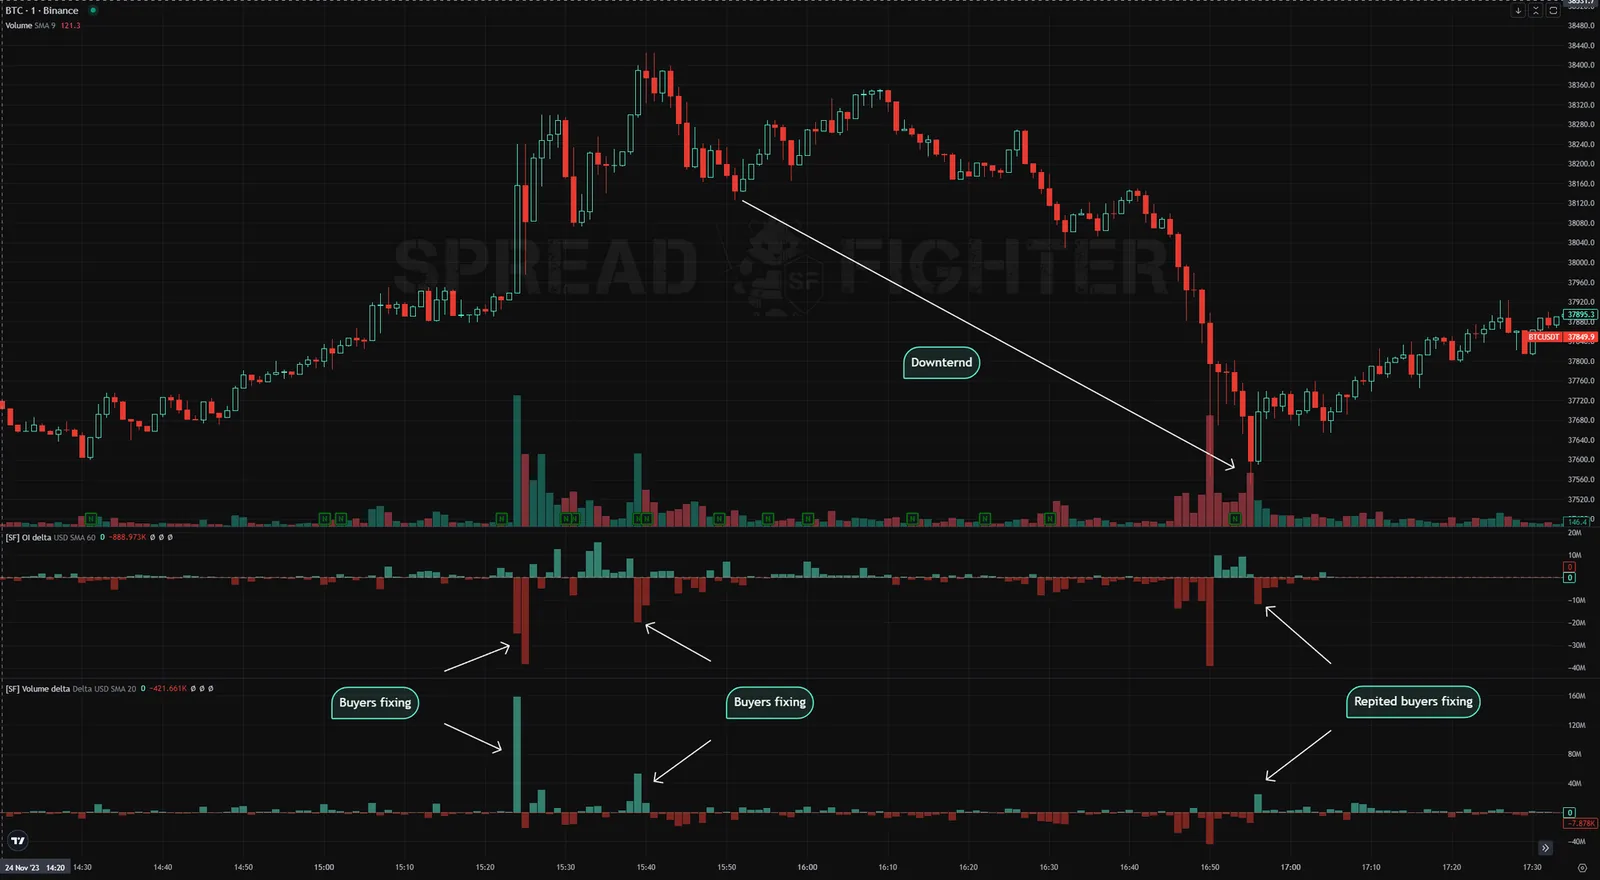
Closing of buys leads to a downtrend.
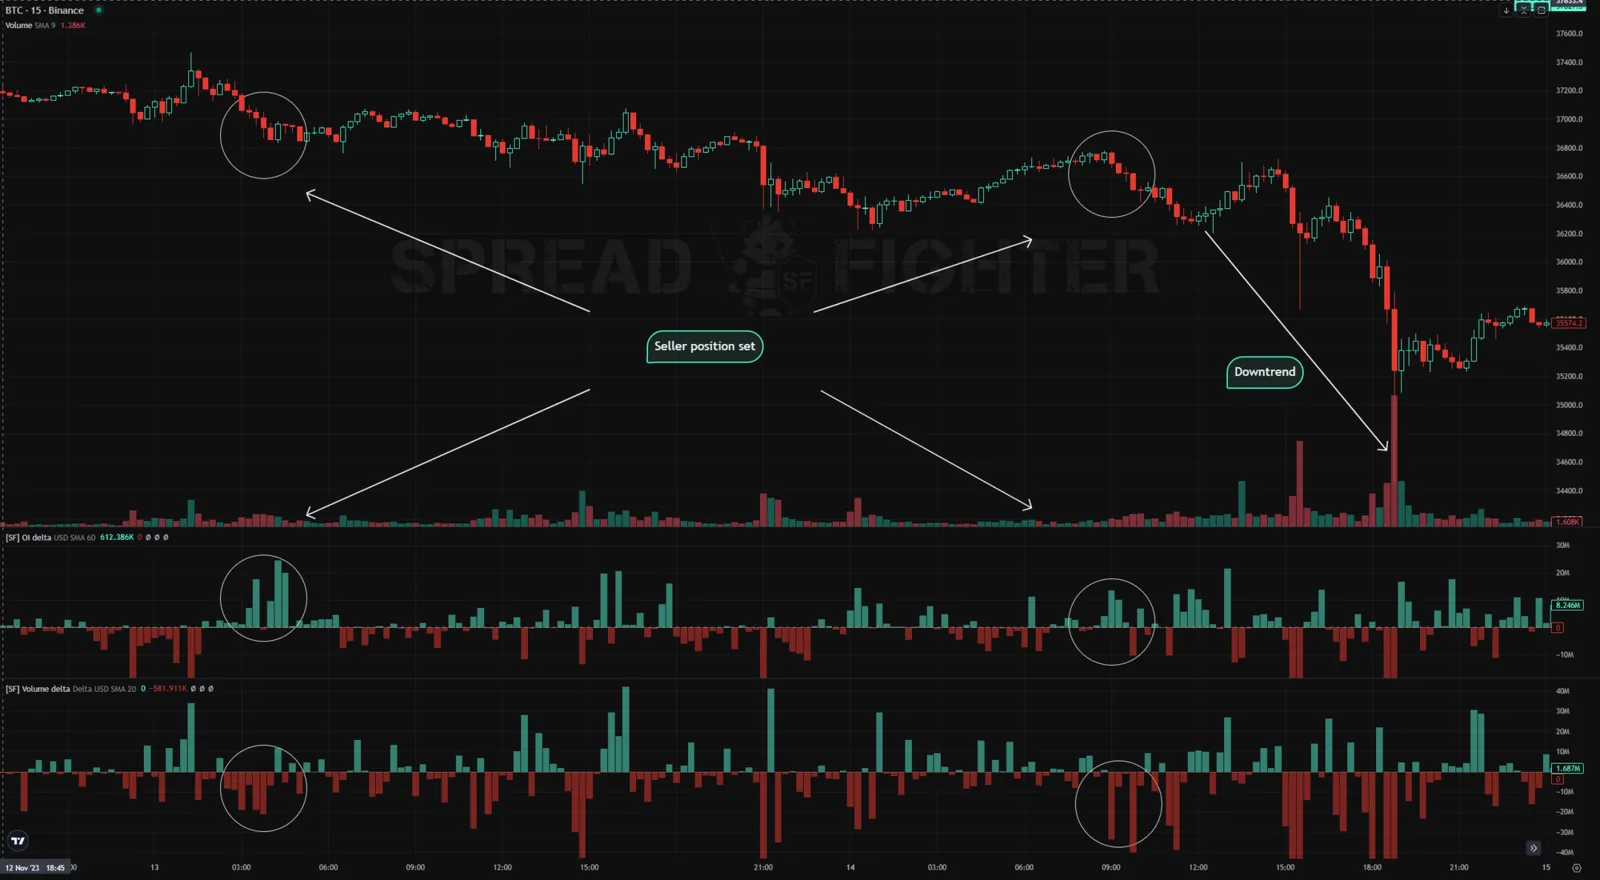
A market seller builds a position.
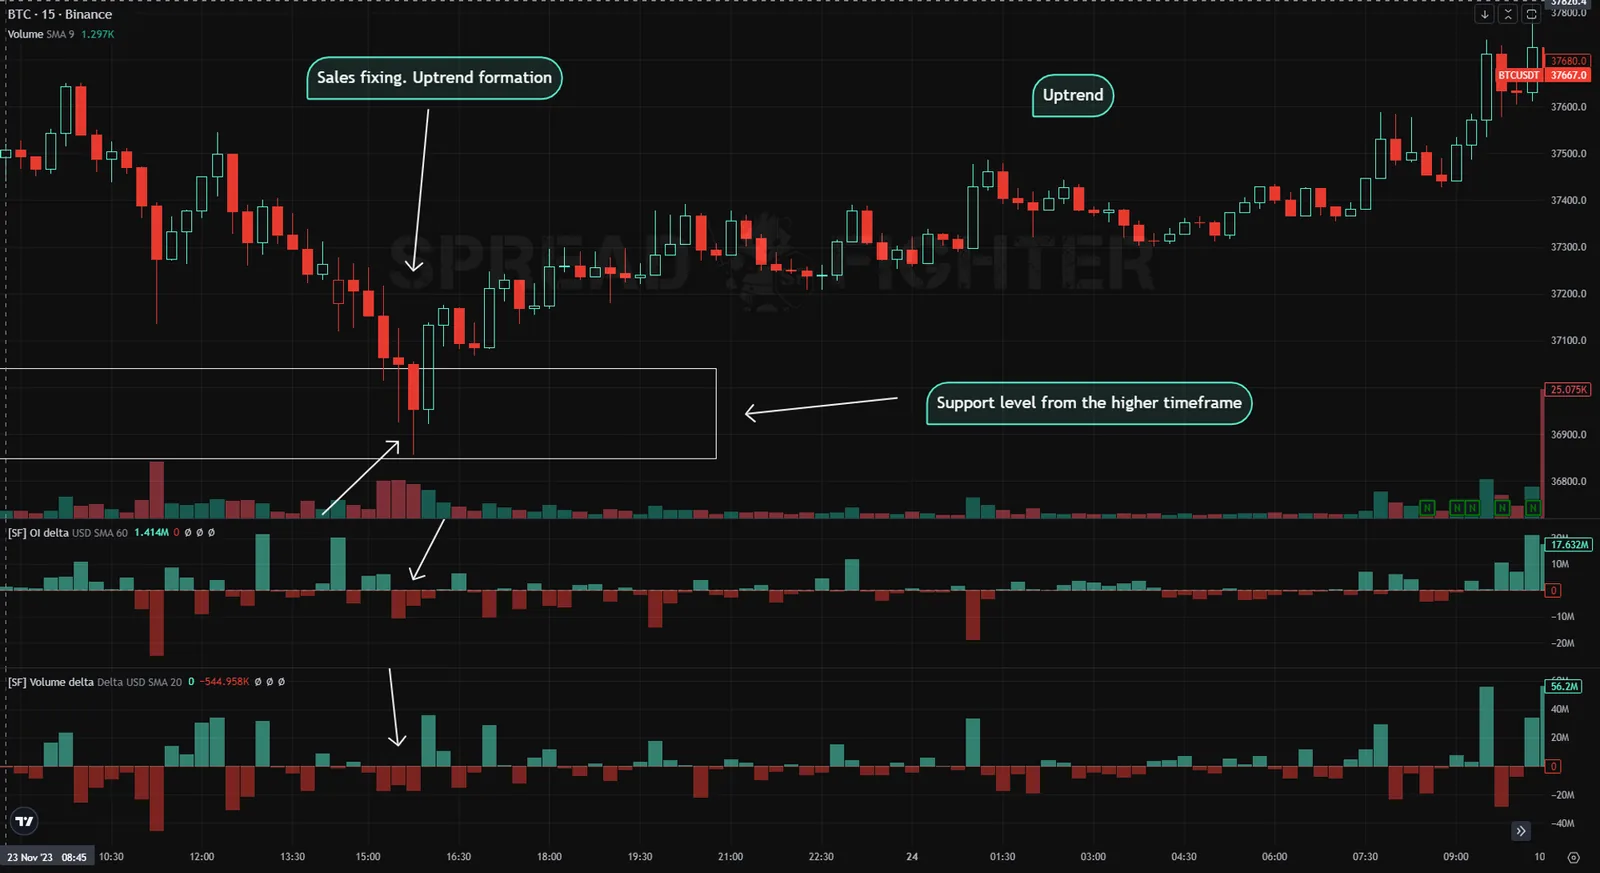
Closing of sells leads to an uptrend.
So, by analyzing reversal points in OI Delta and Delta on a lower timeframe, and taking the macrostructure into account, you can find a good entry point with a winrate for a higher timeframe.