Orderflow Light
A footprint without numbers on a regular chart: a volume heat strip next to the candle, POC, Value Area, imbalances, stacked imbalances and unfinished auctions. Readable at any zoom.
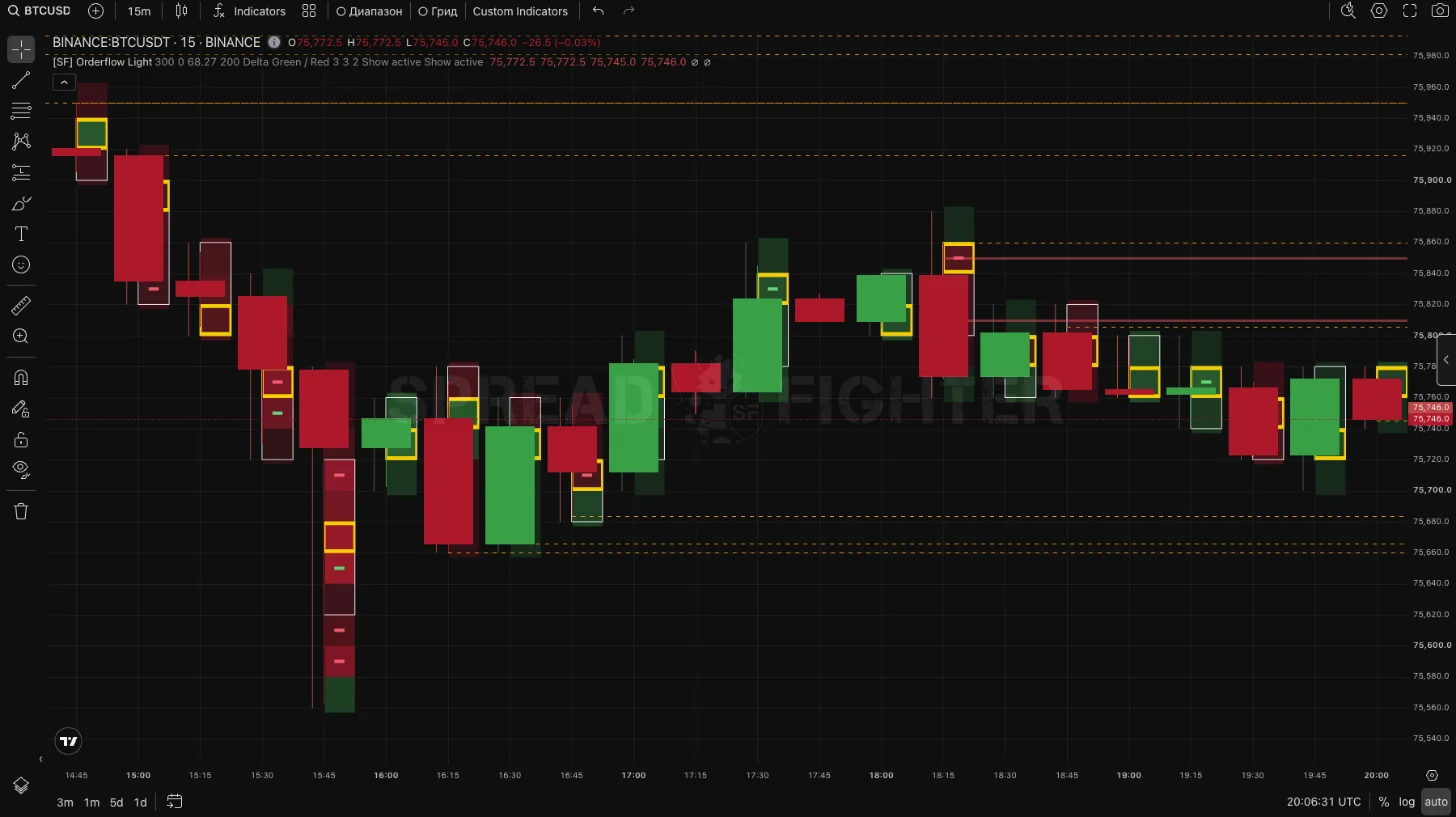
Orderflow Light on a 15-minute BTCUSDT chart: a volume strip to the right of the candle body, yellow frame — POC, white — Value Area, small bricks — imbalances, lines to the right — stacked imbalances and unfinished auctions.
What it is
Orderflow Light is an indicator on the price pane. It uses the same data and the same rules as the footprint, but draws them without numbers. Footprint numbers have to be read up close. Orderflow Light shows the main things — where the volume traded inside the bar, where the POC and Value Area are, where the imbalances are — so that they are visible even on a zoomed-out chart.
Available on the Pro plan and above. Find it: Indicators → search "Orderflow Light".
What is drawn
| Element | Meaning |
|---|---|
| Candle | The regular chart candle, without a border |
| Heat strip | Bar rows to the right of the candle centre. Colour and brightness follow the Strip color setting |
| White frame | Value Area of the bar |
| Yellow frame | POC — the row with the largest volume |
| Small brick | Diagonal imbalance, in the colour of the side |
| Large brick | Zero print: the other side did not trade on this row at all |
| Semi-transparent line to the right | Stacked imbalance: from each row of the stack until price returns |
| Orange dashed line to the right | Unfinished auction: both sides traded at the extreme level of the bar |
Rows do not depend on zoom: POC and Value Area do not jump when you move or scale the chart.
Settings
| Parameter | Default | What it does |
|---|---|---|
| Bars | 300 | For how many last bars to draw the strip, frames and lines (up to 500). The candle and wick are drawn for all bars |
| Row size, ticks | 0 | Row height in price ticks. 0 means auto: the median bar range split into 15 rows |
| Value Area, % | 68.27 | The share of bar volume in the Value Area |
| Intensity, bars | 200 | Brightness scale: the 95th percentile of rows over this many last bars. 1 means each bar has its own scale |
| Strip color | Delta | Delta — row colour by the side that is larger in it, brightness by row volume. Volume — all rows of the bar in the colour of the bar delta side, brightness by volume |
| Colors | Green / Red | Candle colour scheme |
| Value Area box, POC box | on | Value Area and POC frames |
| Imbalances | on | Imbalance bricks |
| Zero prints | on | Large bricks where the other side did not trade |
| Ratio | 3 | How many times one side must be larger than the other, diagonally, to count as an imbalance |
| Stack, rows | 3 | How many imbalances of one side in a row make a stack |
| Gap, rows | 2 | How many rows without an imbalance can be inside a stack |
| Gaps count | off | Gap rows also count toward the stack length |
| Stacked imbalances | Show active | Stack lines: Show active — only those price has not returned to; Show all — also the tested ones; Do not show |
| Unfinished auctions | Show active | Unfinished auction lines, same modes |
Line thickness and colour for stacks and auctions are changed in the Style tab of the indicator settings.
Orderflow Light and the footprint do not interfere with each other: on lower timeframes it is handy to use the footprint with numbers, on higher ones — Orderflow Light.