Predict Liquidations Chart, Liquidations Balance, Predict Liquidations Screener & DOM
An advanced model that predicts, with high accuracy, the levels where pending orders cluster.
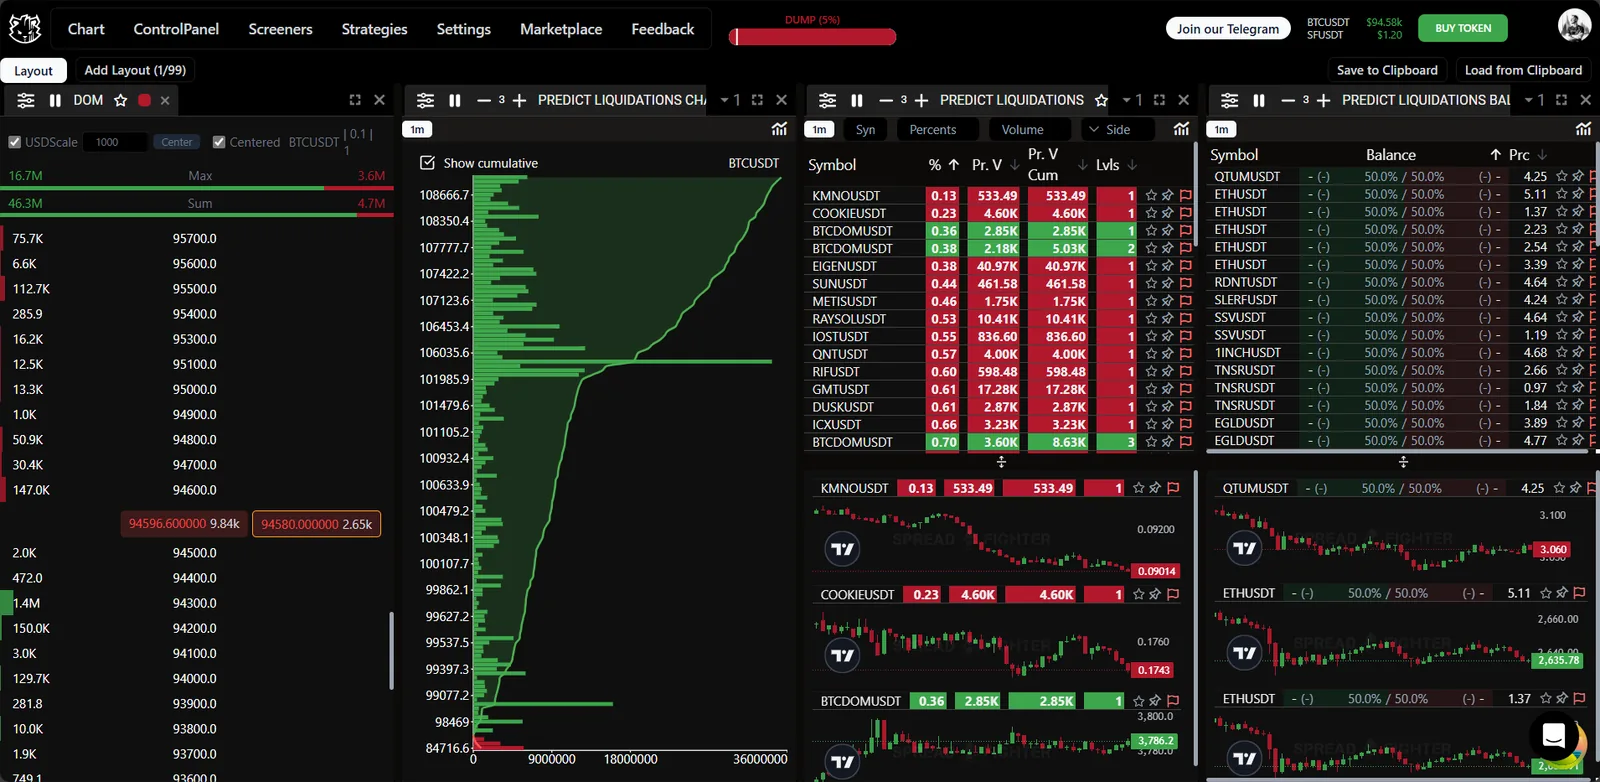
Model widget appearance.
Predict Liquidations Model Description
One feature of the derivatives market is the ability to open leveraged or margin positions. Every such margin position has a liquidation price. As soon as the price of the underlying asset reaches the liquidation price, the exchange forcibly closes the trader's position at a loss, to keep the client's balance from going negative.
Single liquidations are of no interest, because their impact on the market is negligible. However, a cluster of such orders can significantly affect the price and trigger a volatility spike. A cluster of pending orders is also called a margin zone.
Ordinary users have no access to information about them. Data at this level is available only to exchanges (and, as a rule, to some persons affiliated with them who run trading activity related to the exchange's crypto assets). Modern quantitative models in market microstructure make it possible to calculate margin zones with fairly high accuracy.
Based on data analyzed with a dynamic neural network, we identified patterns in how margin zones are placed, taking into account the behavior of the specific asset. We built a corresponding model that shows the clusters of pending orders.
An important part of our calculation algorithm is data decay, which lets it neutralize "stuck" clusters.
Model Location
To add the "Predict Liquidations" tool to your workspace, first click the "Widget menu" button in the platform header. Then click the button of the same name in the "Microstructure" section.
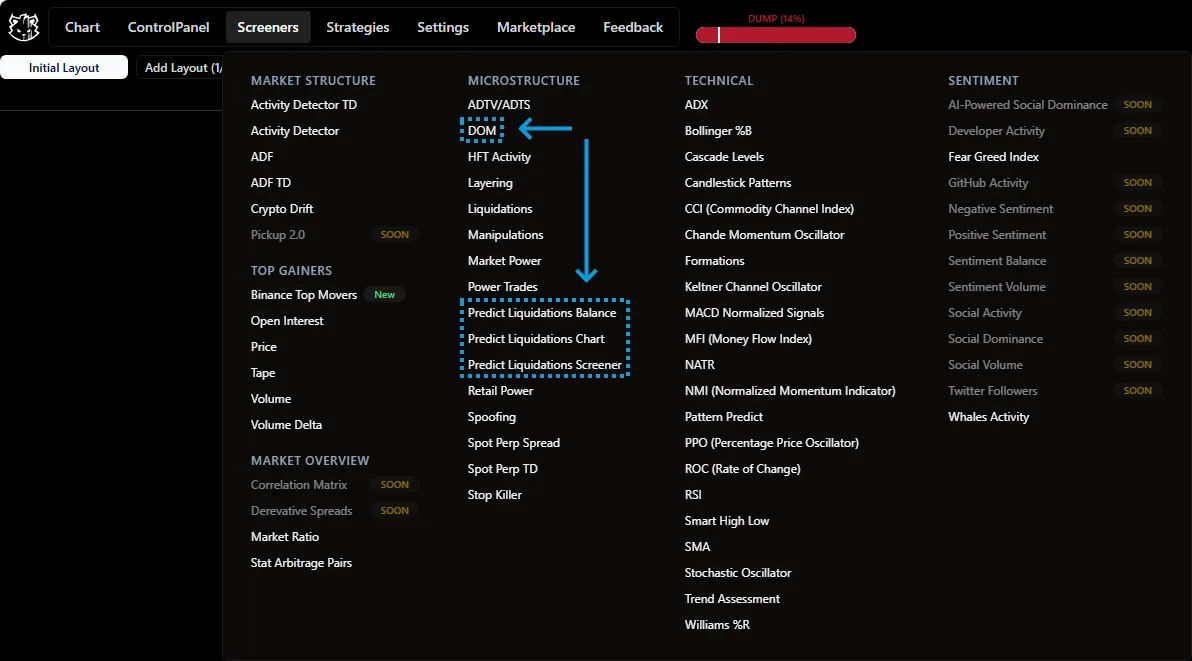
Tool Functionality
Predict Liquidations Chart
The widget is a histogram in which:
- Green shows the pending orders of holders of short positions.
- Red shows the pending orders of holders of long positions.
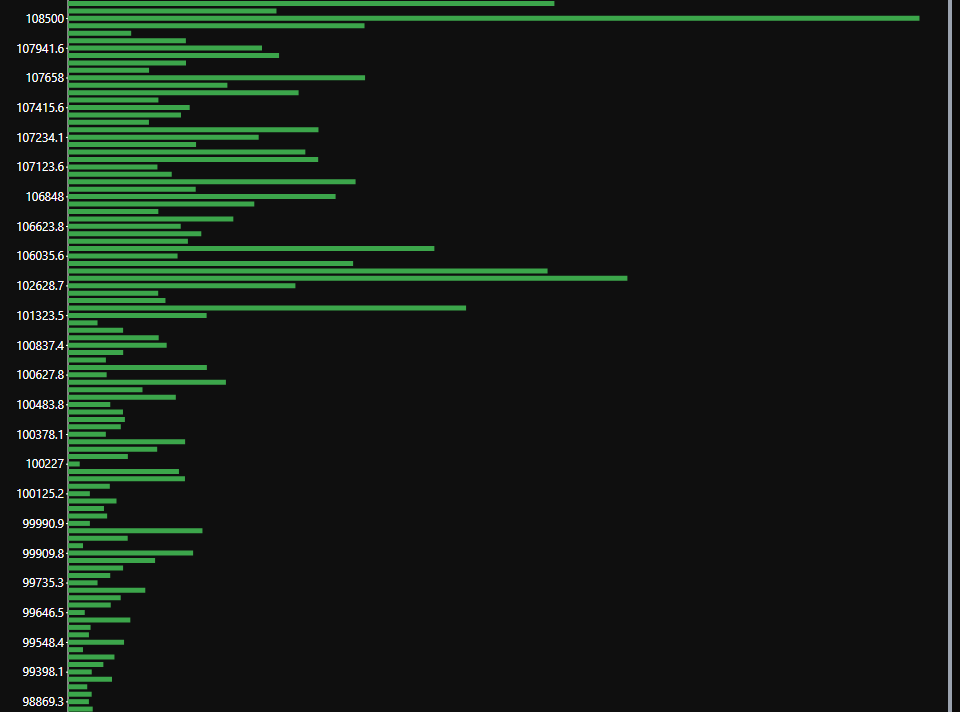
Predicted location and volume of pending orders for SHORT positions.

Predicted location and volume of pending orders for LONG positions.
At the bottom of the tool is the scale of the volume of the predicted pending-order levels, in dollars.

Volume scale.
Clicking the "Show Cumulative" button shows the cumulative sum of the pending order volume.
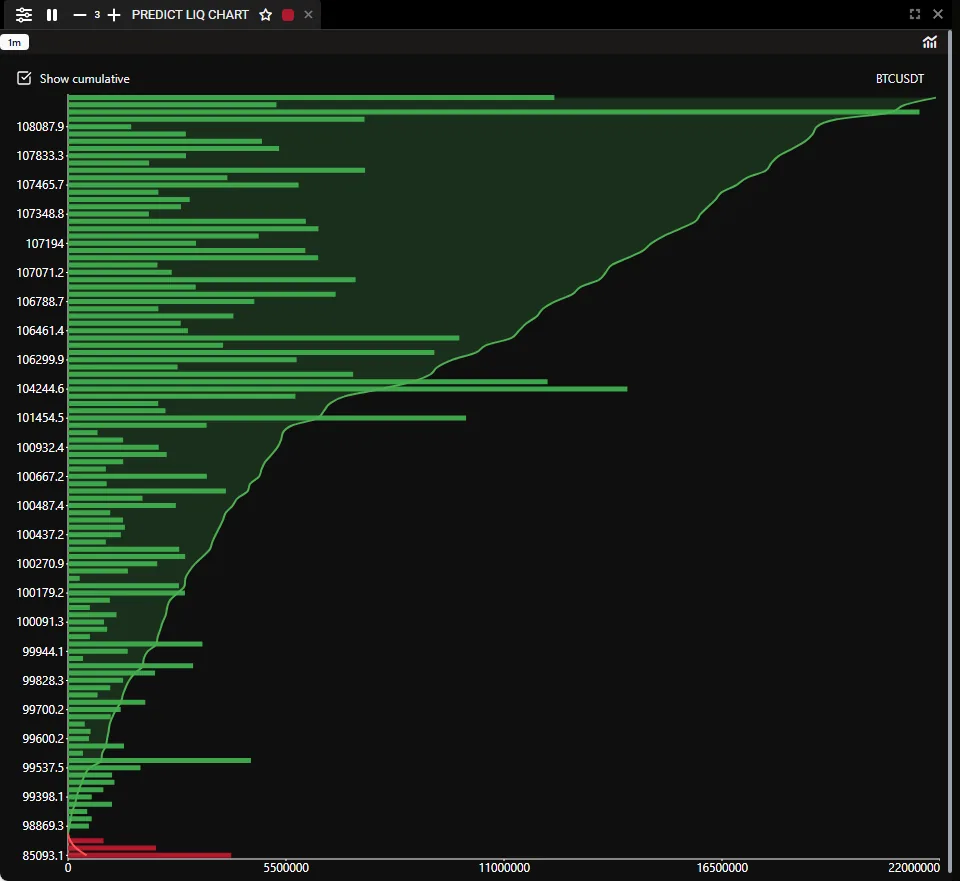
Cumulative sum of pending orders.
When you hover the cursor over a specific order, a pop-up window shows more detail about the price level and the volume of potential liquidations in dollars.

Detailed information.
At the top of the tool there is a search window for switching to a specific ticker.
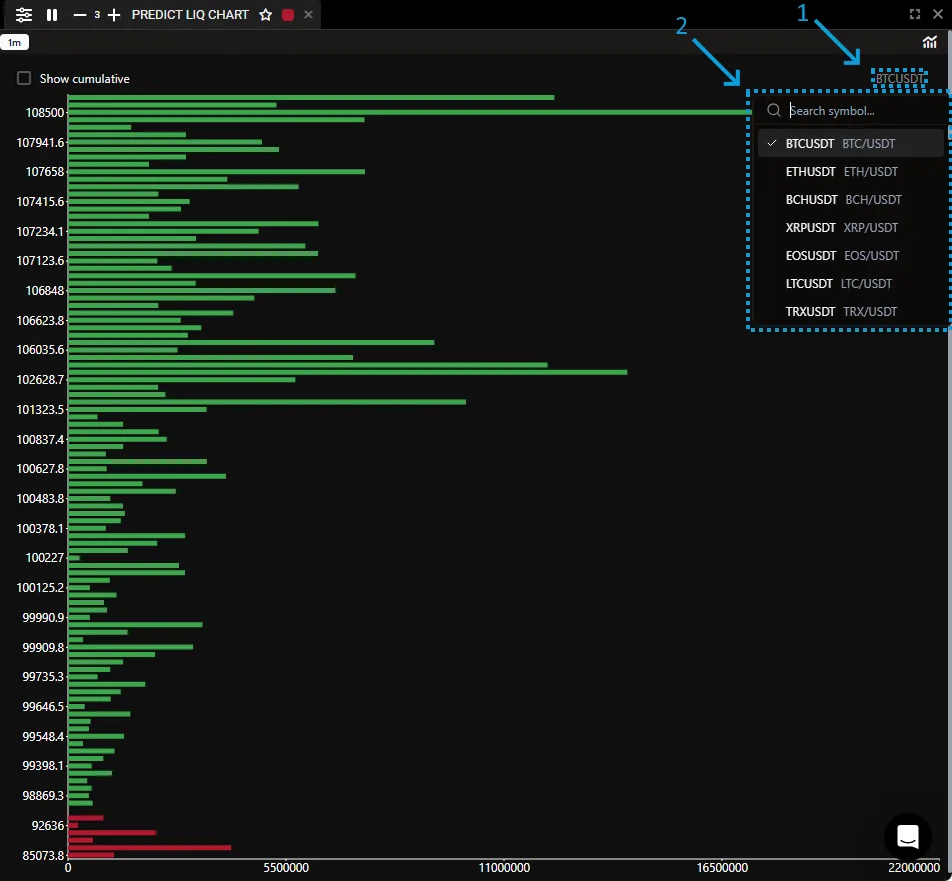
Symbol search window.
Predict Liquidations DOM
The widget is an order book that aggregates limit orders and predicted pending orders.
- Red marks limit sell orders (ask) and pending sell orders (liquidations and stop-loss orders for LONG positions).
- Green marks limit buy orders (bid) and pending buy orders (liquidations and stop-loss orders for SHORT positions).
- Orange marks limit orders of maximum volume.
- The trade tape is in the center.
The volume of limit orders is along the left edge. The price level is in the center. The volume of pending orders is along the right edge.
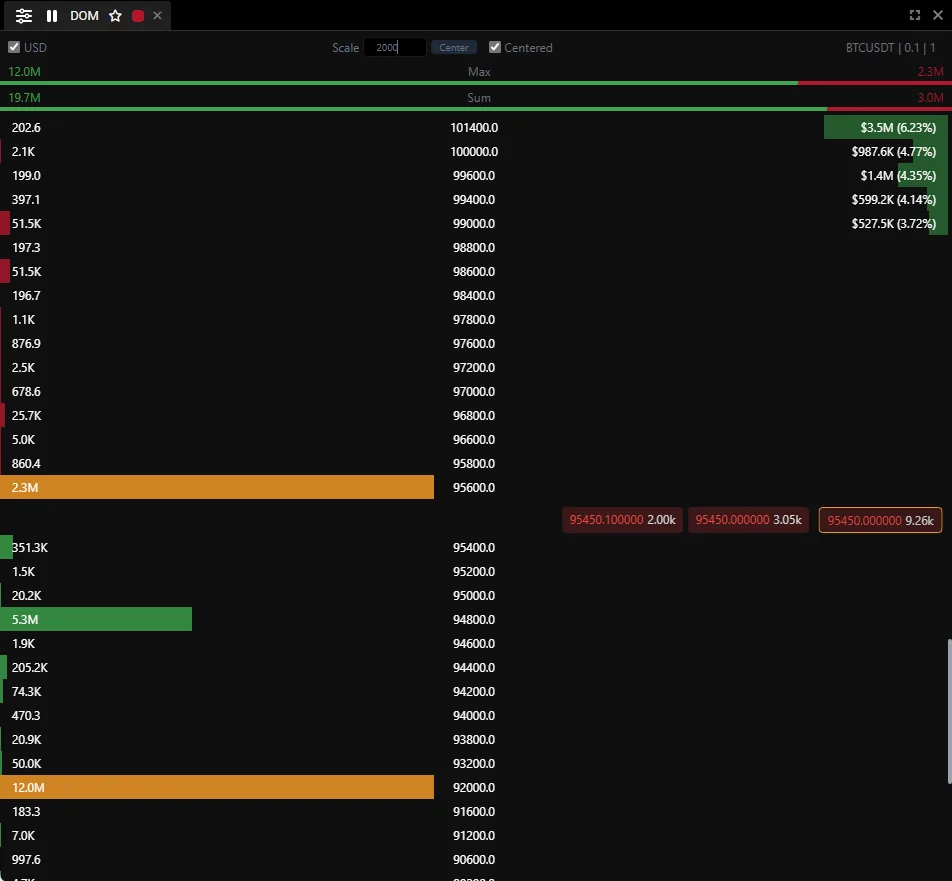
Widget appearance.
The widget header contains:
- "USD" - a marker; when you click it, order volume is shown in dollars.
- "Scale" - the order book compression value.
- "Centered" - centering the order book.
- "Symbol" - a search window for choosing the asset.
- "Max" - an imbalance chart of the maximum limit order size. That is, the ratio of the volumes of the largest and smallest orders in the book.
- "Cum" - a depth imbalance chart. That is, the ratio of the sums of buy and sell orders in the book.

Widget header.
In the widget settings you can switch the calculation method to depth mode.

Switching to depth mode.
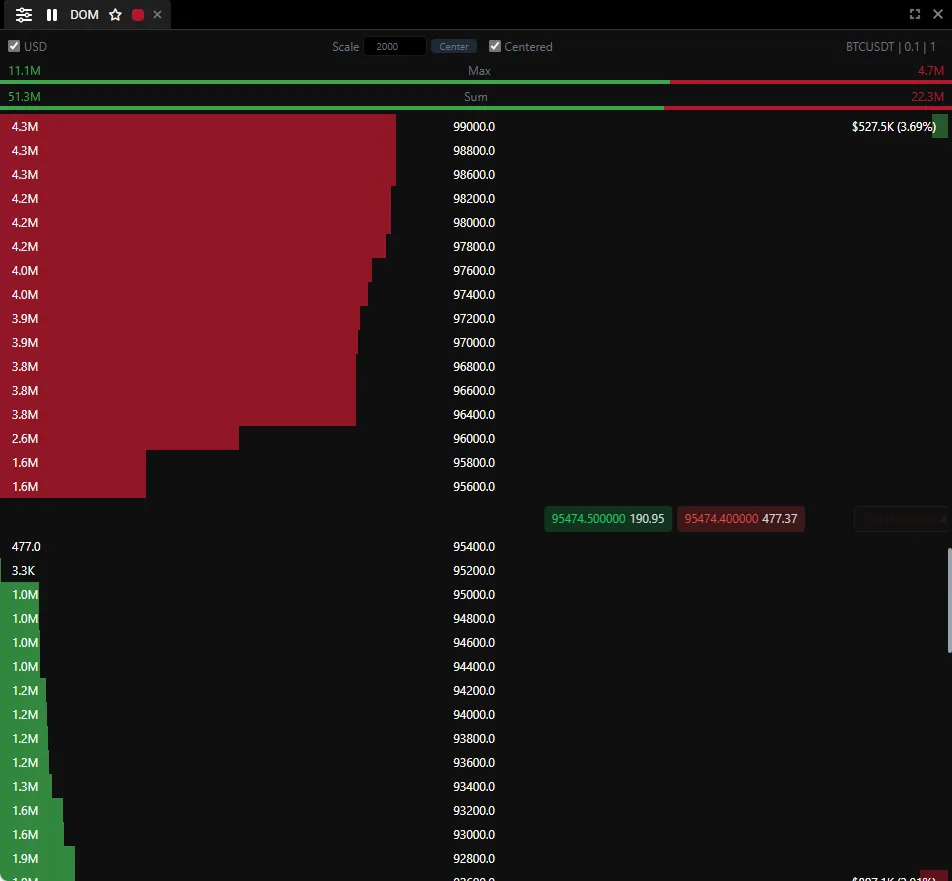
Depth mode.
Predict Liquidations Balance
The widget calculates the ratio of pending liquidity volume for the LONG and SHORT sides and shows the assets with the largest imbalance. That is, the symbols that have a pronounced imbalance on one side in the volume of predicted liquidations.
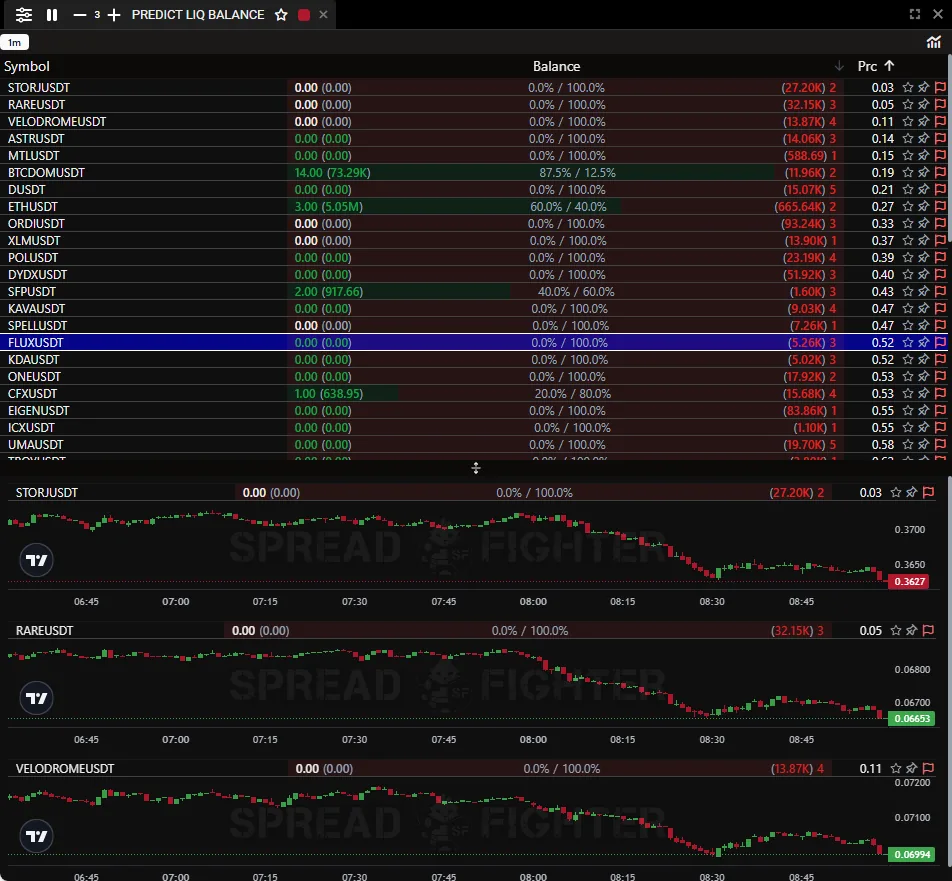
Widget appearance.
Predict Liquidations Screener
The widget notifies the user when the price of an asset is approaching a level where pending orders cluster. The user can sort and filter incoming signals by the following metrics:
- "Percent" - the distance in percent from the current asset price to the pending order.
- "Volume" - the volume of the pending order.
- "Side" - the side of the pending order (LONG or SHORT).
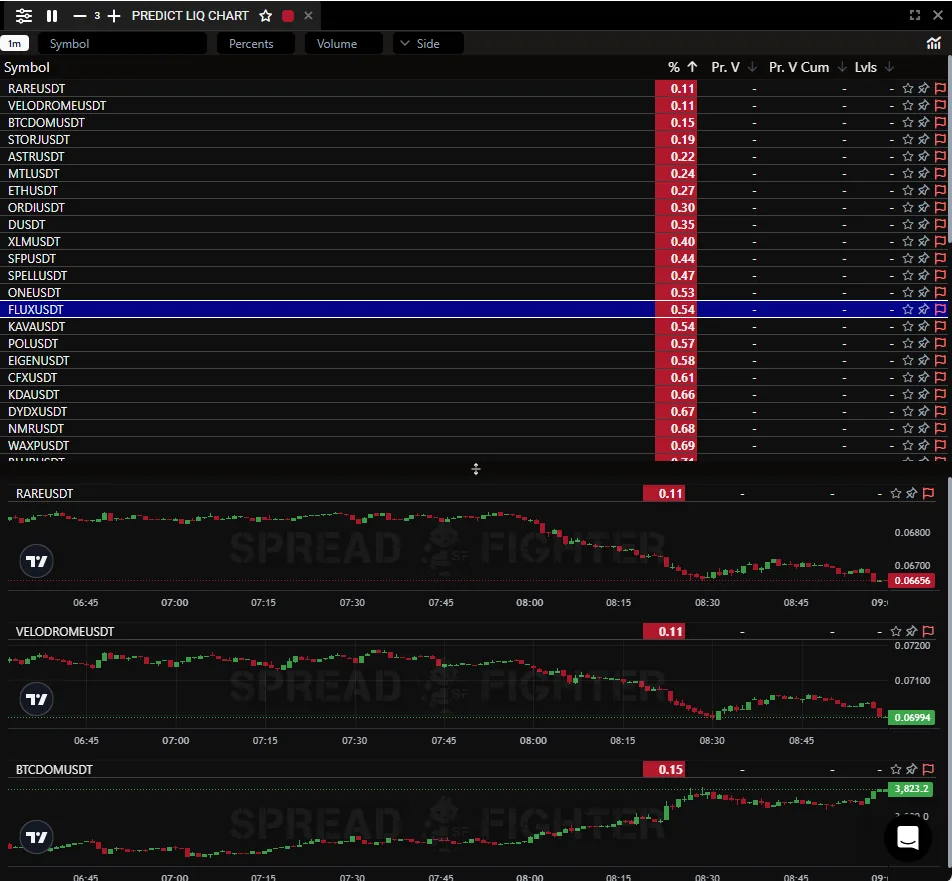
Widget appearance.
Use Cases
Prices are different for large participants. So knowing where liquidity sits in the market is extremely valuable information for large market participants.
It is also important to note that exchanges charge additional penalty fees on liquidations (the funds are usually redistributed to insurance funds, etc.).
As is well known, the market moves to liquidity. Accordingly, a cluster of pending orders is a point of attraction for price, because margin zones are points where volume concentrates.
We can suggest the following ways to use it:
- Directional trading. Prices often gravitate toward liquidity clusters. Identifying these zones can help you assess potential price movement in combination with other tools.
- Finding reversal points. Often prices reverse after pending orders are executed.
- Risk management. With Predict Liquidations a trader can place stop-loss and take-profit orders more precisely, avoid false breakouts and take profit at the most favorable prices.
- Solving the liquidity problem. Traders with significant capital can use predicted pending orders as a source of liquidity to open and close their positions, thereby avoiding significant inventory risk.
- Volatility trading. Predict Liquidations makes volatility forecasts more precise through a more accurate estimate of market depth. The simplest example is buying an option with a strike in front of a margin zone cluster.