Spoofing, Layering
Highlights toxic activity in the order book. Layering shows coins where one side of the book is several times thicker than the other and how long this lasts. Spoofing shows the largest order near price — a "wall" that people trade from.
Updated 27 Sep 2026. Both models were rebuilt. Layering again keeps a coin in the screener while the skew lasts, instead of flickering. The screener has new Skew 10% and Lifetime columns. Spoofing again draws the wall line on the chart — before the update it almost never fired. Details are in the section "What changed on 27 Sep 2026".
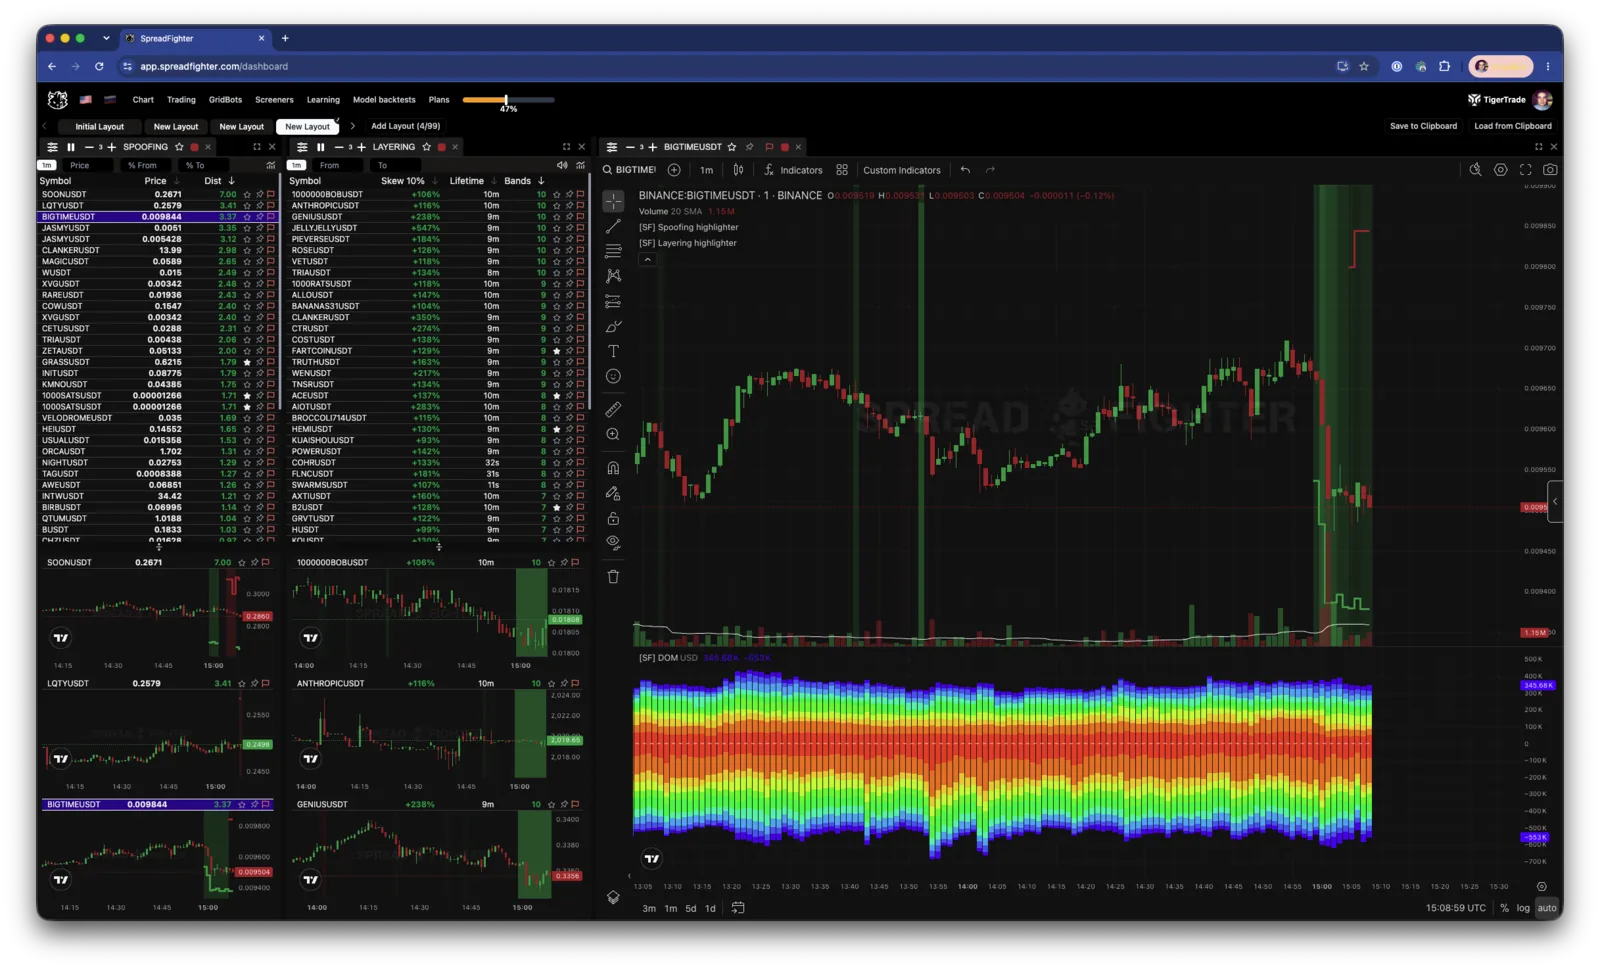
Model appearance.
Description
Spoofing in trading is a strategy where a trader creates a false impression of an upcoming price move by placing large buy or sell orders that are then quickly canceled before execution. The aim of spoofing is to create fake signals about trading volumes and market direction that do not exist, to manipulate prices and lure other market participants into trades.
The model finds the price and size of a limit order that it recognized as spoofing.
https://en.wikipedia.org/wiki/Spoofing_(finance)
Layering in trading is a technique of manipulating market prices where traders create artificial trading volume by placing a group of large buy or sell orders and then successively changing or canceling them. The aim of layering is to create a false impression of real demand or supply in the market. This can move the asset price in the desired direction and bring a profit.
https://en.wikipedia.org/wiki/Layering_(finance)
Such practices can be illegal and are subject to oversight by market regulators.
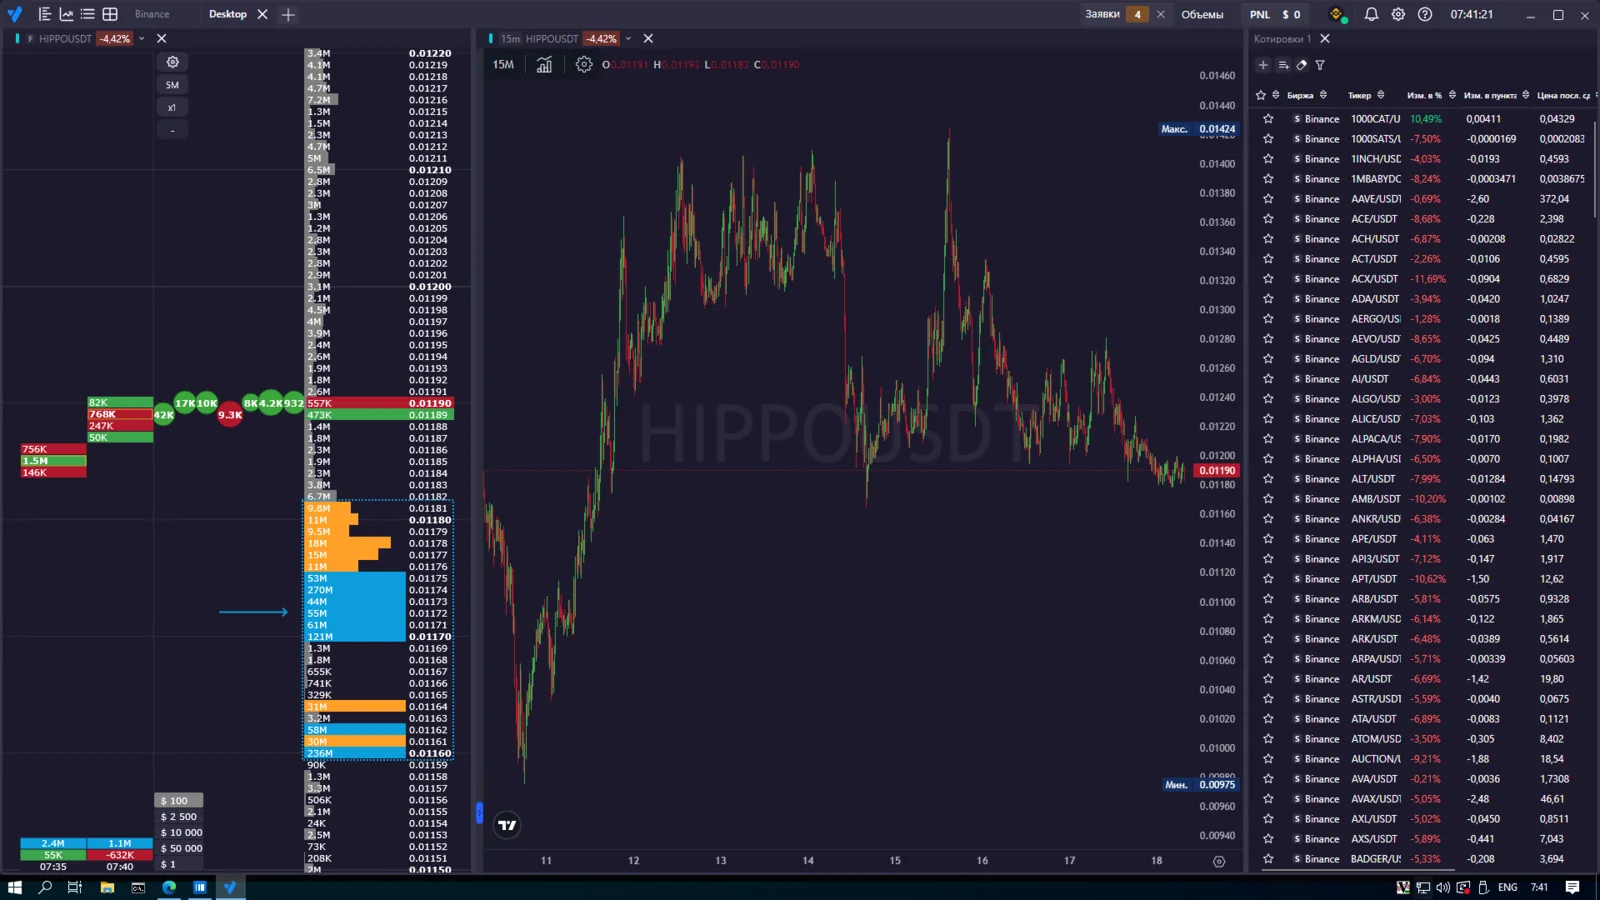
Layering on a futures contract.
How Layering works
Once a second, the server calculates, for each coin, the sums of orders in the book in ten bands from the best price: within 1%, 2% and so on up to 10%. Bids go from the best bid down, asks from the best ask up, with volume in coins.
A band counts as skewed if one side in it is at least twice as thick as the other. The model value (Bands, from −10 to +10) is the number of such bands:
- +10 — in all bands from 1% to 10%, bids are at least twice the asks. Maximum buyer pressure.
- −10 — the same for asks. Maximum seller pressure.
- +5 — only 5 of 10 bands are twice as thick: there is a skew, but weaker or only near price.
- 0 — no clear skew.
So that a coin does not flicker on every book fluctuation, the signal has hysteresis:
| Rule | Value |
|---|---|
| Signal turns on | 5 or more bands skewed to one side |
| Signal holds | while at least 3 bands are skewed to the same side |
| Drop below 3 bands | tolerated for up to a minute, then the signal is removed |
| The book flipped (5+ bands to the other side) | the old signal is removed, a new one starts with its own lifetime |
The model looks at the level of the skew, not at its sharp change: a coin stays in the screener while the skew holds — be it minutes or hours.
How Spoofing works
The model watches the single largest order in the book within 25% of the best price — separately on the bid and on the ask — and highlights it if both conditions are met:
- The order is large. Its size is at least 10% of all orders on the same side within 3% of price.
- The order is close. It sits closer to price than one standard deviation of the price over the last day (σ of minute-candle closes over 1,440 minutes). For a calm coin this is fractions of a percent, for a volatile one it is several percent.
The green line on the chart is the price of the bid wall below price, the red line is the ask wall above price. When the wall is moved, the line moves with a step. When the wall is removed or goes farther than σ, the line breaks.
The model sees a large order near price, but does not know whether it will be canceled. "Spoofing" here is a candidate: a wall that may turn out to be fake. The confirmation is its behavior when price approaches.
Spoofing on Hyperliquid
The Hyperliquid book is short: the exchange gives 20 exact levels per side. So the rule differs from Binance:
| Condition | Binance | Hyperliquid |
|---|---|---|
| Where the largest order is searched | the whole book within 25% of price | the exact book: 20 levels per side |
| Distance to price | closer than the daily σ of price | no separate condition: the exact book limits it by itself |
| Share of the order in its side of the book within 3% | turns on at 10%, holds until 7% | the same: 10% / 7% |
| Gaps in the condition | shorter than a minute do not break the line | the same |
Why there is no σ. Across 172 Hyperliquid markets, the exact book covers on average 0.23% of price, while the daily σ is 1.24%: it reaches σ in only 9% of markets. The aggregated book sees farther, but there a level is a bucket 0.1–1% of price wide, not an order. Such a "wall" would be noise.
What this means in practice:
- The model sees walls right next to price: for BTC about hundredths of a percent, for alts 0.1–1%. This is the market makers' zone. Far walls, like those 2–5% from price on Binance, are not visible on Hyperliquid.
- The wall price is exact — it is an exchange book level.
- Walls are found in about a quarter to a fifth of markets (around 60 of 330 per minute), including HIP-3 markets (stocks, indices).
- In the Spoofing feed, Hyperliquid rows are marked with the exchange icon. Exchanges are chosen in the filters window. On a Hyperliquid market chart, the Spoofing highlighter draws wall lines the same way as on Binance.
Tests
Check on the Binance order book history for September 2026 (per-minute book sums for ~700 coins).
Layering. The rule catches cases that traders marked by hand: LYN — a bid skew held for almost 9 hours in a row, Q — an ask skew for up to 2.8 hours, US — an ask skew on the morning of 27 Sep. There are usually about 100 coins in the screener at once. Half of the signals live longer than 10 minutes, and every tenth lives longer than an hour and a half. Signals shorter than two minutes are under 1%.
Spoofing. Over a two-hour window, about 180 coins meet the condition at least once. But most of the time 30–40 hold a wall, and almost all the time about 13 do. For such coins the line runs flat at one price or in steps behind a wall that is being moved.
This is a check that the models find skews and walls, not a profitability backtest. Whether price moves toward the skew or against the wall has not been measured yet. Do not use the signals as a standalone entry.
Location
To add the "Layering" and "Spoofing" tools to the workspace, first click the "Screeners" button in the platform header. Then click the button with the same name in the "Microstructure" section.
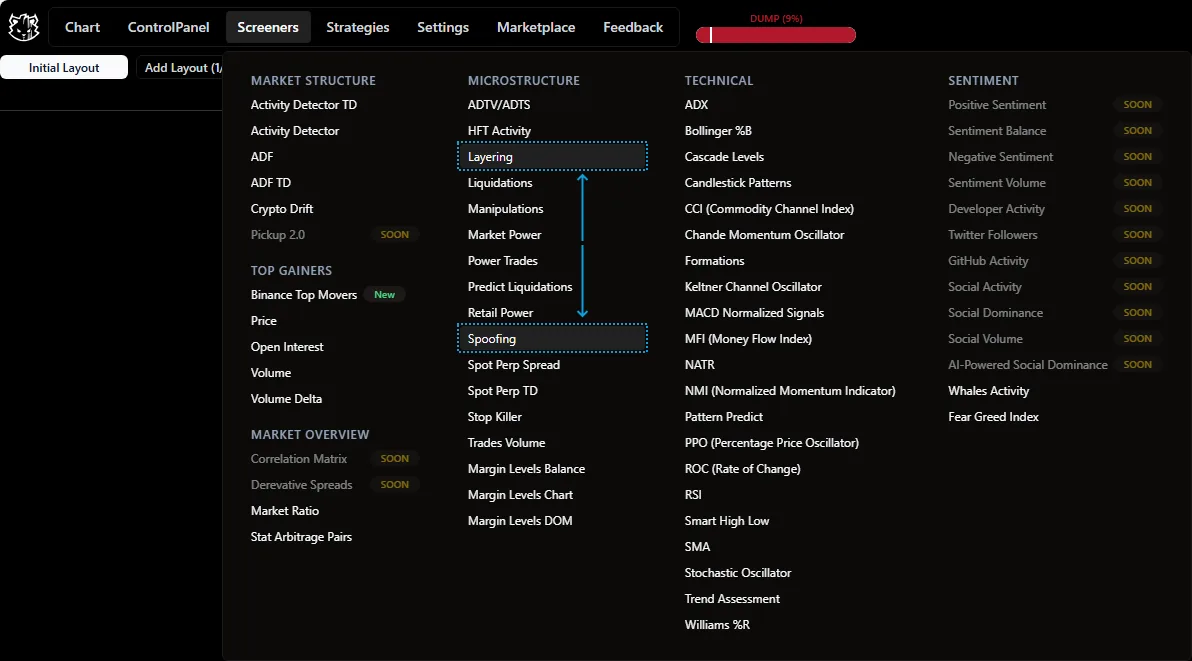
Widget location.
Functionality
Layering
Screener columns:
| Column | What it shows |
|---|---|
| Skew 10% | the skew over the whole 10% depth, in percent. +150% — 2.5 times more bids than asks; −150% — the opposite. Green is a bid skew, red is an ask skew |
| Lifetime | how long the skew has held: 45s, 12m, 3h 20m |
| Bands | the model value from −10 to +10 — the number of bands where one side is twice as thick (see "How Layering works") |
The longest-lived skews are at the top. The panel filters work on Bands. The sound alert "Layering …" plays when a new coin appears in the screener.
On the chart, the Layering highlighter indicator fills the background: green for a bid skew, red for an ask skew. The larger the Bands, the more saturated the color. The value is written once a minute.
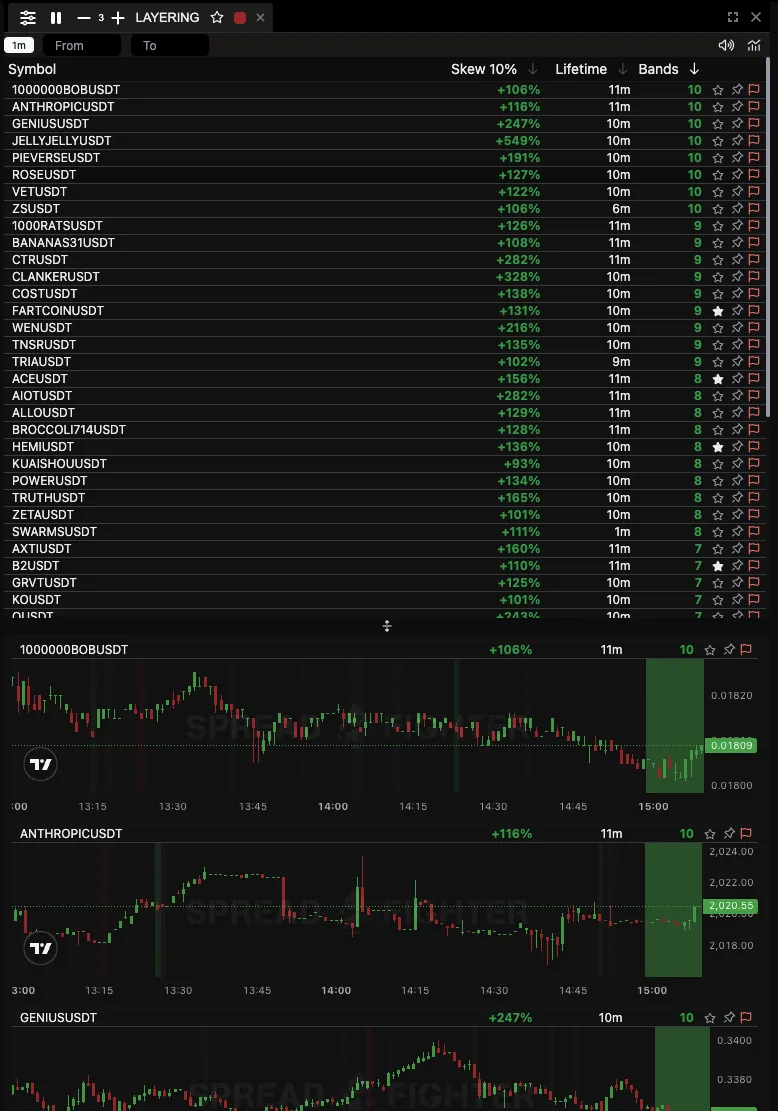
Layering.
Spoofing
The widget table receives 2 values:
- Price - the price where the spoofing order is placed,
- Dist % - the distance in percent from the current price to the spoofing order.
You can filter the Dist % range of incoming signals by setting threshold values.
On the chart, the Spoofing highlighter indicator draws a line at the wall price: green below price (bid), red above price (ask). A point is placed once a minute while the condition holds.
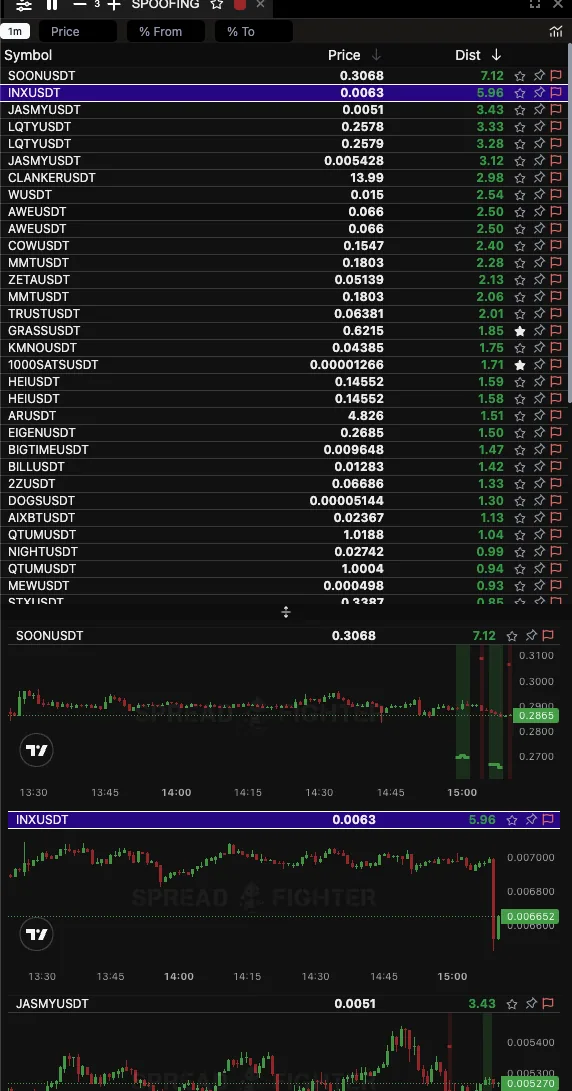
Spoofing.
Use cases
Layering
Let us look at an example with RUNE. On 24 Feb 2024 at 12:15 UTC+3, the Layering highlighter model pointed to a layering algorithm appearing in the limit order book.
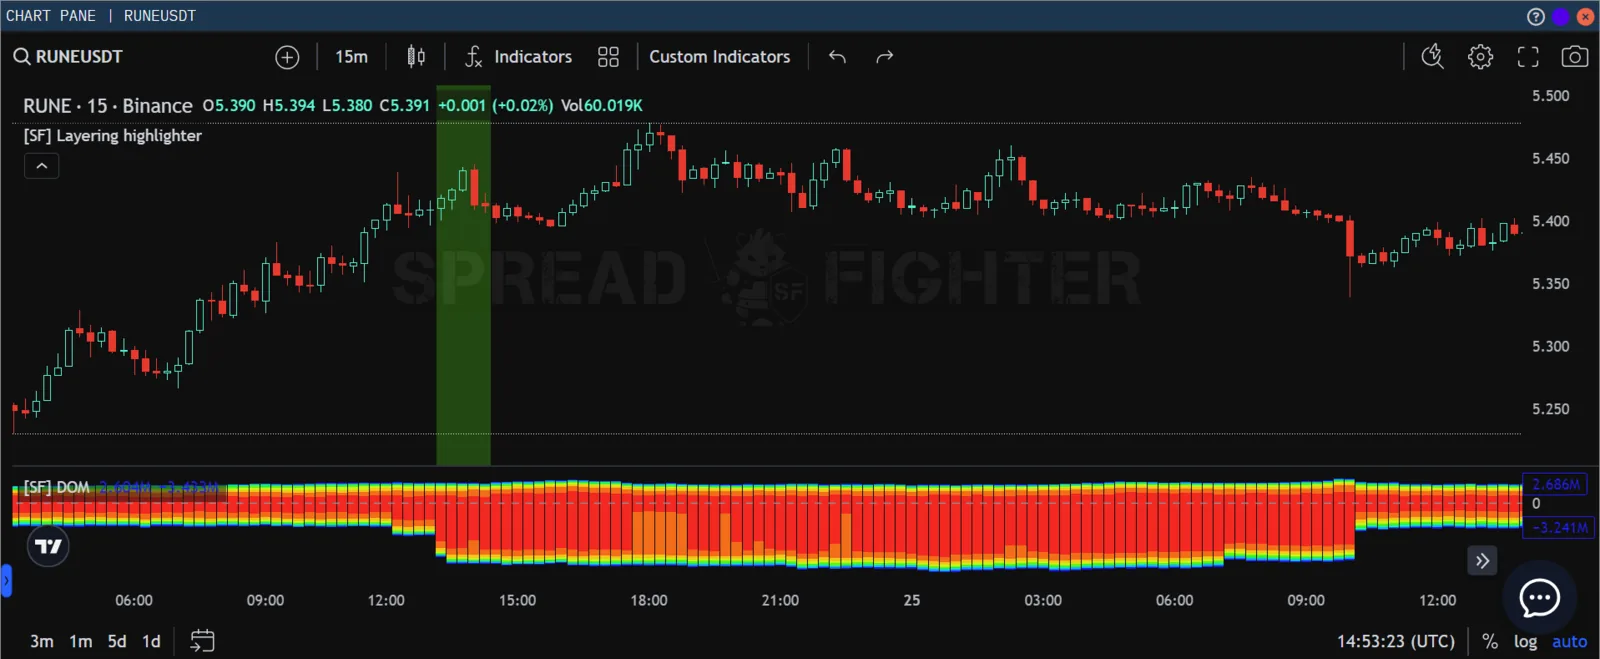
How the imbalance looks in SpreadFighter.
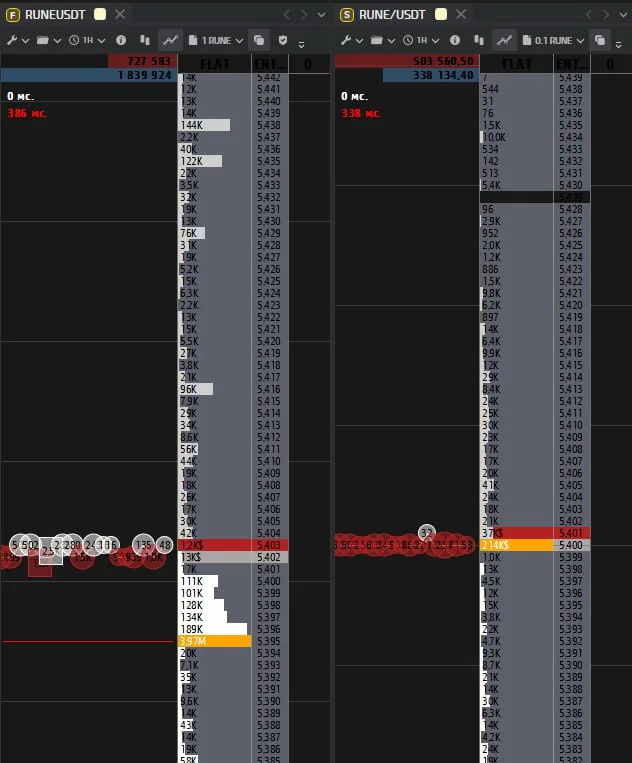
How the imbalance looks in the limit order book.
On 25 Feb 2024 at 10:00 UTC+3 the placed orders were removed, and the asset price reacted with a drop of 1.5%.
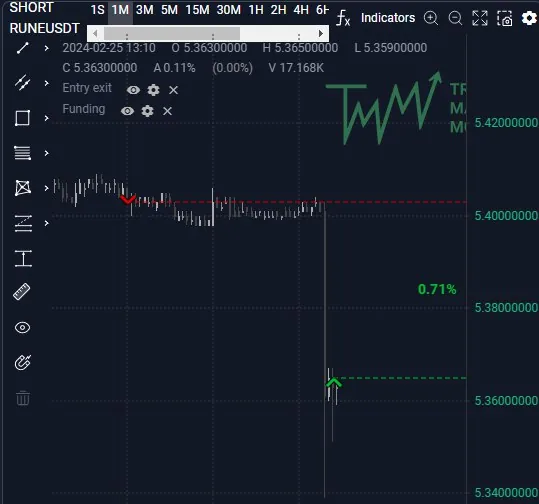
How the situation played out.
Spoofing
On 21 Mar 2024 at ~8:20:00 UTC+3 the Spoofing highlighter model pointed to a large order on the bid side.
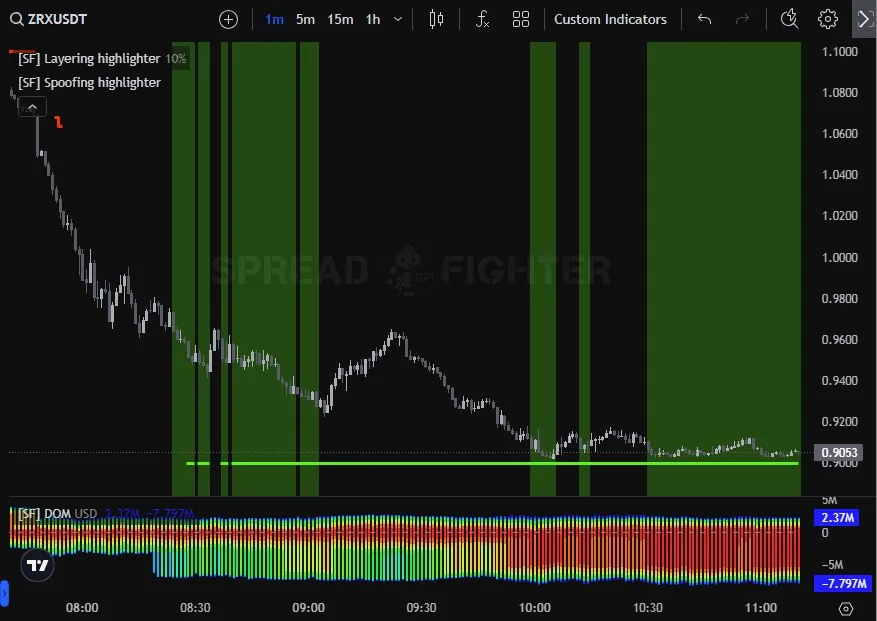
How the imbalance looks in SpreadFighter.
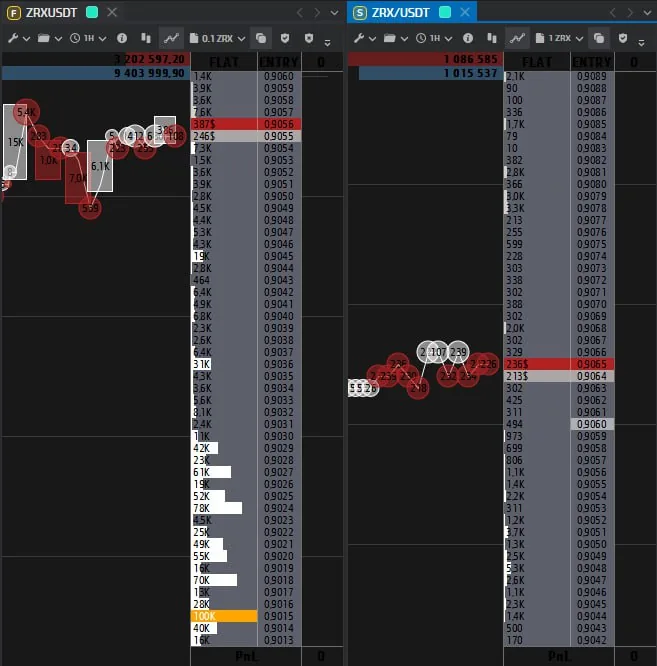
How the large order looks in the limit order book.
On 25 Feb 2024 at 14:15 UTC+3 the placed order was executed, and the asset price reacted with a drop of -1.5%.
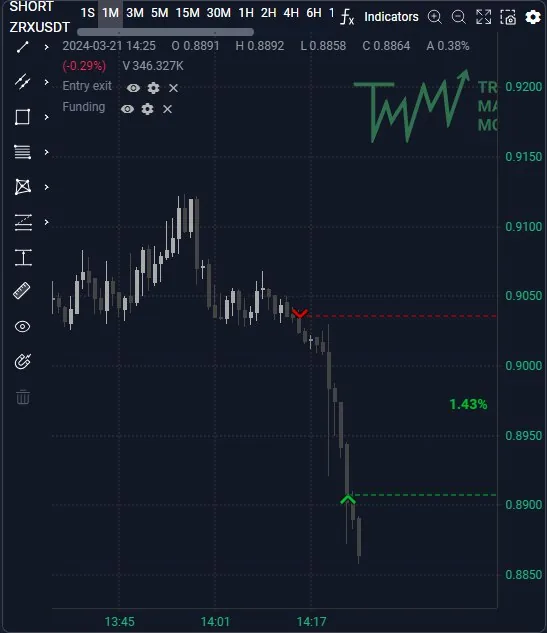
How the situation played out.
What changed on 27 Sep 2026
Layering. Since December 2025 the model compared the book with its average over the last ~50 seconds and caught only instant spikes. So coins flickered in the screener for 2–8 minutes per hour on a random side, and stable skews (for example, the ask on US) did not get in at all. Now the model again looks at the skew level and keeps a coin while it lasts. The screener shows the skew in percent and the lifetime.
Spoofing. Because of a time-matching error between two order book streams, the model almost never fired: about 15 points per day across the whole market, and the line on the chart disappeared. The error is fixed, and the wall line is drawn again.
Limitations
- Layering works on Binance USDT futures and on Hyperliquid (since 27 Sep 2026, about 330 markets, including HIP-3). Exchanges are chosen in the screener filters window, and Hyperliquid rows have their own icon. Global dashboard filters (volume, funding, baskets) apply only to Binance. The Hyperliquid book is short (20 levels), so bands farther from price are calculated from the exchange's aggregated book.
- Spoofing works on Binance and on Hyperliquid (since 27 Sep 2026). On Hyperliquid the wall is searched only in the exchange's exact book and usually sits 0.03–1% from price — see "Spoofing on Hyperliquid".
- Volume in bands is counted in coins. The skew in percent does not depend on this.
- Lifetime in Layering is counted from the moment the server saw the skew. After a server restart the counter starts over, even if the skew had held before.
- Orders are easy to place and to remove: a wall can disappear a second before price gets there.
- The whole market can be skewed to one side at once — for example, to the bid on most coins. Look at the strength (Skew, Bands) and the lifetime, not only at the fact of getting into the screener.
How to trade from large orders
Trading from large orders is a scalping classic. Traditionally there are two ways to trade: frontrun and eating away. In the first case, the trader bets that the large order will strongly affect the price and trades in the same direction as the order. In the case of eating away, the trader believes that once the order is removed/executed by other participants, price will return to its previous values, and trades in the direction opposite to the order.
You can see an example and a breakdown of trading from large orders in the video of our partner Anton Klevtsov, using the first trading day of Facebook as an example (Meta* is recognized as an extremist organization in the Russian Federation).