Spot perpetual spread, Spot perpetual dominance, Spot perpetual dominance highlighter, Who, Spot perpetual time dominance, Funding rate
Tools for assessing the spot and futures order flow.
Updated 7 Nov 2026. Since May 2025, Spot perpetual dominance highlighter had been coloring the background by the dominance counter from Spot perpetual time dominance instead of the spot–perp spread. It now uses the spread again, like Spot perpetual dominance. The Funding rate indicator is fixed and described below: the Predicted rate line used to show false spikes down to −2.5%, and the payout interval now comes from the exchange history.
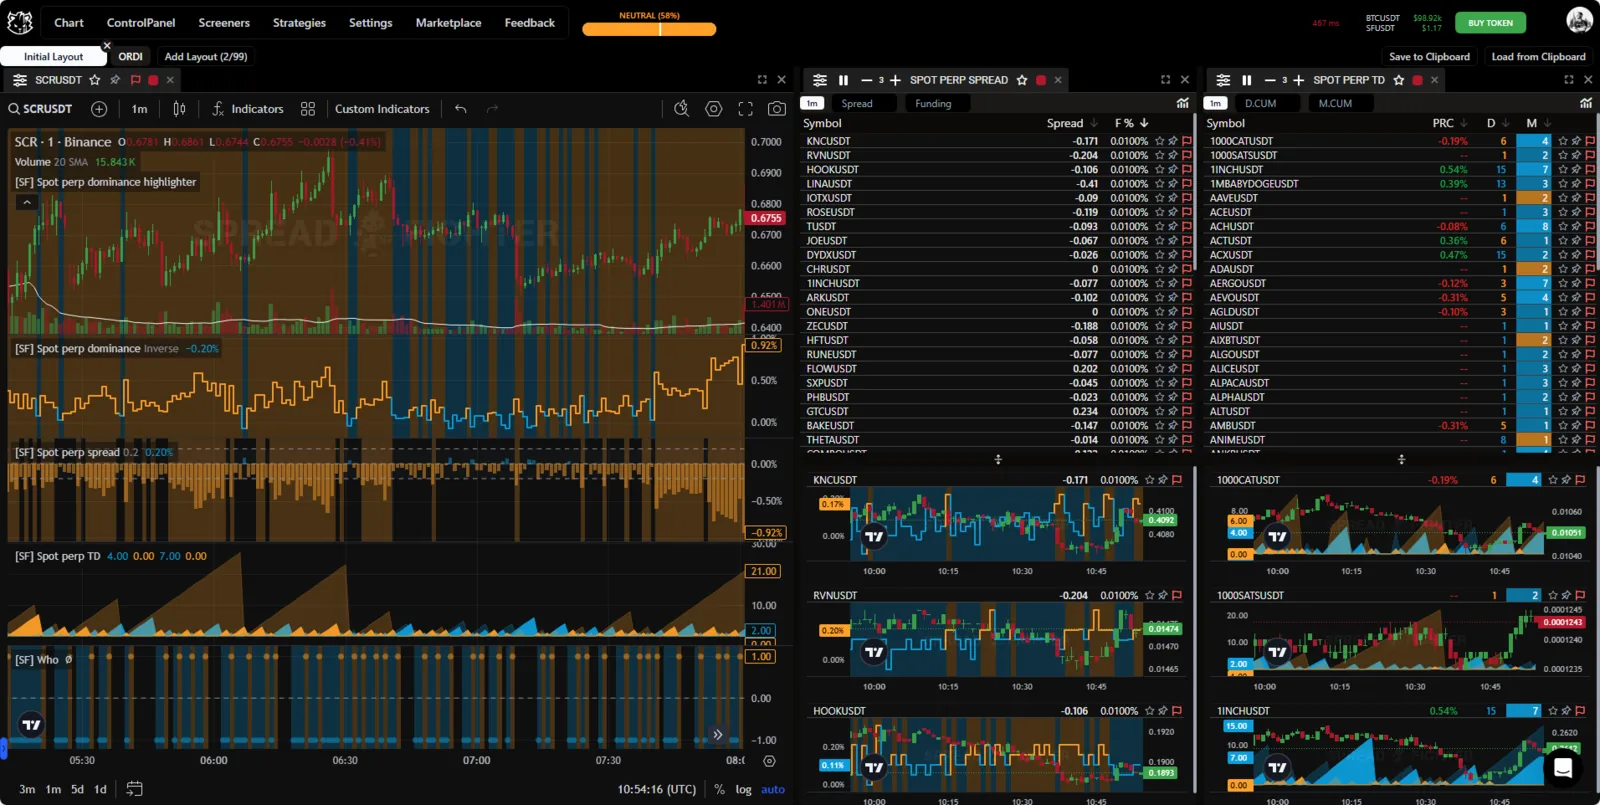
Appearance of the indicators and screeners.
Description
Spot futures spread shows the difference between the closing price of a futures contract and the index price of the asset.
Spot futures dominance and Spot futures dominance highlighter show the dominance of the spot asset or the perpetual futures contract in the overall trade flow.
Tests
Coming soon…
Functionality
Indicators
Spot perpetual spread
The model calculates the difference between the index price of the underlying asset and the last trade price of the perpetual futures contract. Results are shown as a percentage.
You can read more about the different price types at this link.
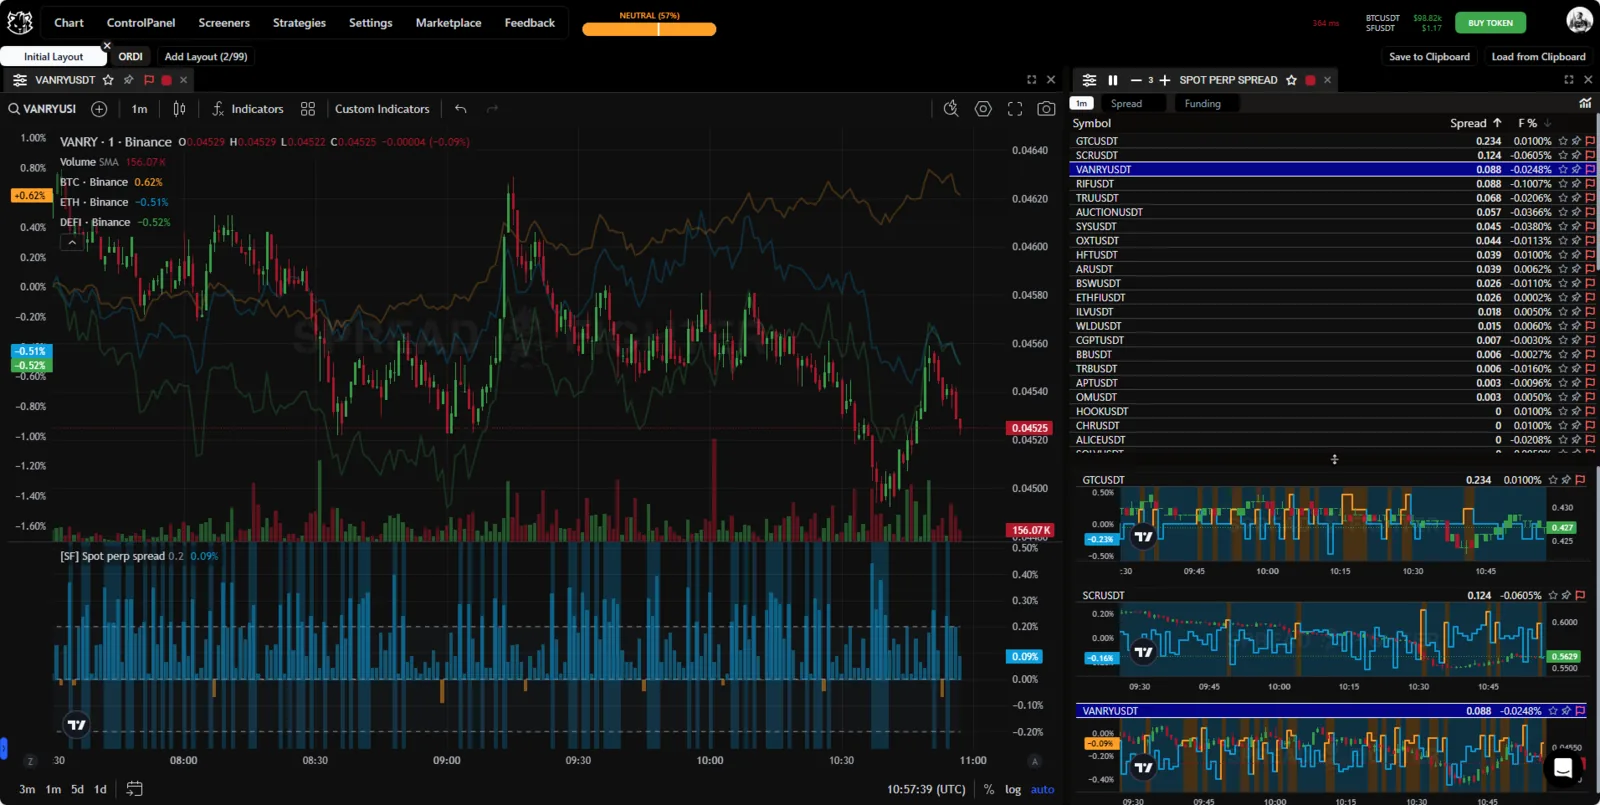
Spot futures spread.
Spot perpetual dominance
The model is an oscillator drawn in two colors: orange means dominance of the underlying asset, blue means dominance of the futures contract. The oscillator background is colored accordingly.
Spot futures dominance highlighter is the overlay version of Spot futures dominance. It colors the background of the main working area according to the model readings. Areas where the spot asset dominates are orange, and areas where the futures dominates are blue.
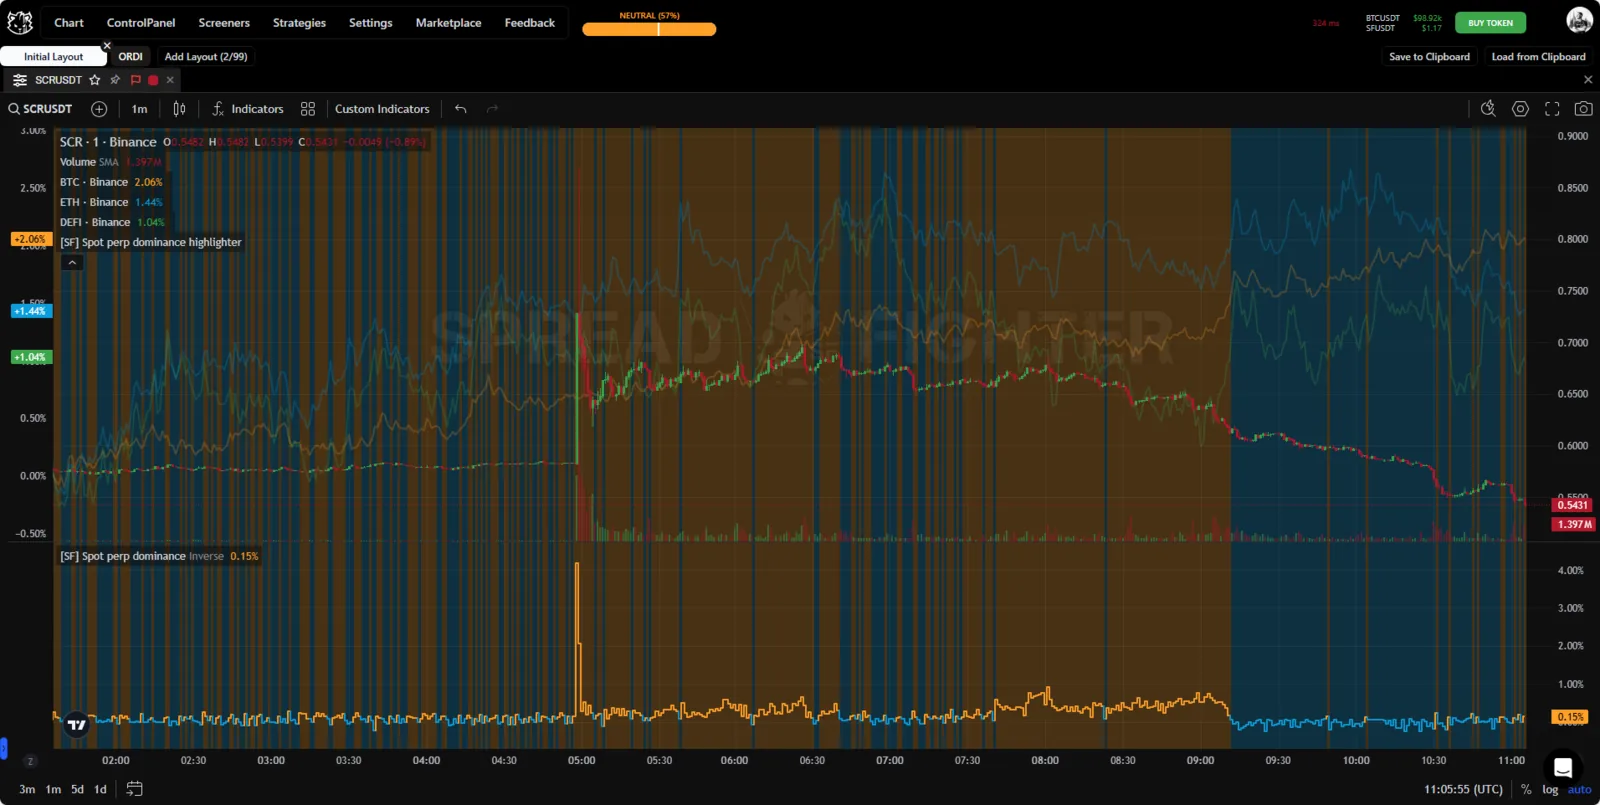
Spot perpetual dominance.
Spot perpetual who
A matrix model that determines which asset, spot or perpetual futures, drove the price change. In the historical data it records the current value of the model at the moment the candle closes.
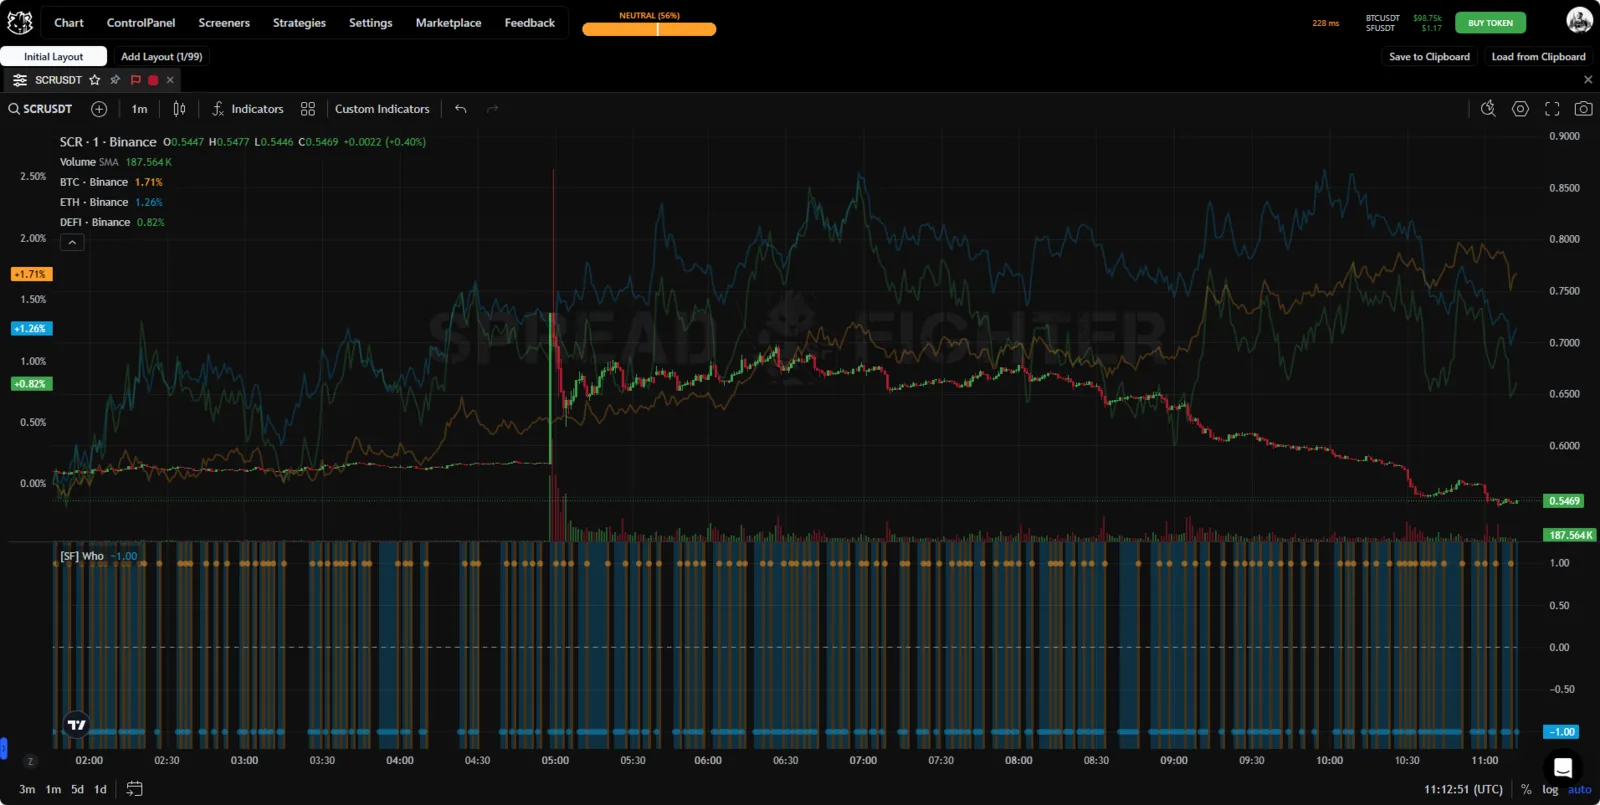
Who.
Spot perpetual time dominance
The model calculates the period of time during which the underlying asset and the perpetual futures dominated price formation.
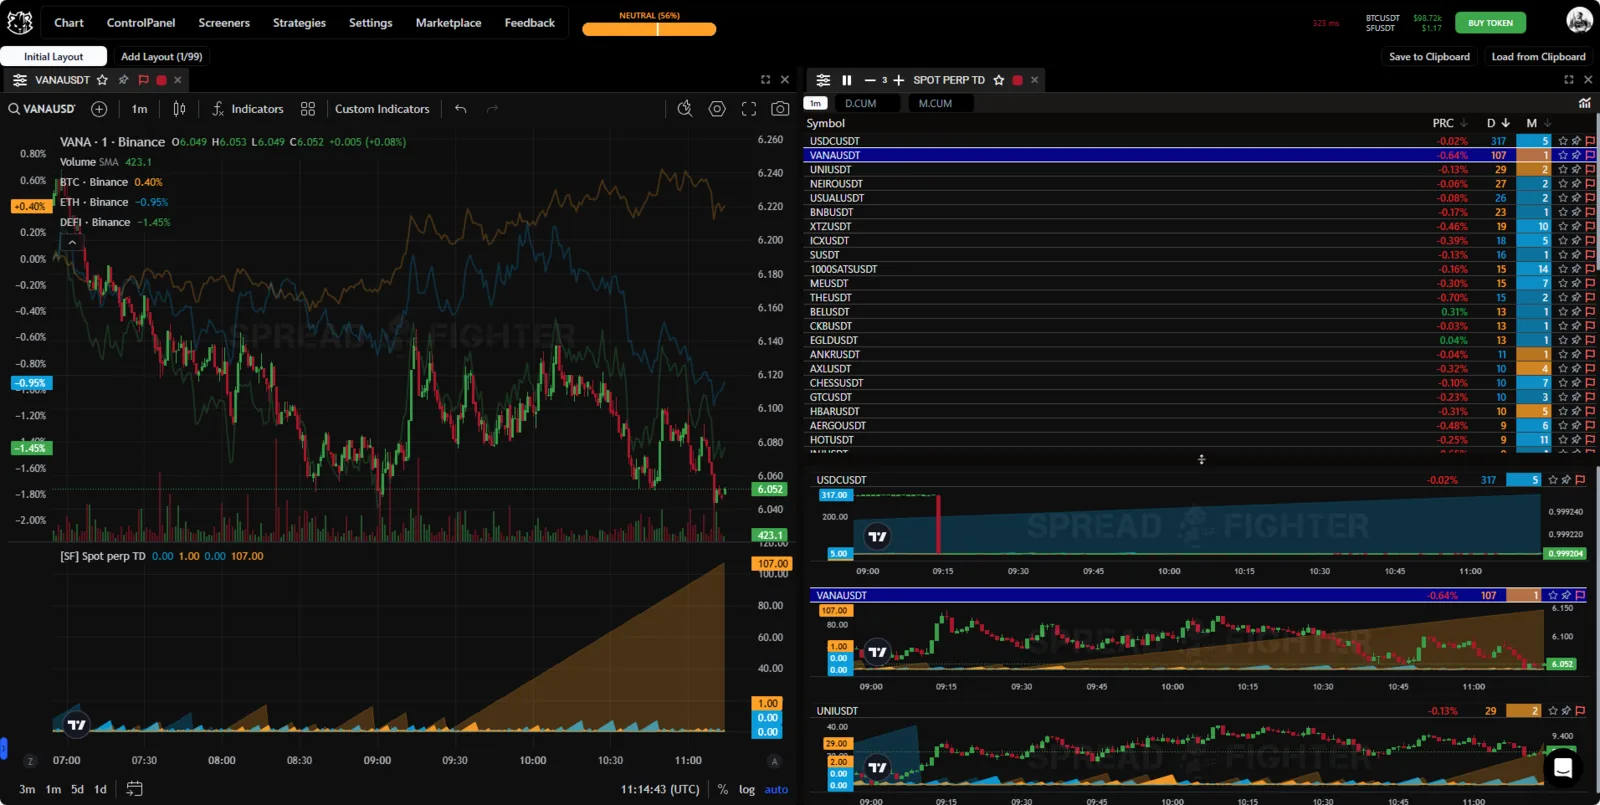
Spot perpetual time dominance.
Funding rate
The indicator shows the perpetual futures funding rate and its estimated value based on the spot–perp spread.
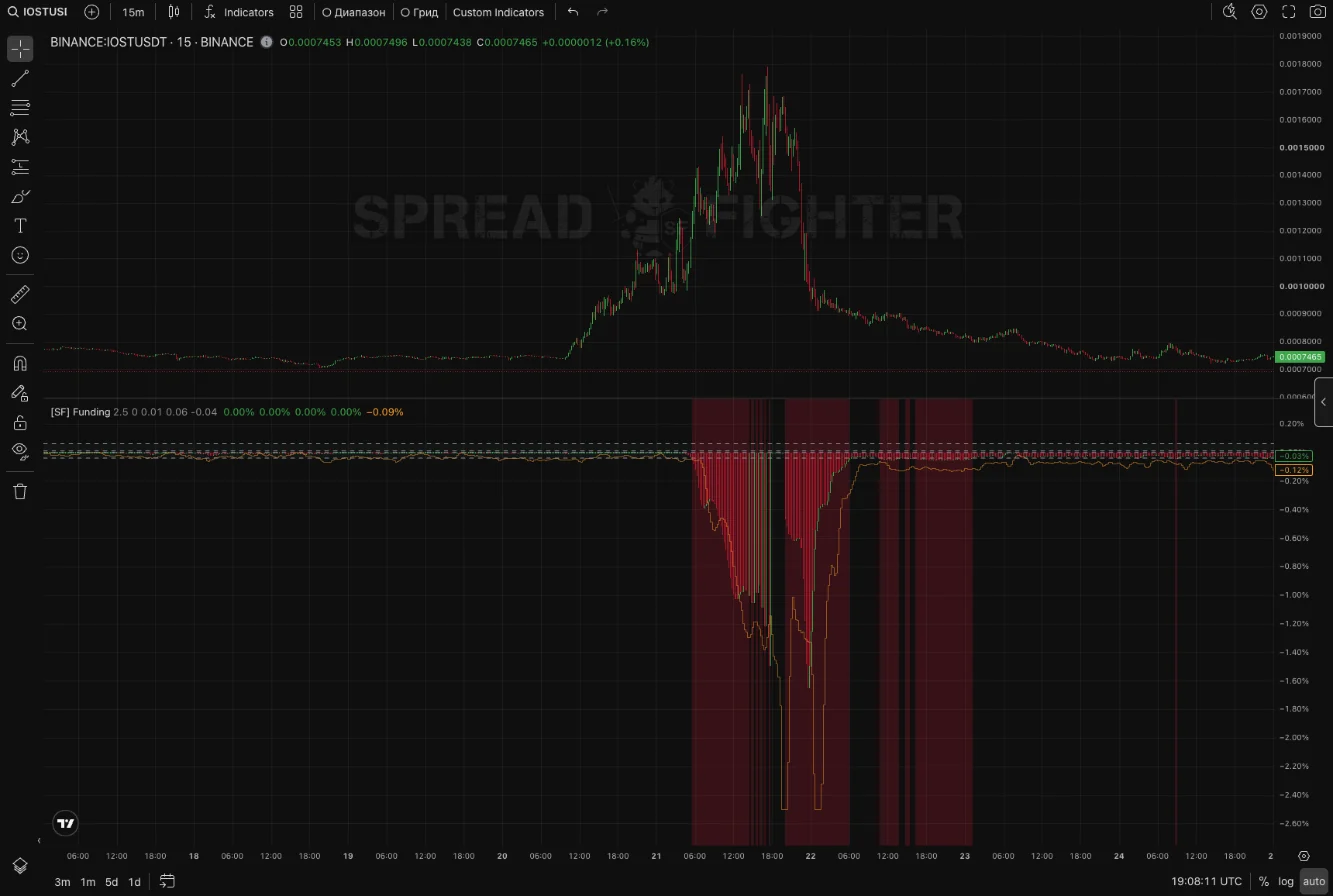
Funding rate on IOSTUSDT, 17–24 Oct 2026.
- Bars — the exchange rate in percent per payout period: red below zero, green above.
- Orange Predicted rate line — the rate calculated with the exchange formula from the spot–perp spread: the weighted average of the futures premium to spot over the payout period plus an interest rate adjustment. The line shows where the rate is heading before the next payout.
- Dashed levels — zero, the base rate of 0.01%, and the band limits of 0.06% and −0.04%. When the rate crosses a limit, the panel background is highlighted: red below −0.04%, green above 0.06%.
Input parameters:
| Parameter | Default | What it does |
|---|---|---|
| Max funding rate value | 2.5 | Cap of the estimated rate, in percent per payout period |
| Payout frequency, h (0 = auto) | 0 | Payout period in hours. 0 — the period is taken from the exchange payout history on every bar |
| Default funding rate value | 0.01 | Base rate, dashed level |
| Upper band value | 0.06 | Upper band limit |
| Lower band value | −0.04 | Lower band limit |
A coin's payout period can change: when the rate hits the cap, the exchange moves the coin from 8 hours to 4, 2 or 1 hour, and each exchange does it its own way. In auto mode the indicator accounts for this on every bar: on Binance, Aster, Bybit and OKX it uses that exchange's payout history, on Hyperliquid the period is always 1 hour. To set the period manually, enter the number of hours.
If the Funding rate indicator was already on your chart before 7 Nov 2026, it kept the old Payout frequency = 8. To switch to auto, open the indicator settings and click Reset settings, or add the indicator again.
Widgets
Spot perpetual spread
In the widget, the Spread column shows the spread value for each symbol, as well as the funding rate. Positive values mean the perpetual futures is more expensive than the underlying asset, and vice versa.
You can read more about the funding rate at this link.
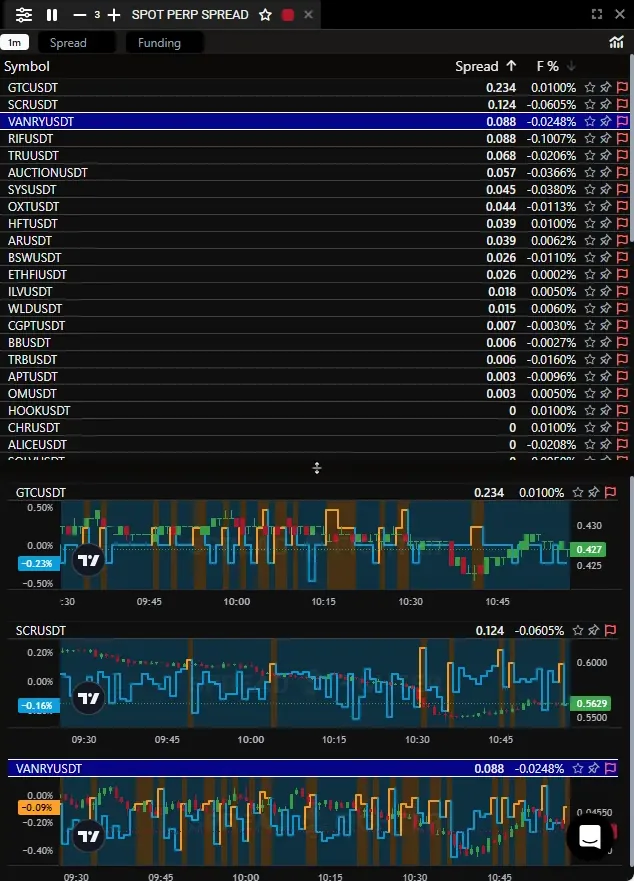
Spot perpetual spread.
Spot perpetual time dominance
In the widget, the D and M columns show the number of minutes during which the underlying asset or the perpetual futures dominated. Dominance of the underlying asset is orange, dominance of the perpetual futures is blue.
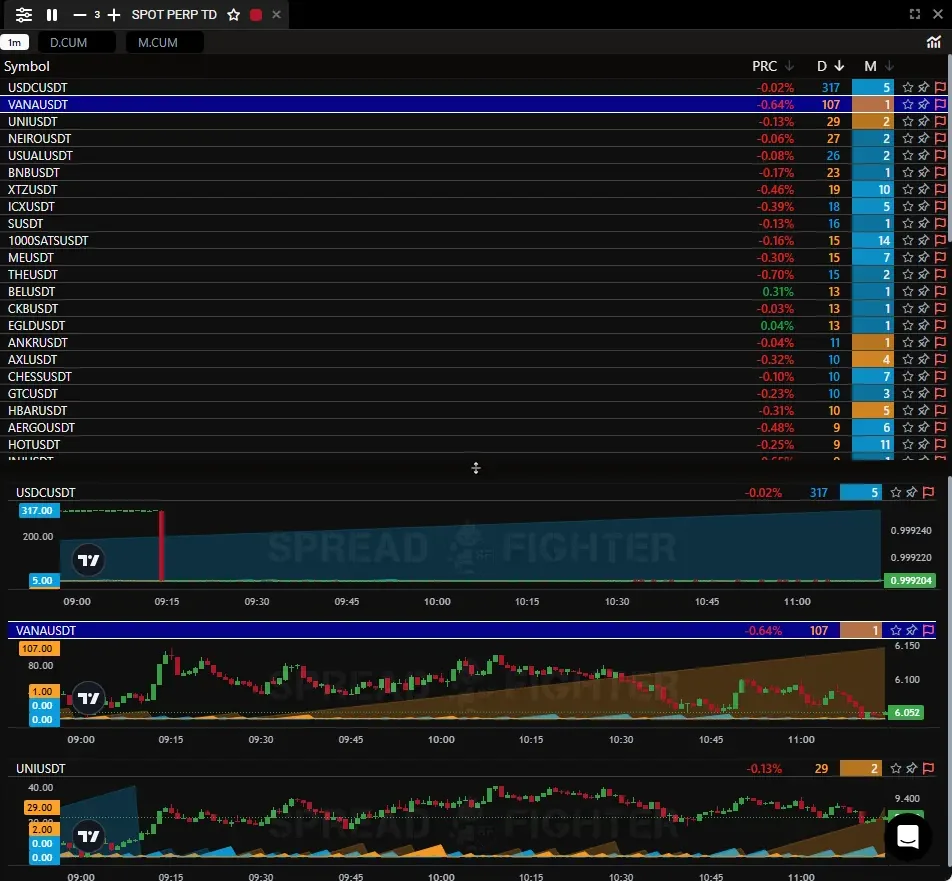
Spot perpetual time dominance.
Location
The Spot perpetual dominance, Spot perpetual dominance highlighter and Who models are available only as oscillator indicators.
To add the "Spot perpetual spread" and "Spot perpetual spread time dominance" tools to your workspace, first click the "Screeners" button in the platform header. Then click the button of the same name in the "Microstructure" section.
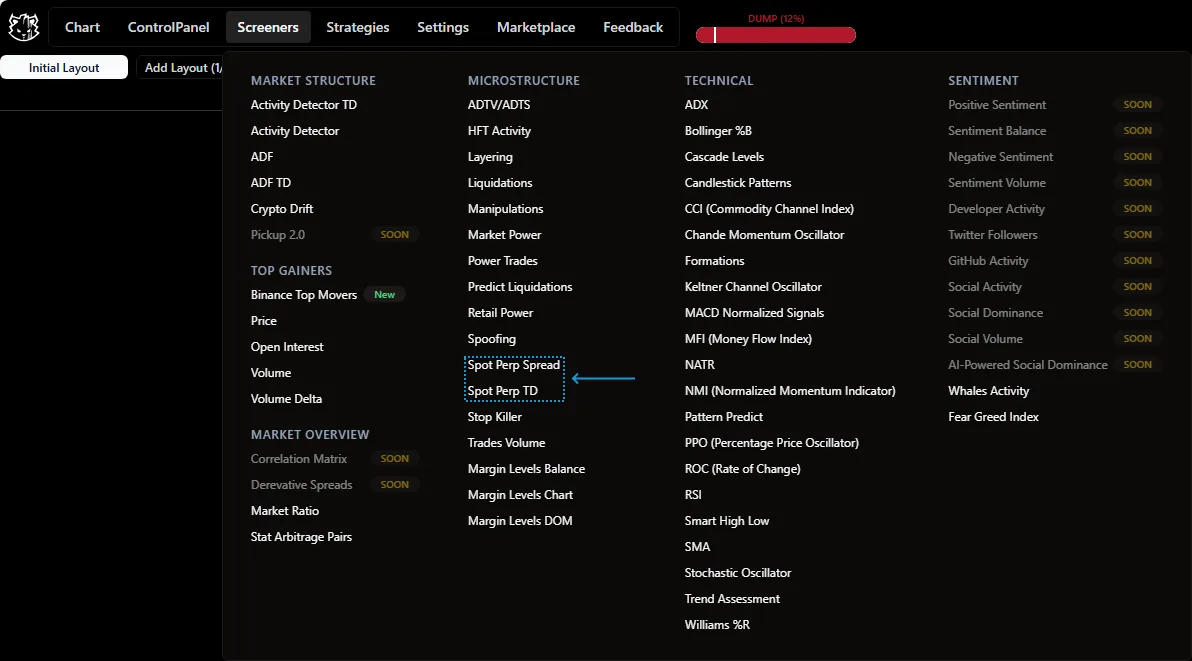
Widget location.
Use Cases
Coming soon…