Stop killer, Stop killer highlighter, CSKD
The model highlights executed stop-loss orders.
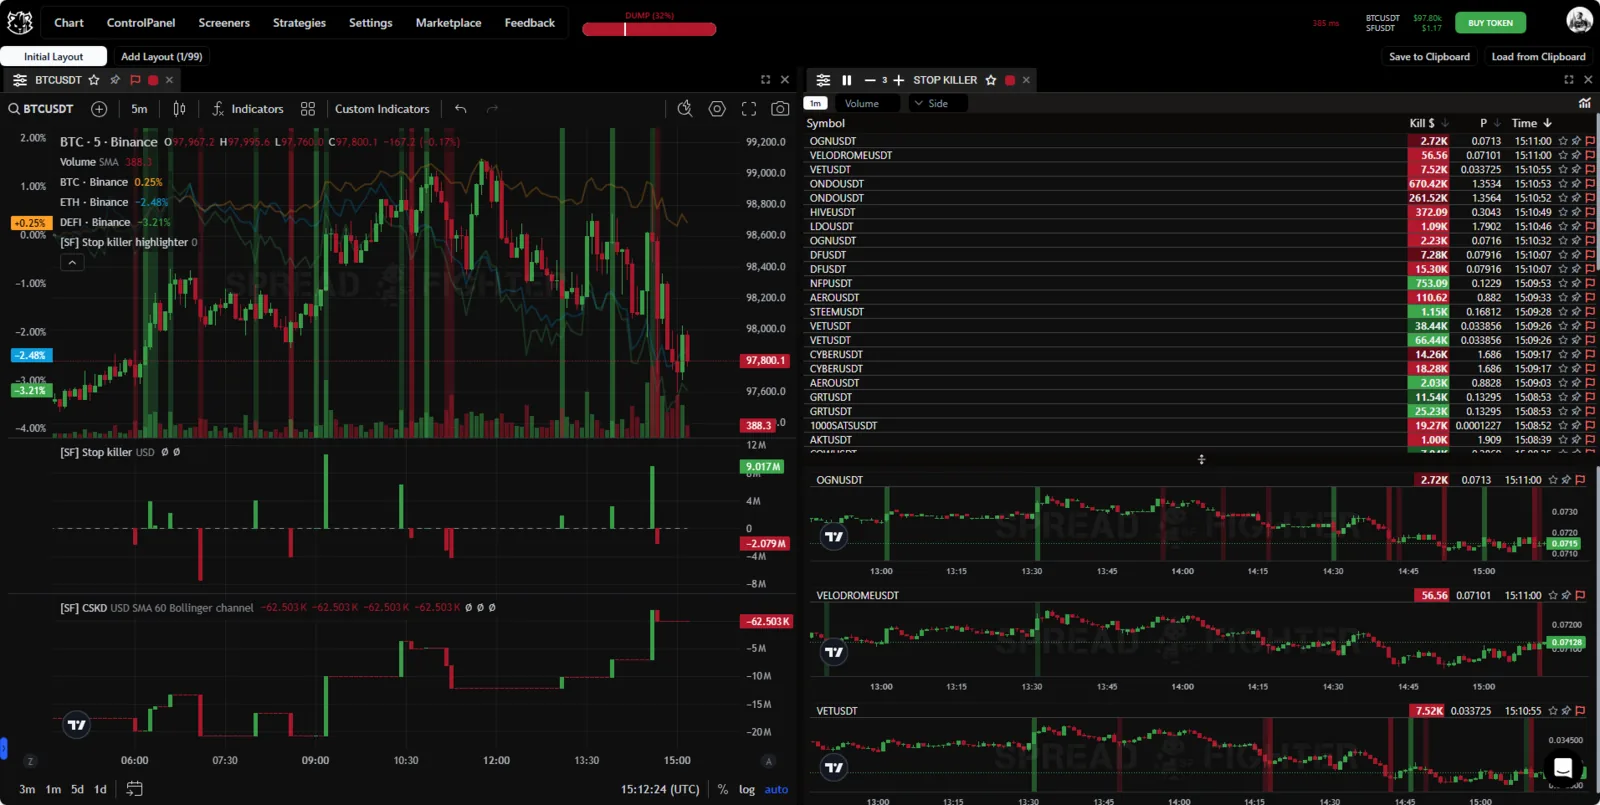
Model appearance.
Description
The model detects executed clusters of stop-loss orders that drive a price reversal or breakout. It lets you calculate the volume of positions closed by stop-loss orders and filters out non-target volume. The model is simple but quite accurate. The information is confirmed by data from external affiliated sell-side sources.
The model has 2 values: order cluster and total volume. Order clusters are divided into significant and critical levels, based on the overall volume analysis and the range of executed stop-loss orders.
The main drawback is a strong loss of accuracy on instruments with very low liquidity and a very large price step.
Tests
Coming soon…
Location
To add the "Stop Killer" tool to your workspace, first click the "Screeners" button in the platform header. Then click the button of the same name in the "Microstructure" section.
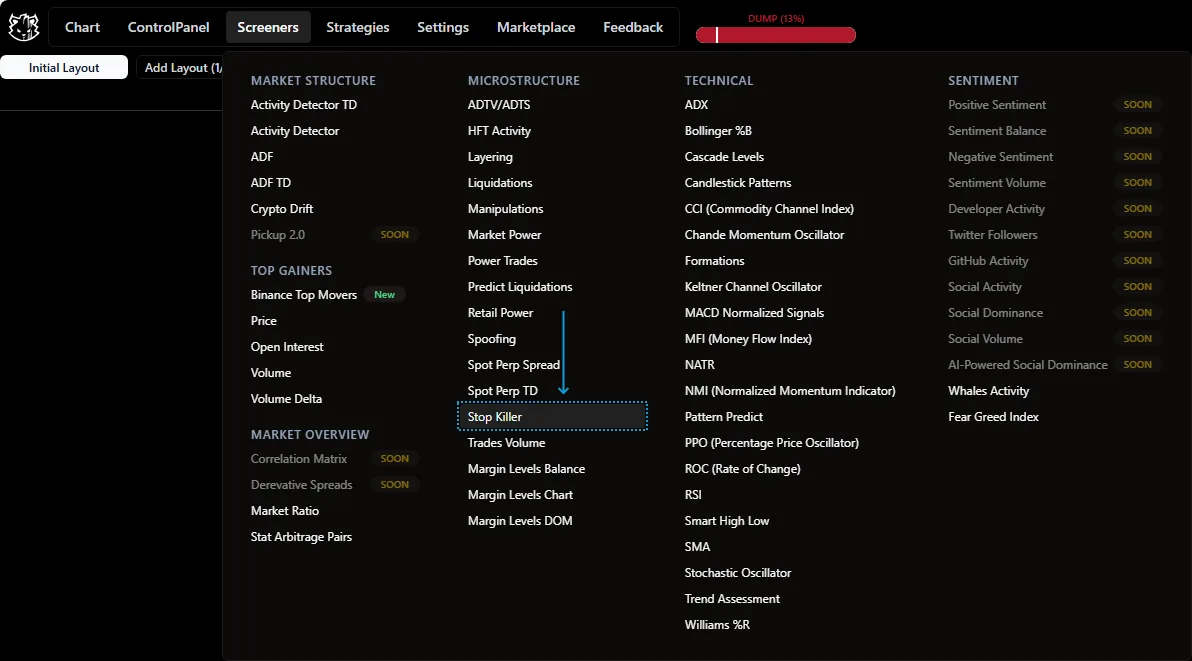
Widget location.
Functionality
Indicators
Stop killer highlights on the chart the points where stop-loss orders were executed. The indicators receive data from the Stop killer model.
Stop killer has 3 visualization options:
- A histogram showing the volume of executed stop-loss orders.
- Background highlighting that marks the bars with order execution.
- A candlestick chart (Cumulative stop killer delta) that calculates the cumulative sum of executed order volumes.
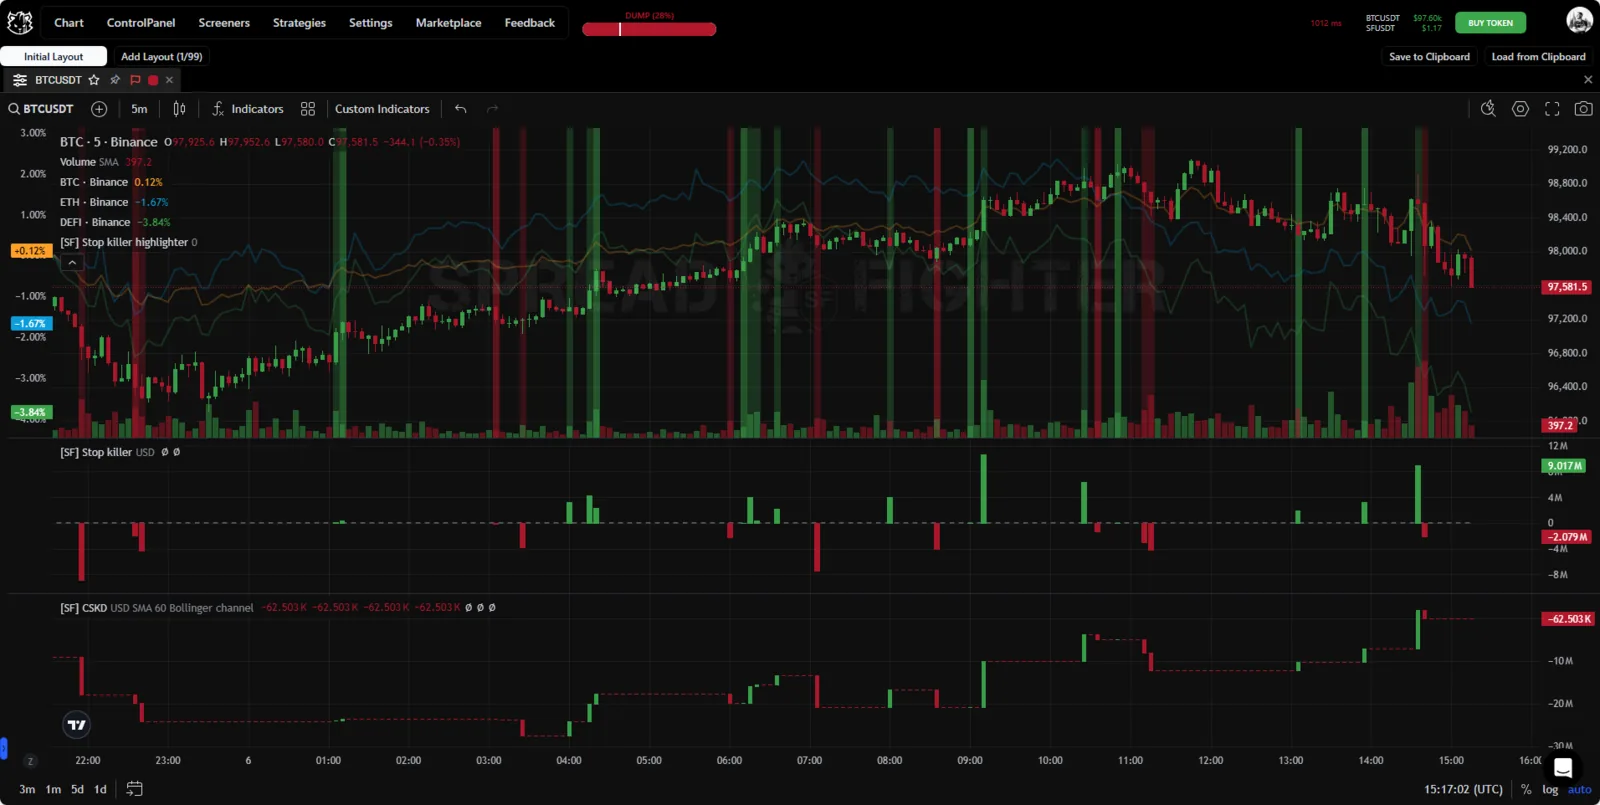
Indicators appearance.
Widget
The widget table contains:
- Kill $ - the volume of the executed stop-loss order,
- P - the average price,
- Time - the order execution time.
You can filter incoming signals by Kill $ volume and by Side (Long, Short).
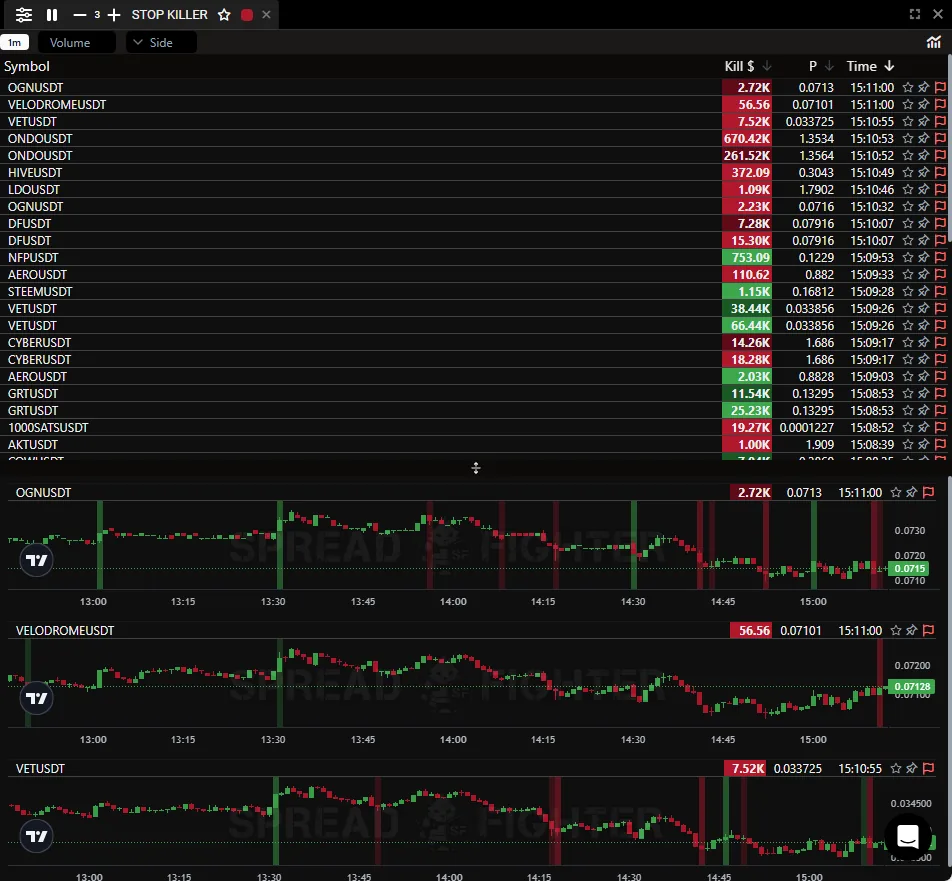
Widget appearance.
The data is grouped into 4 types of background highlighting according to the Stop killer model:
- Dark green shows potentially significant executed stop-loss orders of SHORT positions.
- Light green shows potentially critical executed stop-loss orders of SHORT positions.
- Dark red shows potentially significant executed stop-loss orders of LONG positions.
- Bright red shows potentially critical executed stop-loss orders of LONG positions.
Like all SpreadFighter models, Stop killer does not work on the usual timeframes. It works on the tick interval.
Stop killer aggregates data from ticks and passes it to timeframes. Consider an example: the MATIC coin, the Stop killer and Chart pane widgets, and the Stop killer highlighter indicator. No filters. At 10:45:23 UTC+3 and at 10:45:24 UTC+3, Stop killer received signals about the execution of two separate stop-loss orders of short positions. The first was $ 281985.91, the second $ 175788.47. For Chart pane (one-minute timeframe) and Stop killer highlighter, they pass as one signal within the 10:45 candle. The same applies to two separate stop-loss orders of long positions at 10:37:20 UTC+3 and 10:37:23 UTC+3.
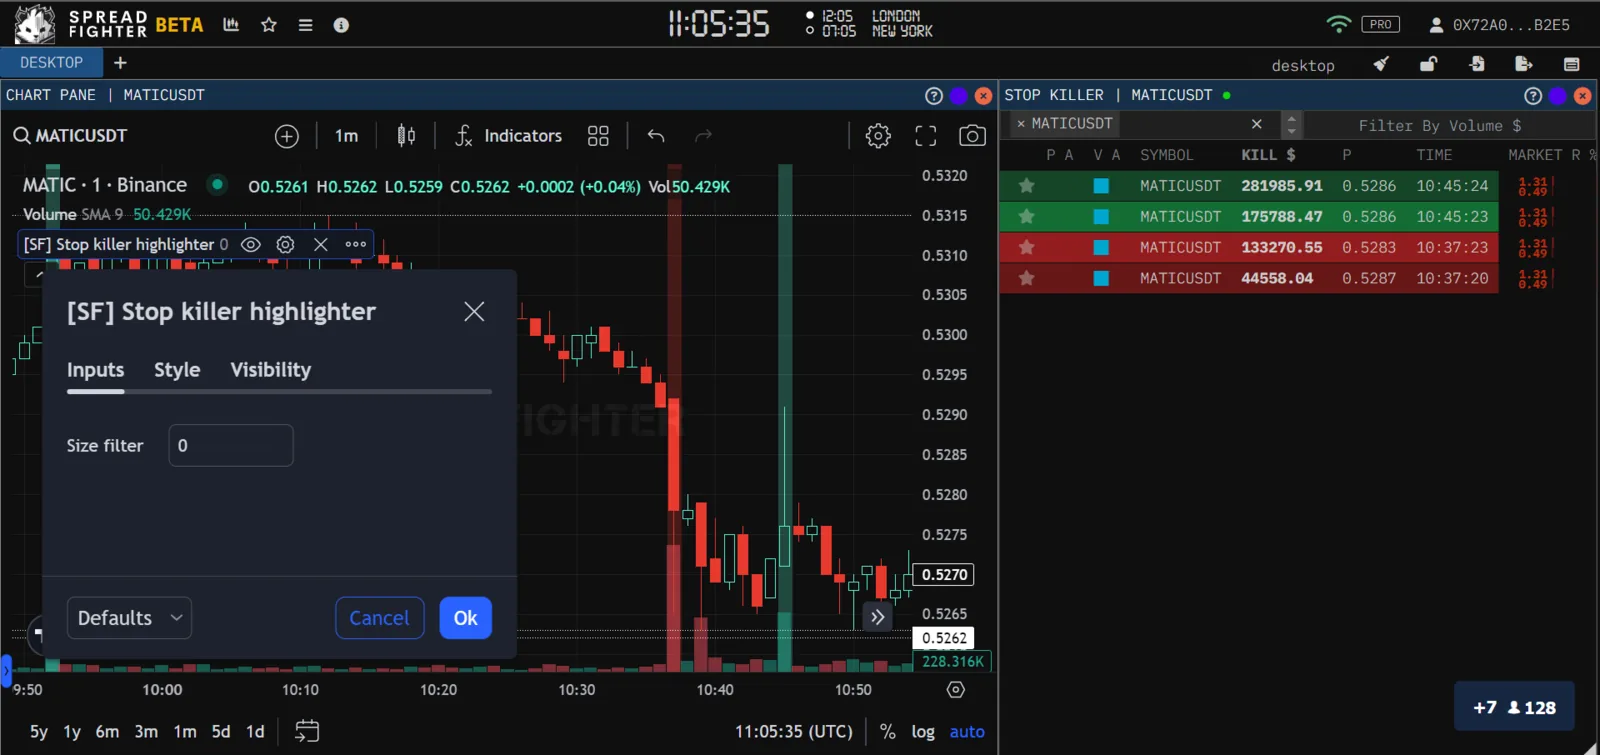
Stop killer highlighter without filters.
Now raise the filter on the volume of executed stop-loss orders to $ 400000. The stop-loss orders at 10:45 UTC+3 are still highlighted, because the total volume of executed stop-loss orders at 10:45 UTC+3 is above $ 400000 ($ 281985.91 + $ 175788.47 > $ 400000). The stop-loss orders at 10:37 UTC+3 are no longer highlighted, because their total volume at 10:37 UTC+3 is below $ 400000 ($ 133270.55 + $ 44558.04 < $ 400000). The same logic applies to higher timeframes.
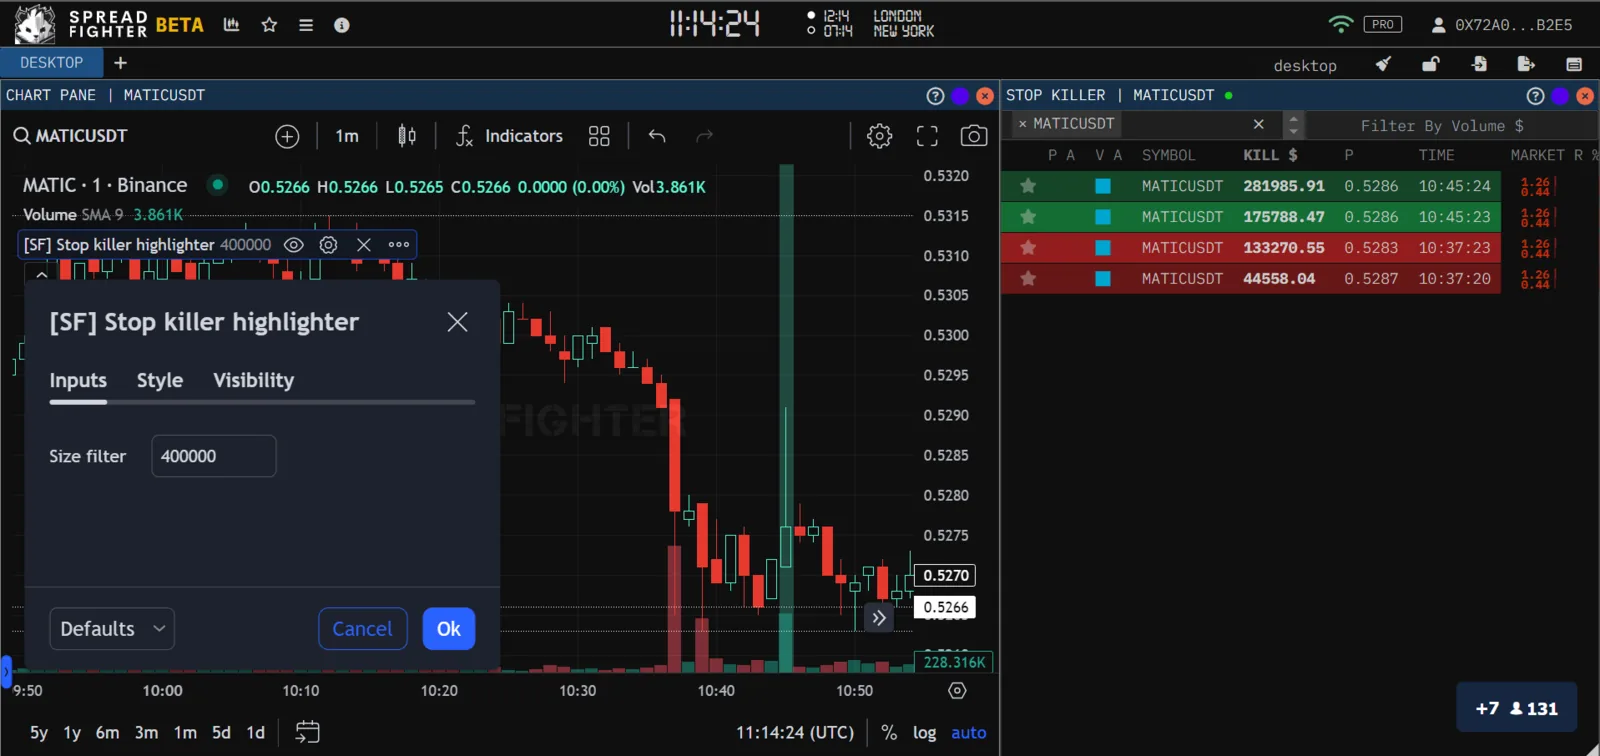
Stop killer highlighter with filters.
A timeframe is an abstraction created to make a price chart easier for the human eye to read. Stop killer highlighter is not an indicator like RSI, which takes data from a timeframe, transforms it and returns the result as an oscillator. Stop killer highlighter is only a graphical display of a model that works in real time on the tick frame. So the colors and volumes in the Stop killer widget and in the Stop killer highlighter indicator may not match each other: the first shows individual orders, and the second shows their aggregation on the timeframe.
Use cases
Our practical experience shows that the execution of stop-loss orders is often the culmination of a move. So this tool can be used to find reversal points and to open and close positions more precisely. But as with all other tools, each user decides for themselves how to use Stop killer