Chart
TradingView graphical shell for displaying quotes, indicators and SpreadFighter models.
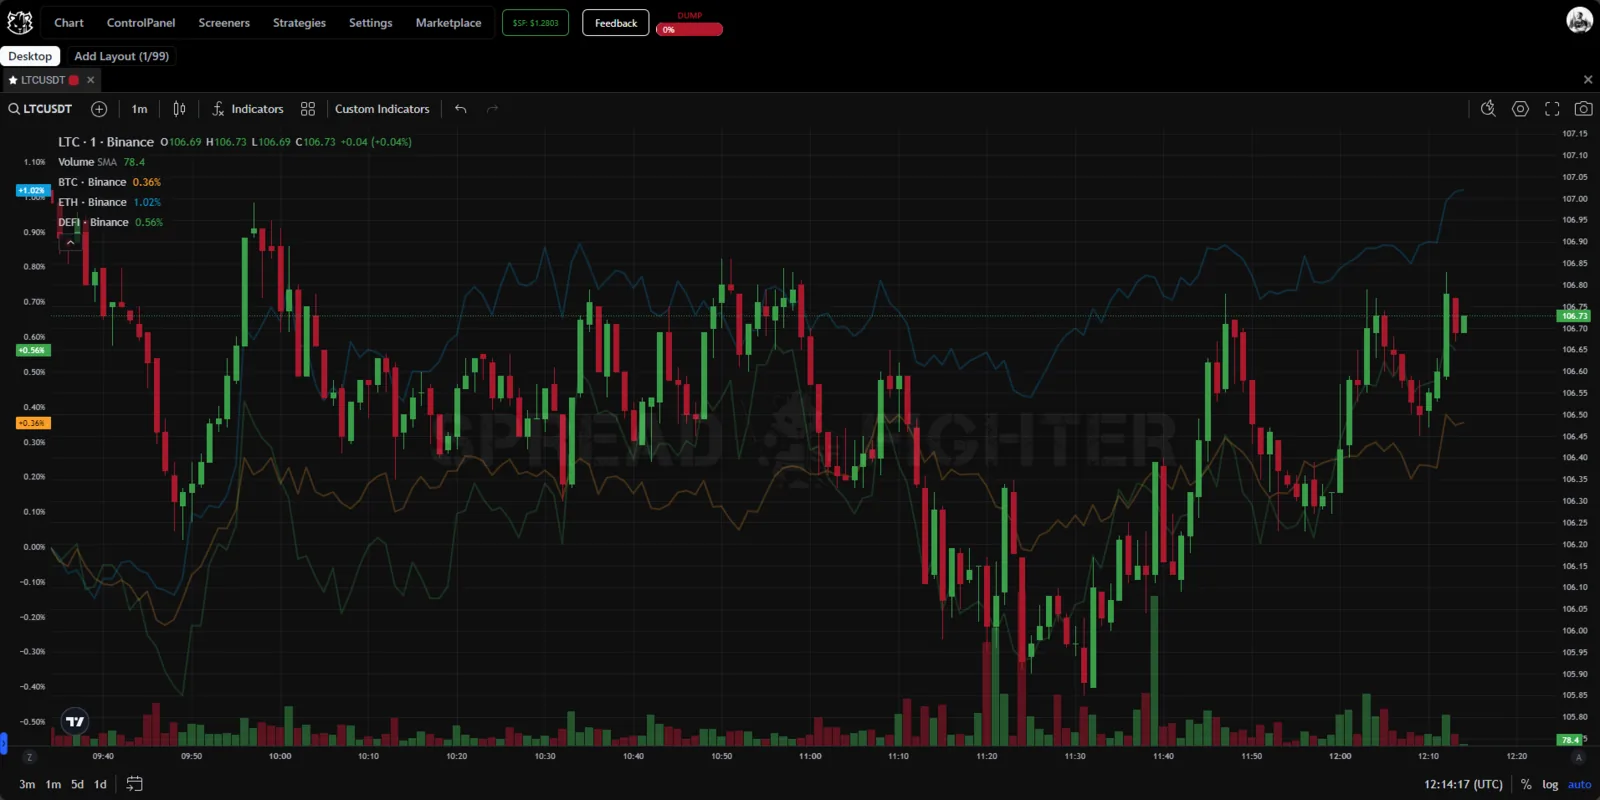
Widget appearance.
Widget Location
To add the tool to your workspace, click the "Chart" button in the platform header.

Widget location.
Widget Functionality
Basic functionality: main settings
Chart pane fully replicates the functionality of TradingView, so we recommend that you first read about it on the developers' official website.
In the top left corner there is a ticker input window for switching to the corresponding coin.

Ticker search window.
All coins traded on Binance Futures are available, as well as synthetic tickers.
The list of available markets, exchanges and assets will be updated as the platform develops.
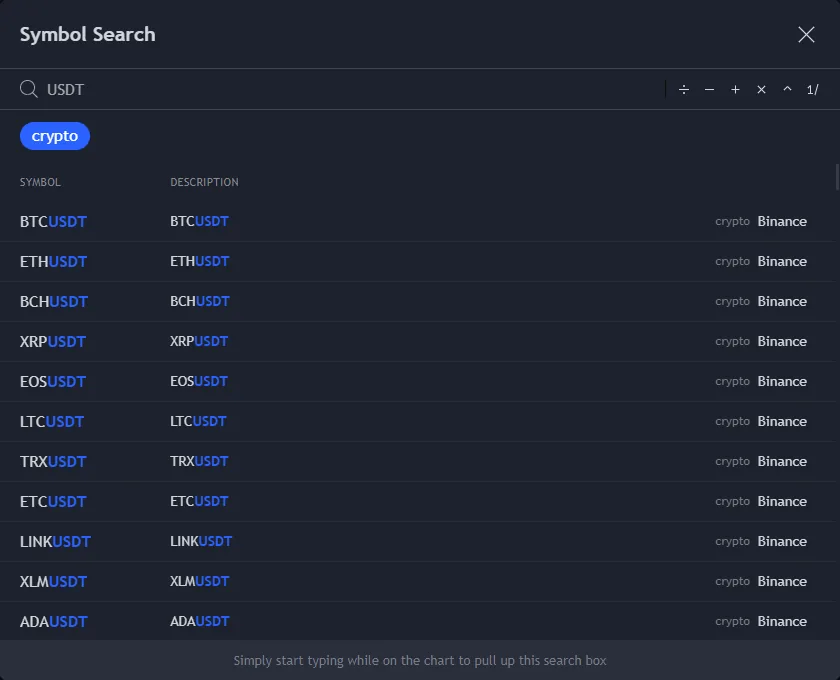
Ticker list.
To the right of the ticker search window there is a button. Use it to add the price chart of another asset on top of the one already open, for comparison.

Adding an asset for comparison.
Symbols that are already added are listed under the search bar. Below them are the symbols that were recently added for comparison with this button.

List of tickers for comparison.
The chart of the coin used for comparison can be shown on the same price scale (switching to percentage mode), on a new price scale, or on a new pane below/above the main working area.

Choosing how to add
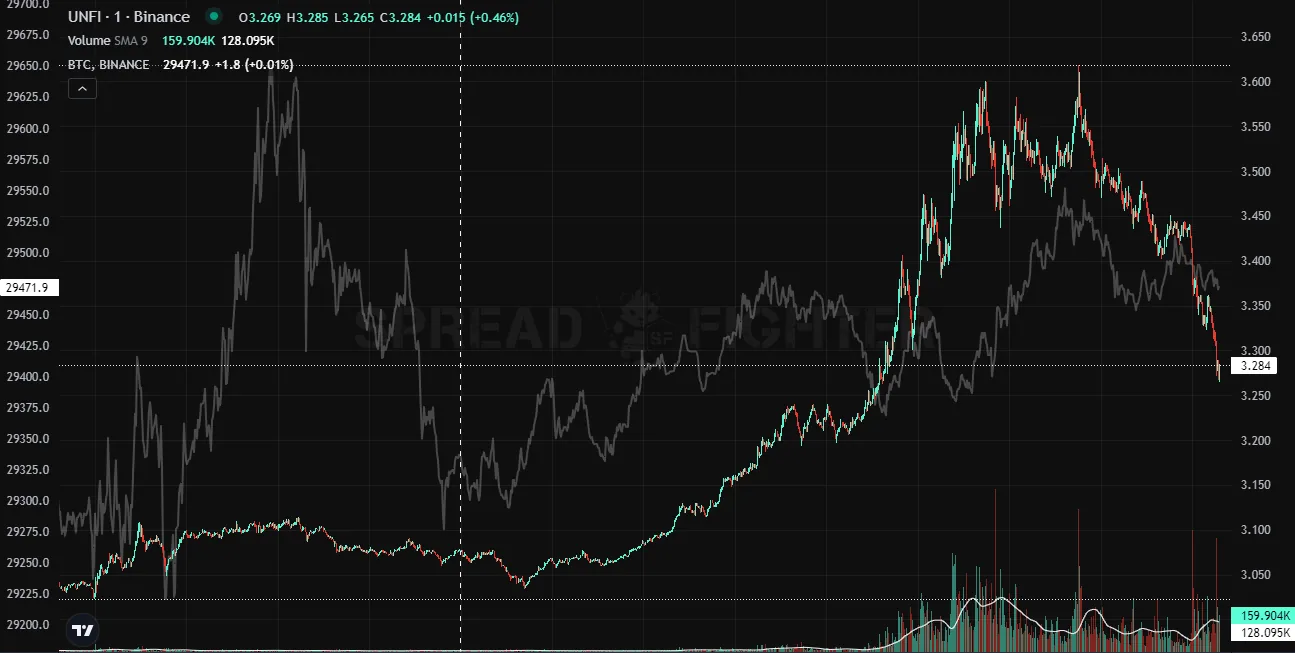
The gray chart is the BTC price
Compared charts can be customized. The user can choose:
- display type: bars, candles, hollow candles, histogram, line, area, baseline area, high-low candles. Each of these types has its own customization options, as well as color and transparency settings;
- showing/hiding the price line from the scale to the current point of the chart;
- minimum tick step;
- visibility on different timeframes.
Chart settings can be saved and later applied to Chart pane by selecting the saved template from the dropdown list in the bottom left of the customization window.

Customization window for the comparison chart.
To the right of the button for adding another coin's price chart there is the timeframe selection window.
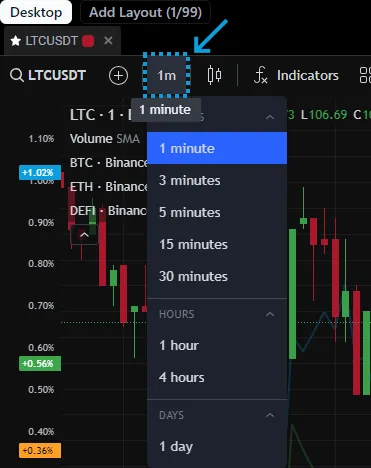
Timeframe selection window.
To the right of the timeframe selection window is the menu for choosing the display type of the main chart. The following display types are available: bars, candles, hollow candles, histogram, line, area, baseline area, high-low candles. Each of these types has its own customization options, as well as color and transparency settings.
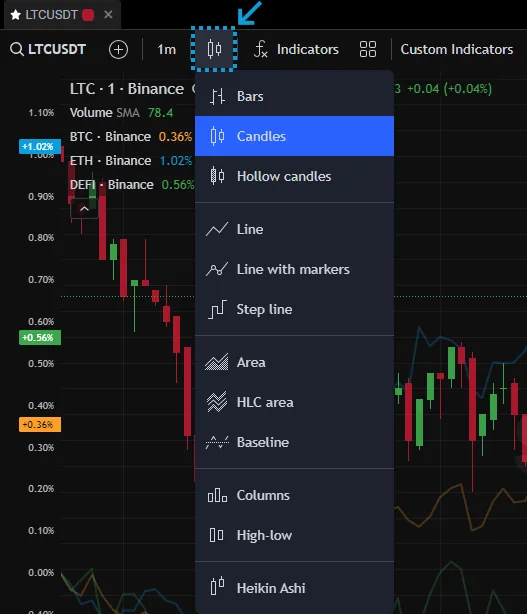
Window for choosing the display type of the main chart.
To the right of the display type window is the indicators menu.
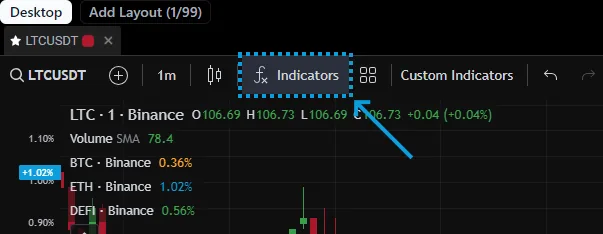
Indicators menu.
All basic technical analysis indicators are available, as well as advanced TradingView indicators (market profiles/volume profiles, etc.) and advanced SpreadFighter indicators. The user can use the search bar to quickly find the needed indicator.

Window with the list of available indicators.
The Custom indicators menu contains Cascade levels and Predict Liquidations, which replicate the functionality of the widgets of the same names.

Custom indicators.
The list of indicators will be updated as the platform develops.
The vast majority of indicators can also be customized. To open an indicator's customization, click either its chart or the gear next to its name in the Status line.
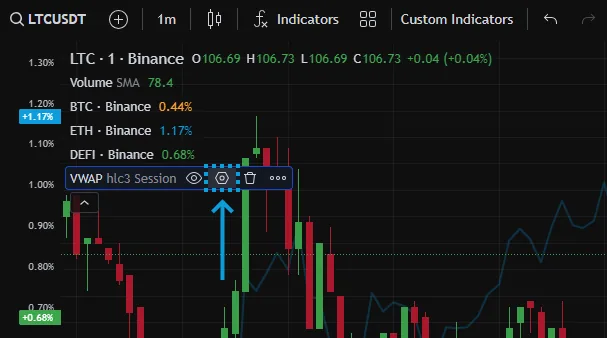
Opening the indicator customization window.
Users can set the input parameters for the calculation (optional), the graphical display, and visibility on different timeframes.

Indicator customization window.
To the right of the indicators menu is the button for saving/applying a chart template.
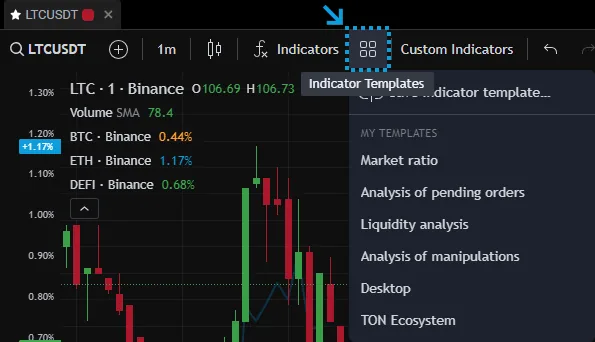
Chart pane user templates.
To the right of the user templates menu are the buttons for undoing (CTRL + Z) and redoing (CTRL + Y) the last action.

Undo and redo buttons.
In the top right corner of the screen there is the button for opening the Chart pane theme settings menu.

Button for opening the theme settings menu.
The user can set up the theme in four categories: Symbol (graphical display of the main chart), Status line (the status area in the top left of the chart), Scale (scales), Appearance (chart background).
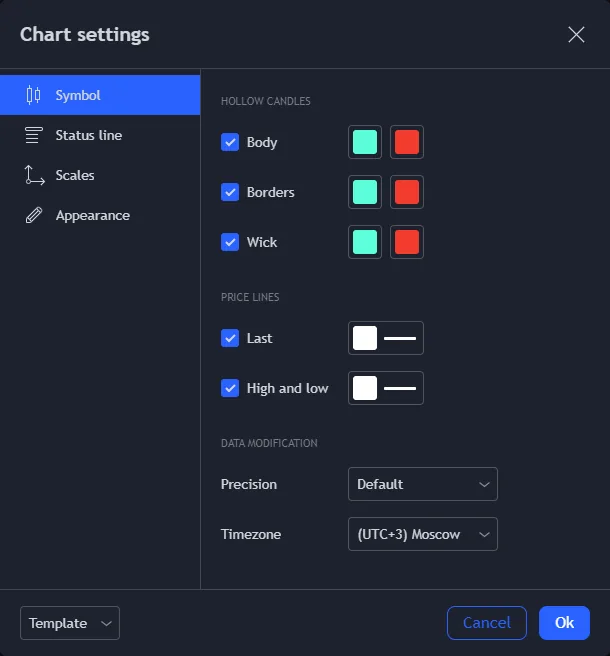
Chart pane theme settings menu
To the right of the button for the Chart pane theme customization menu is the fullscreen/windowed mode button. When you click it, Chart pane expands to the full screen, covering all other tools, or shrinks back to the widget size.
You can also expand the chart to full screen with the Shift + F shortcut.

Button for switching to fullscreen/windowed mode.
To the right of the fullscreen/windowed mode button is the button for taking a quick screenshot.

Screenshot button.
The user can:
- save the Chart pane image to their device;
- copy the Chart pane image to the clipboard;
- copy the link to the page with the Chart pane image;
- open the page with the Chart pane image in a new tab;
- publish the chart on Twitter.

Chart image export menu.
Each price scale (the vertical ones) can be customized. To open the corresponding menu, right-click the price scale you need.

Price scale customization menu.
To customize the time scale (the horizontal one), also right-click it. The user can choose the time zone and show/hide trading session borders (the same settings are available in the Chart pane theme settings menu).
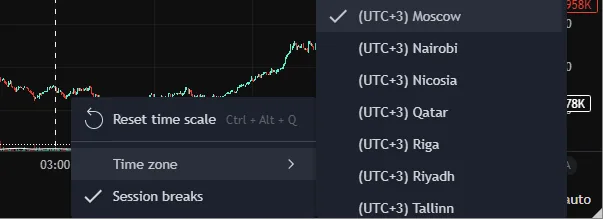
Pop-up menu for choosing the time zone.
Time zone settings and some customization options are also available through the corresponding buttons in the bottom right of Chart pane.

Choosing units and time zone.
In the bottom left corner of the screen the user can choose the period for which they want to view the quote history.

Choosing the quote display period.
You can set the period yourself, not only choose from the provided ones. To do this, click the calendar button to the right of the preset periods.

Button for switching to a custom quote display period.
Then set the start and end date and time of the period you need.
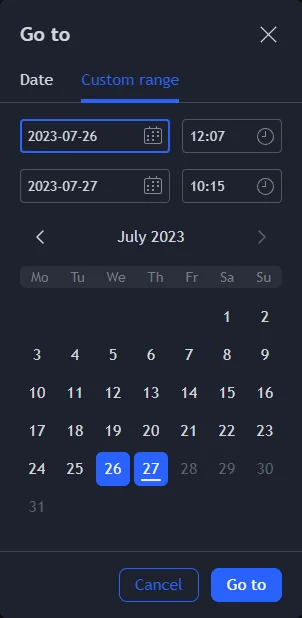
Custom period settings window.
All main TradingView drawing objects are available in Chart pane.
If the drawing toolbar is hidden, click the blue button with an arrow in the bottom left of the widget.

Button for opening the drawing panel.
In the drawing menu the user can change the look of the cursor, draw various lines and geometric shapes on the chart area, add annotations, measure distance and time, and delete all drawn objects and/or added indicators.

Chart pane drawing window.
Like all SpreadFighter tools, Chart pane can be synchronized with other tools marked with the same color. When you click a ticker in any widget, Chart pane automatically switches to that ticker.

Widget synchronization window.
SpreadFighter features on the chart
Second timeframes
On Binance futures, the timeframes 1s, 5s, 10s, 15s and 30s are available in the same menu as the minute ones. The history of second candles is stored on the server, and the current candle is built in the browser from the trade feed. Footprint also works on second timeframes.
"Range" and "Grid" buttons
On the top bar of the chart:
- Range — a cone of the expected price range one day ahead, with 50% and 80% bands. Details in the article Range (volatility cone).
- Grid — a helper for a grid bot: boundaries and the number of grids from the daily range, grid lines on the chart and its history for 14 or 30 days. With a Pionex key, the grid is launched right from here. Details: Grid bot: how many grids to set and Pionex: grids from SpreadFighter.
Chart pane settings
The icon to the left of the chart tab name opens the pane settings. They have three tabs.
General
- Toolbars — show or hide the bottom bar (timeframes), the drawing tools and the TradingView top bar.
- Crosshair sync — by price and by time between charts.
- Quick jump — charts in tab titles are numbered ❶ ❷ … ❾, Alt + 1…9 opens the one you need, the "Next chart" hotkey (Alt + Q by default) switches to the next chart, with Shift to the previous one.
- Alerts — whether to show triggered alerts in gray, where to send alerts from the "+" menu by default (Web, Telegram or both) and the Quick alert hotkey (Alt + A by default) — a price alert at the level under the cursor.
- Clone chart — a copy of the chart in a new tab next to it: the same symbol, interval, indicators, drawings and settings. After that it is a separate chart.
Trading — the trading mode on this chart and general trading settings, see Trading and order execution.
Footprint — enabling and settings of the footprint, see Footprint.
Exchanges
You can open Binance, Hyperliquid, Aster, Bybit, OKX and LMAX forex markets on the chart. The exchange is set by the symbol prefix (BYBIT:BTCUSDT, HYPERLIQUID:BTC); without a prefix it is Binance. Details in Exchanges and markets.
SpreadFighter Custom Indicators
Chart pane can visualize some SpreadFighter models directly on the chart. The visualization is implemented through indicators.
To quickly find indicators from SpreadFighter, use the keyword [SF].
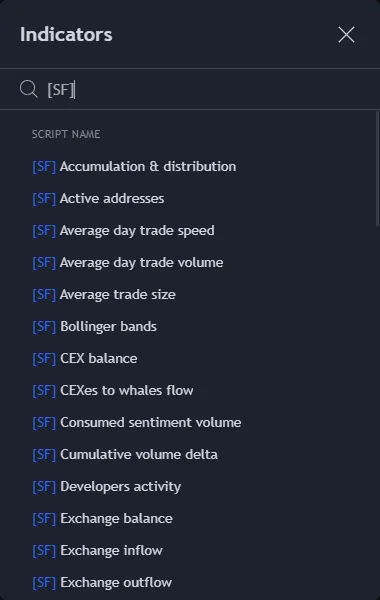
SpreadFighter custom indicators
The following subsections describe the model behind each indicator.