SpreadFighter indicators
The SpreadFighter platform can visualize some models directly on the chart through indicators. To quickly find SpreadFighter indicators, use the keyword [SF].
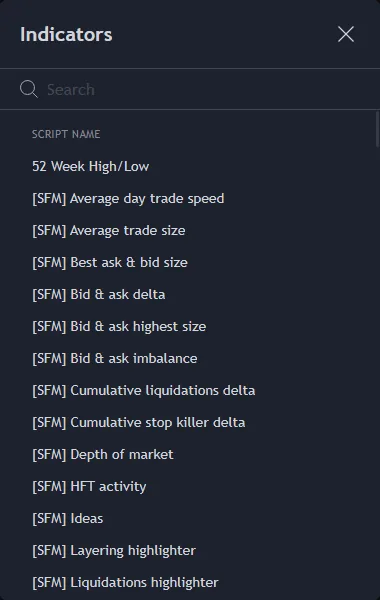
SpreadFighter custom indicators
For example, Manipulation monitor, Stop killer, and Power trades are available as indicators as well as scanners and real-time widgets, so you can evaluate historical data.
Indicators based on primary exchange data are available for analysis: Open interest, Volume delta & CVD, Spot - futures spread, DOM, and others. Some classic technical analysis indicators are reworked: Money Flow Index, Moving Average, PVI & NVI, and others.
Onchain indicators form a separate category: Active Addresses, CEX Balance, Exchange Netflow, and others. These models let you look inside each asset's blockchain for a deeper analysis.
Sentiment indicators give a quantitative estimate of market sentiment and a quick read on the fundamental background, including with neural networks and artificial intelligence: Social Volume, Sentiment Balance, Social AI Dominance, and others.
Finally, quantitative analysis indicators help you assess position risk and the risk premium more precisely: Value at Risk, Beta, CARM & SARM, and others.
Each indicator has a tag:
- SFM - microstructure;
- SFT - technical analysis;
- SFS - sentiment;
- SFQA - quantitative analysis.
Almost all indicators offer extensive customization and input parameters. Before using an indicator, review its list of input parameters.

Open interest indicator inputs.
The display of every indicator can also be configured in detail.
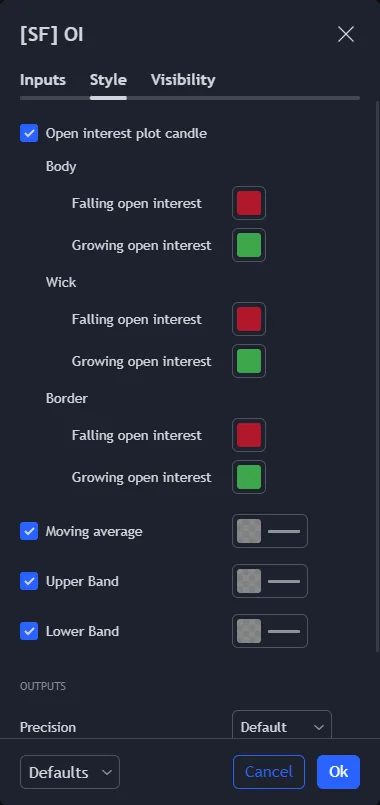
Open interest indicator display settings.
New: liquidations
Three pages about one model that predicts where forced liquidations sit. Two indicators are drawn over the candles. The screener covers the whole market at once.
- Liquidation Map — a forecast for a horizon ahead: where forced exits stand right now and how far to move a stop so a spike does not take it out.
- Liquidation Heatmap — the same model accumulated on a fixed price grid: horizontal bands of unspent fuel and a dark funnel where price has already passed.
- Liquidation Spike — a spike screener: which instrument is producing an unusually large number of liquidations right now.
None of the three shows the price direction. This was measured and disproved; see the pages for details. What they offer is "where forced exits have piled up" and "how far to place a stop".