Scanner widgets
This article describes widget functionality and how to work with widgets.
Why use widgets?
The tools, models, and solutions of SpreadFighter are presented as widgets. The user can configure them as they like and set up the workspace for a wide range of tasks.
Widgets send the user a trading signal, notify about changes in the metrics of a model, and rank assets/instruments by various indicators.
The vast majority of widgets are unified and work on a similar principle, with very few exceptions.
Widget functionality
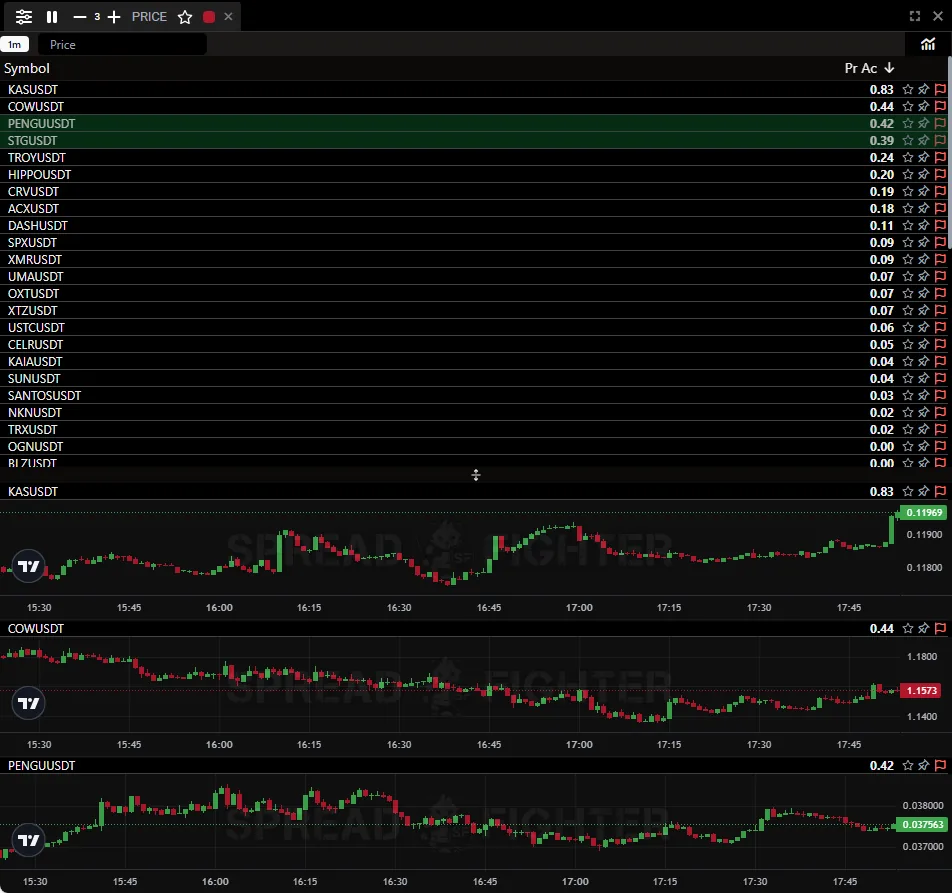
Widget appearance.
Let's look at widget functionality using the Top Gainers: Price model as an example.
Top Gainers: Price ranks instruments/assets by price change (Price Change) over a set period of time (length). This is how the leaders of price growth and decline are found.
Price change is calculated with the formula: where is the asset price and is the period of time under consideration.
Top Gainers: Price is chosen as an example because the model is simple to understand.
Widgets receive data from the backend and show it in two ways: a classic table and a visual representation as charts.
Working name: SpreadFighter Visual Snap.
At the top of each widget there is a header that contains:
- Widget settings.

Widget settings.
- A button to stop widget updates.
- Buttons to change the number of charts.
- The widget name.
- Widget sync with favorite asset lists.
- The color for syncing the widget with other widgets.
In the widget settings, you can change the number of charts shown in the visual representation of the data (Numbers of charts).

Changing the number of charts shown.
In the vast majority of widgets, you can select the data display timeframe (Interval).
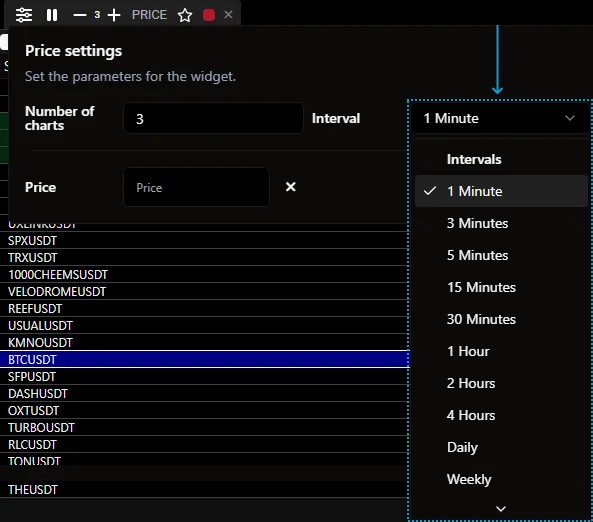
Selecting a timeframe.
You can set various filters. The set of filters is individual to each widget. By default, all filters are empty. If you fill in a filter field, the widget will not show assets whose filtered metric does not meet the filter value.
For example, for Top Gainers: Price this is a filter on the minimum price change in percent (Price). If the absolute value of an asset's price change is less than the one set in the filter, the asset will not appear in the Top Gainers: Price widget output.

Filter settings.
The widget settings also let you choose how the charts are laid out: table or "checkerboard". To turn on the "checkerboard" layout, click the "Grid layout" button.
If the user has set any filter value, a red circle lights up next to the settings button and the filter to show that a filter is active.

Active filter notification.
To stop the widget from receiving new data and freeze what it has already received, click the pause button (| |). After you click it, the widget keeps its state until you click the button that resumes data updates.
The user can change the number of charts shown by clicking - to decrease or + to increase.
Changing the number of widget charts.
Every widget can filter incoming signals by the favorites folders in Control Panel. To turn on the filters, click the star in the widget header and select one or more folders from Control Panel. To cancel folder filtering, click "× Reset filter".

Filtering by favorites folders in Control Panel.
Widgets can be synced with each other. If several widgets are synced, changing the instrument/asset in one of them changes it in all of them. To set up syncing, click the colored square in the widget header and select the sync color in the drop-down list.

Widget sync.
To expand a widget to full screen, click the button shown. Click it again to return to the standard size.
To remove a widget from the workspace, click the cross × in the widget header.

Removing a widget.
The user can change the display format of incoming signals, putting more emphasis on the table or on the charts. To do this, hold the left mouse button and drag the divider up or down. You can leave a fully table-based view or a fully chart-based view. By default, the space is split 50/50.
The widget is a table filled with various data. The data is shown in columns.
The set of columns differs depending on the selected widget. For Top Gainers: Price it is: Pr Ac - price change in percent.
Several columns are the same in widgets for all models:
- Symbol - the symbol of the instrument/asset the signal came for.
- - add the instrument/asset to a favorites list folder in Control Panel.
- 📌 - pin the incoming signal higher.
- 🏴 - add the asset to the blacklist.

Widget table header.
Above the header there is quick access to the widget filters.

Quick access to filters.
The widget header also has the timeframe selector for which signals should be sent.
The timeframe selector is not available for all models, because some models are calculated on tick data and therefore work "outside timeframes".

Selecting a timeframe.
When you click an incoming signal with the left mouse button, all widgets synced by color switch to the symbol of the instrument/asset shown in the signal. Signals with the same symbol are highlighted in blue in all widgets.
Click the star to remove the instrument/asset from, or add it to, the favorites folders in Control Panel. The "+ Add to new folder" button creates a new folder in Control Panel and automatically adds the selected instrument/asset to it.
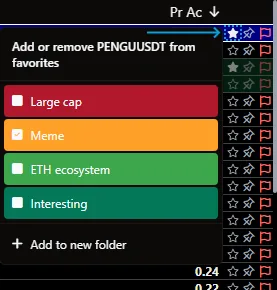
Adding to favorites.
Click the pushpin 📌 to pin the instrument/asset at the top of the widget window, and above all folders in Control Panel. Click again to unpin it.
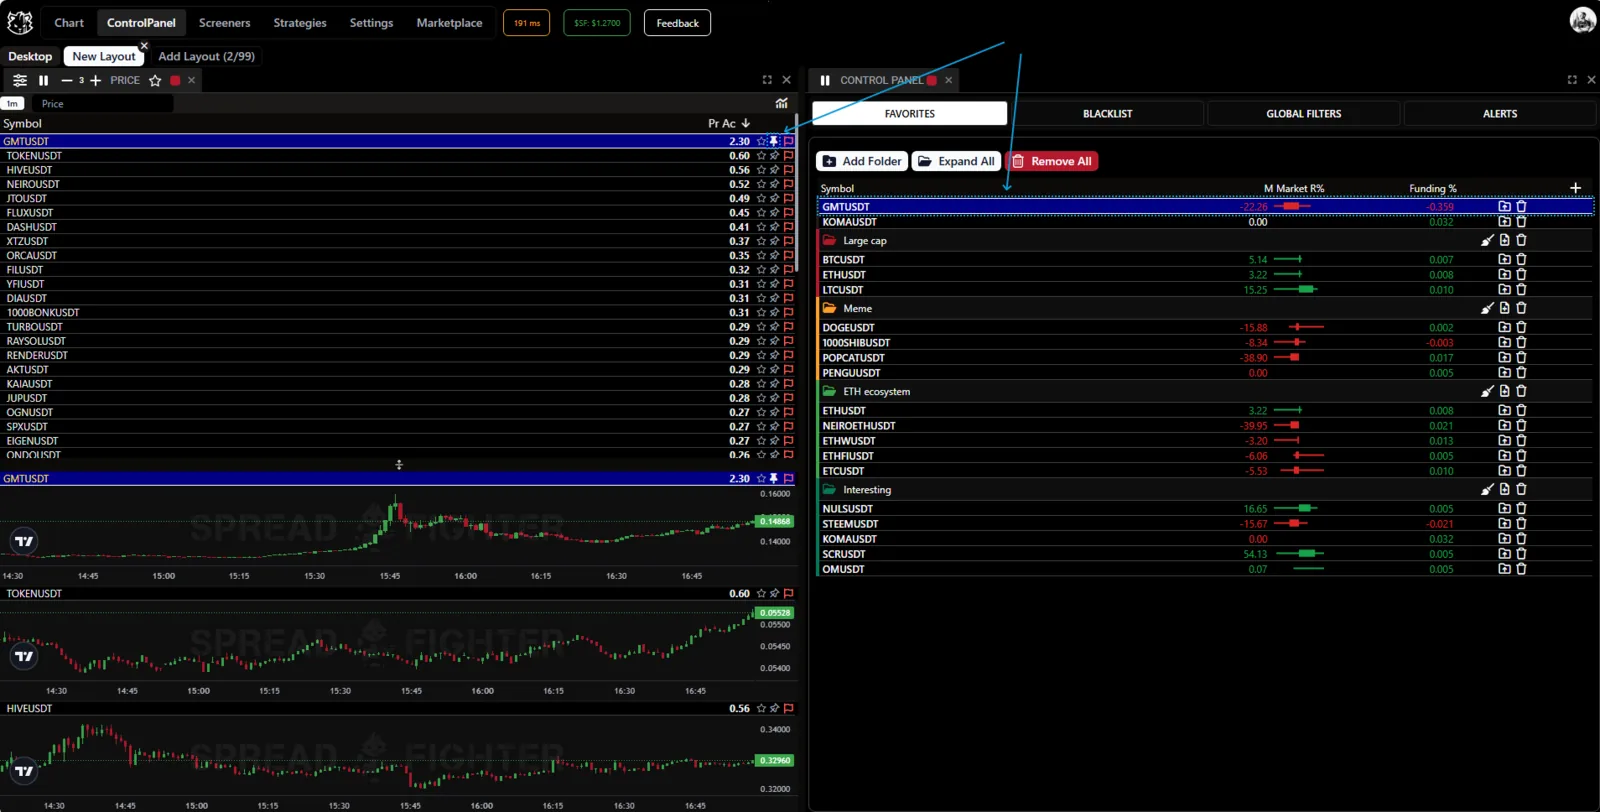
Pinning an instrument.
Click the red flag 🏴 to add the instrument to the Control Panel blacklist and remove it from indexing for all models at once. To return the asset to indexing, click the red "Remove" button in Control Panel.
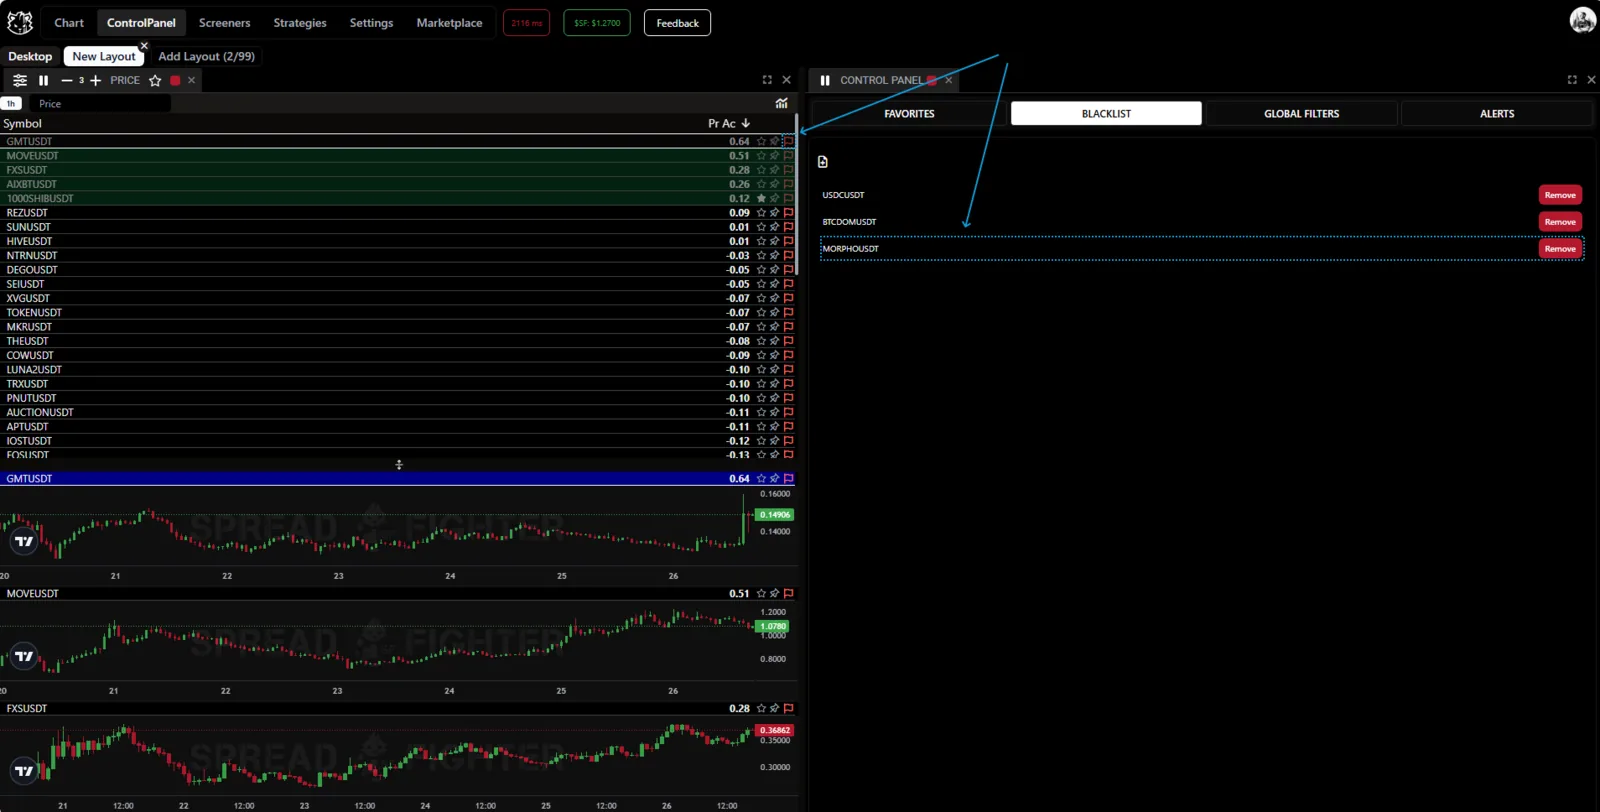
Adding to the blacklist.
For most advanced SpreadFighter models, the widget includes an indicator for that model in addition to the price chart. This makes it easier to analyze the trading situation and speeds up the trader's decision.
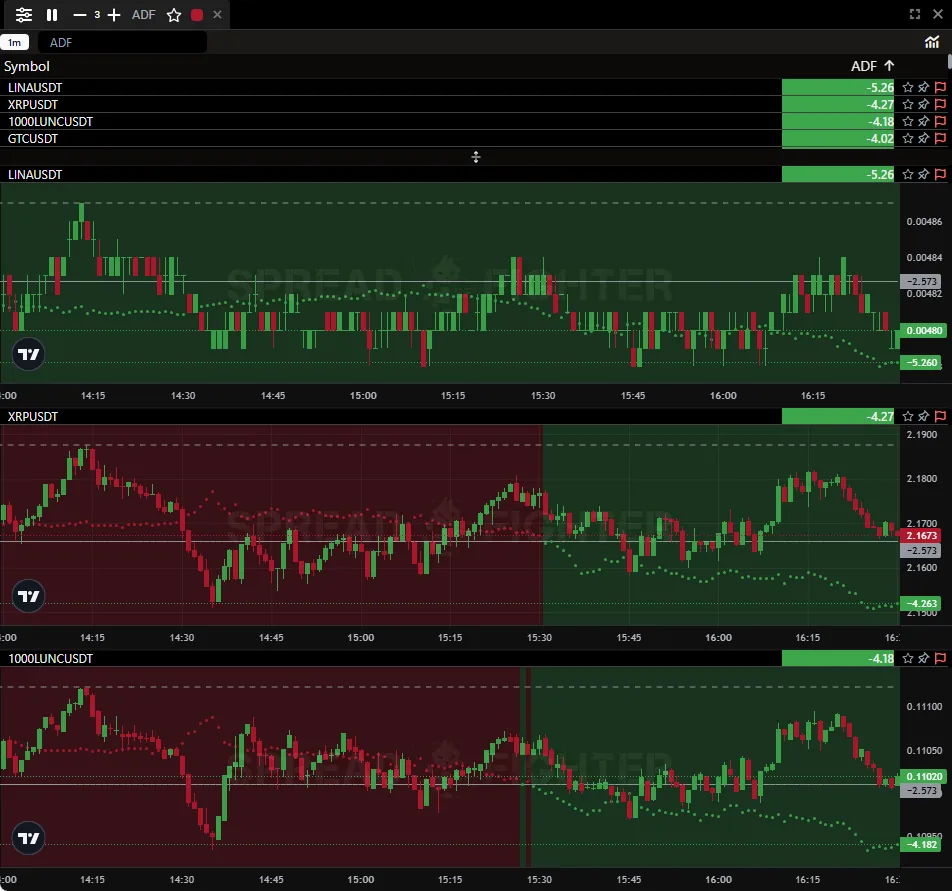
For the ADF widget, the Dickey-Fuller test indicator is added over the price chart background.
To add the model indicator to the chart windows synced with the widget, click the histogram symbol 📊 in the top right corner of the widget.