Grid bot: how many grids to set
With the same range width, a grid with a large step earns more than one with a small step. The gain does not come from a "smart" step but from fees: every extra trade pays one. On volatile coins the difference reaches 0.4% of capital per day.
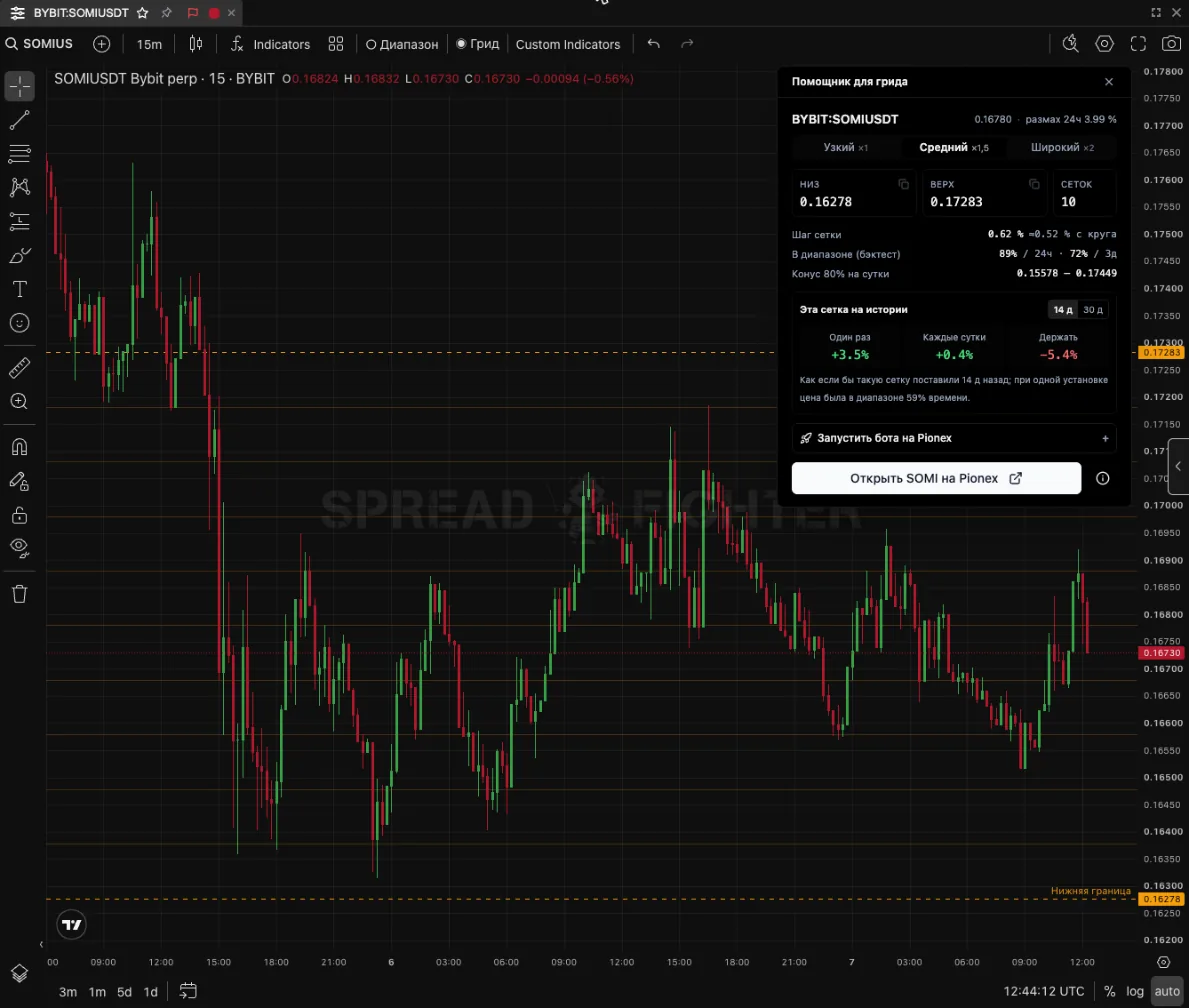
Grid helper on the SOMI chart, 7 Nov 2026: range from the daily range, 10 grids with a 0.62% step instead of 15 grids at 0.4%. Grid levels are thin lines, boundaries are dashed.
Question
A grid bot places a ladder of limit orders inside a range: it buys at every level below and sells at the next level above. The more grids in the same range, the smaller the step and the more often the bot trades.
The usual advice: set as many grids as needed so that after two fees at least 0.3% remains from each round. With a 0.05% fee, that is a step of about 0.4%. Until 7 Nov 2026, the grid helper in SpreadFighter also chose the number of grids this way. Based on the results of this research, it now suggests no more than 10 grids.
But on a volatile coin, the price moves 10–20% in a day. Why collect 0.3% hundreds of times there, if you can do it less often and in larger pieces? We checked on history which is more profitable.
Why the step barely affects earnings before fees
If the capital and the range width are the same, then with a small step:
- there are more trades, because the price crosses a neighboring level more often;
- but each level gets less money, and the step is smaller, so each trade earns less.
These two effects almost fully cancel each other. Before fees, a grid earns about the same at any step: it is the payment for the price oscillating inside the range.
The fee behaves differently: it is paid on every trade. Its share of earnings is roughly two fees divided by the step:
| Step | Share of pre-fee earnings eaten by a 0.05% fee |
|---|---|
| 0.2% | 50% |
| 0.4% | 25% |
| 1% | 10% |
| 1.7% | 6% |
Hence the expectation: wider step - smaller fee losses - higher net income. The backtest confirmed this.
Backtest
Data and method
- Period: 1 August to 6 November 2026.
- Coins: the 39 most liquid Binance perpetual futures, 3,783 runs in total.
- Run: every day at 00:00 UTC. The range is the same as the helper's "balanced" option: current price ± 1.5 daily ranges, split in half.
- Bot: a spot long grid, like Pionex. Capital is split equally between the intervals, with a 0.05% fee on every fill, including the initial buy.
- Inside a one-minute candle, the price moves open → low → high → close for a rising candle and open → high → low → close for a falling one.
- Held for 24 hours, the result is marked at the market price at the end.
- Only the number of grids changes, everything else is the same.
- August–September is the tuning period, October–November is the check. The rules were not changed in the second period.
Result by number of grids
Return compared with 20 grids in the same range, in hundredths of a percent (bp) of capital per day. Coins are split into three equal groups by volatility on the eve of the run.
| Grids | Calm | Medium | Volatile | Trades per day on volatile |
|---|---|---|---|---|
| 5 | +18 | +15 | +20 | 1 |
| 8 | +15 | +13 | +19 | 4 |
| 10 | +13 | +11 | +13 | 7 |
| 15 | +6 | +6 | +7 | 15 |
| 20 | 0 | 0 | 0 | 27 |
| 30 | −12 | −11 | −13 | 60 |
| 50 | −31 | −33 | −37 | 157 |
| 100 | −63 | −73 | −86 | 542 |
| 150 | −83 | −99 | −120 | 1,052 |
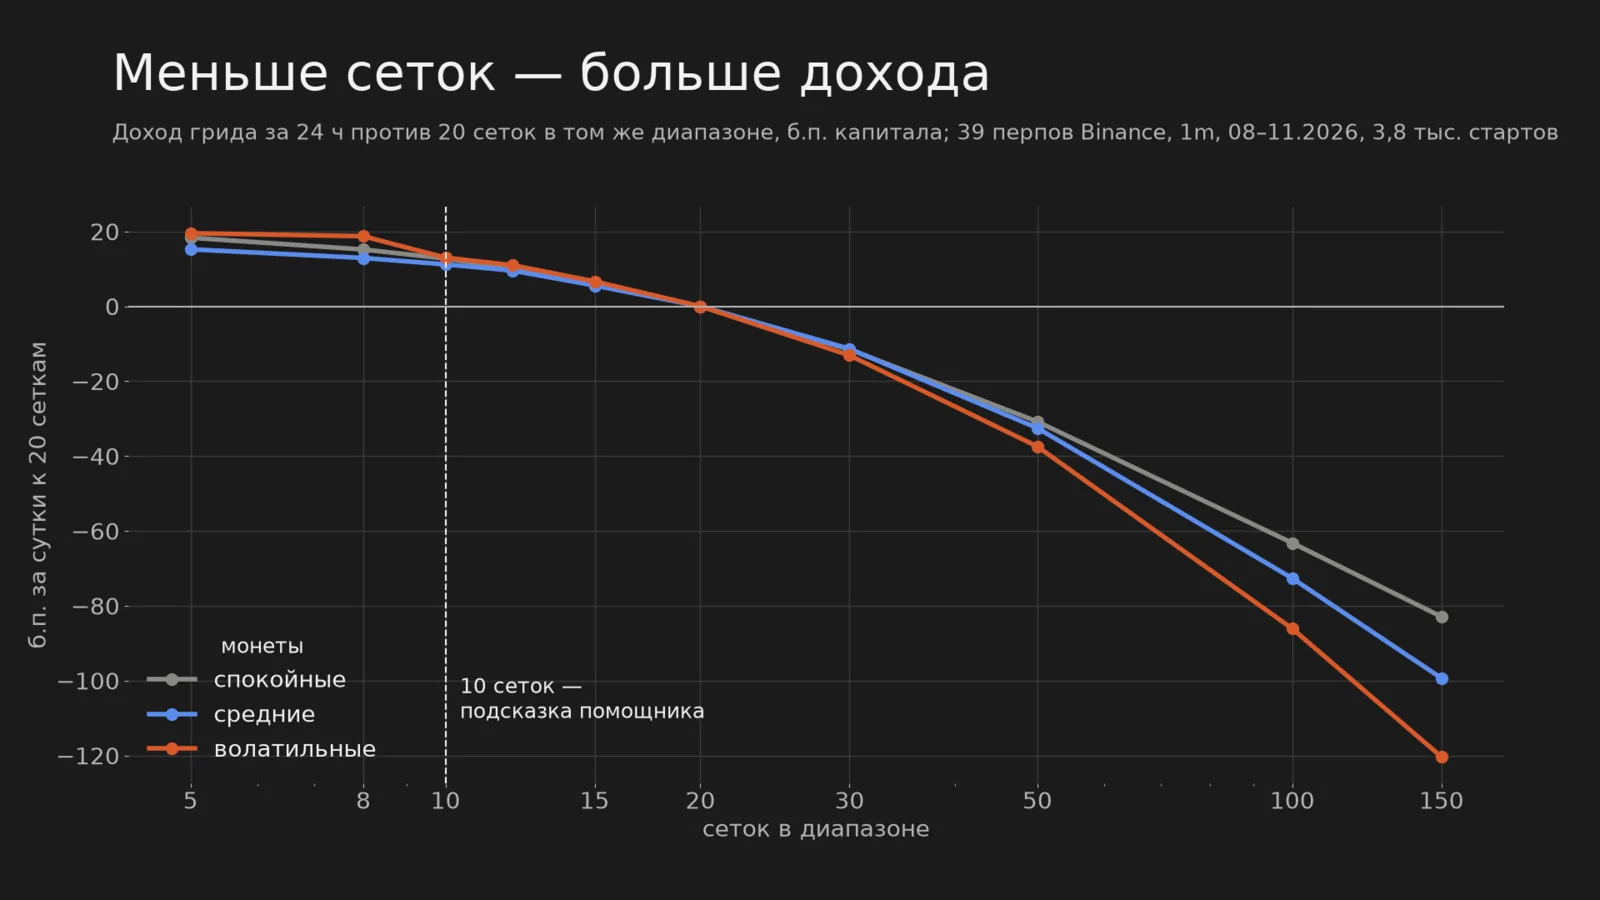
Grid return vs 20 grids in the same range: the fewer the grids, the higher the return, in every group of coins.
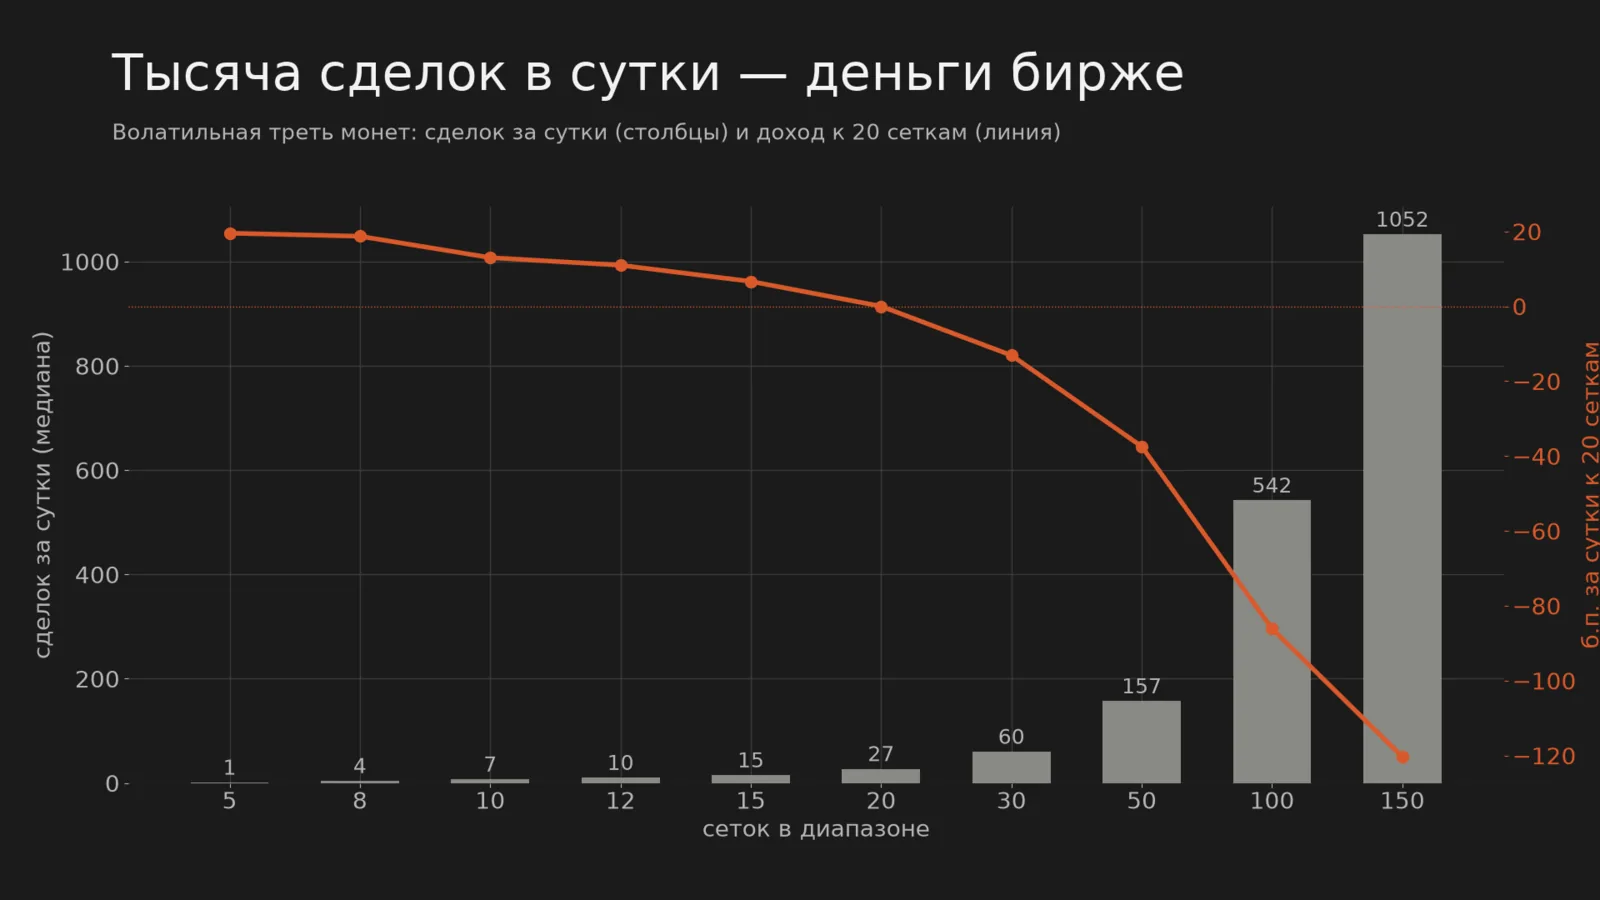
Volatile coins: 150 grids give more than a thousand trades per day, and each one pays a fee.
- The fewer the grids, the higher the return. This holds in all three groups, in the tuning period and in the check period.
- The spread of daily results barely changes: 4.1–4.4% on volatile coins at any number of grids. The higher return is not bought with higher risk.
- 150 grids on a volatile coin means more than a thousand trades per day and −1.2% of capital per day on extra fees alone.
Compared with a 0.4% step
The rule "step of at least 0.4%, but no more than 10 grids" against a constant 0.4% step:
| Coin group | Step under the rule | Gain, Aug–Sep | Gain, Oct–Nov |
|---|---|---|---|
| Calm | ≈ 0.43% | +2 bp | +2 bp |
| Medium | ≈ 0.9% | +11 bp | +13 bp |
| Volatile | ≈ 1.7% | +54 bp | +38 bp |
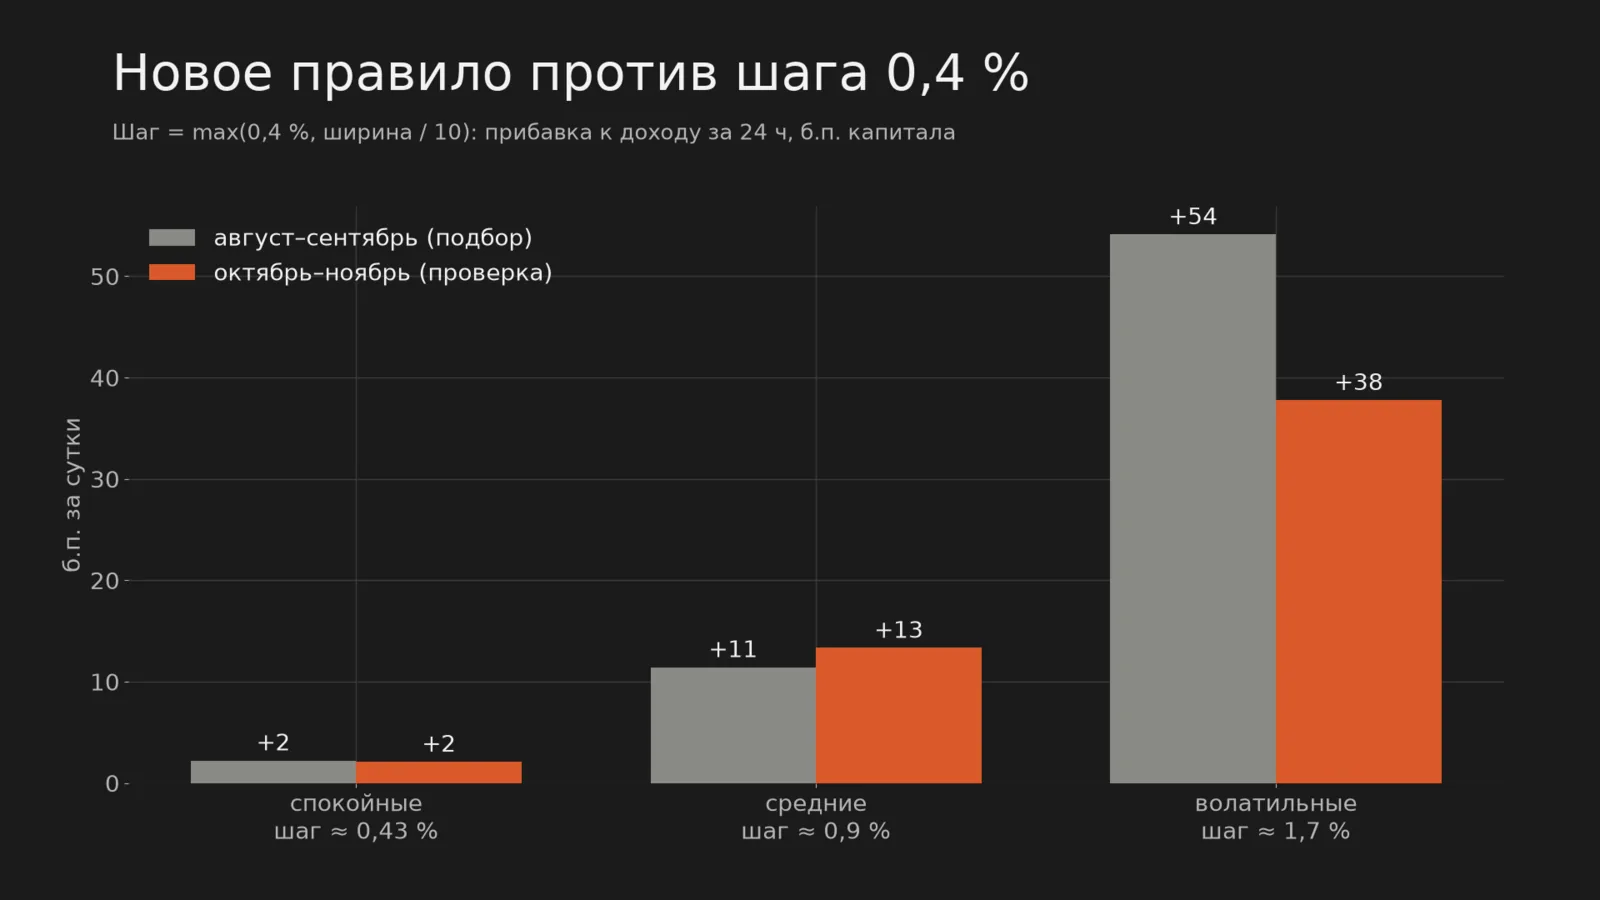
The rule "step of at least 0.4%, no more than 10 grids" vs a constant 0.4% step: there is a gain both in the tuning period and in the check.
On calm coins the range is narrow, and 10 grids already give a step of about 0.4%, so there is almost no difference. On volatile coins the step grows to 1.5–2%, and the gain is about 0.4–0.5% of capital per day.
The step adjusts to volatility by itself: the range width is taken from the daily range, and the step equals the width divided by the number of grids. A separate formula based on volatility is not needed. We checked that too (step proportional to the average range of a one-minute candle): the larger the coefficient, the better, and the best variants run into the same 10 grids.
Why not 2–3 grids
Very few grids is no longer a grid:
- with one grid, the bot holds cash almost all day and waits for the price to reach the lower boundary. In the first run, this variant "won", but only because the market fell in October and the bot did not hold the coin;
- from 10 down to 5 grids the gain is small (+5 bp), while the share of days when the result is worse than with 20 grids grows from 21% to 30%;
- with 5 grids, the bot makes 1–2 trades per day, and the outcome depends heavily on a single random reversal.
So a reasonable middle is about 10 grids.
How to apply
- Choose the range from the daily range. The Grid helper on the chart (the "Grid" button) does this itself and immediately picks the number of grids by the rule in step 2.
- Set about 10 grids. If at 10 grids the step comes out below 0.4%, reduce the number of grids so that the step is at least 0.4%. Simply put: step = the larger of 0.4% and the range width divided by 10.
- Do not chase the number of trades. Many trades in the bot report look like active work, but they pay fees. Hundreds of small rounds on a volatile coin is money for the exchange, not for you.
- Higher fee - even fewer grids. If your fee is above 0.05%, the benefit of a large step grows.
Screener "Grid 14 / 30 days"
The screener shows what would have happened to a grid bot on each of the 150 Binance perpetual futures with the highest turnover over the last day, if it had been placed 14 or 30 days ago using the helper's rules. Open it from the menu "Screeners → Market Structure → Grid 14 / 30d history". It is available on all plans.
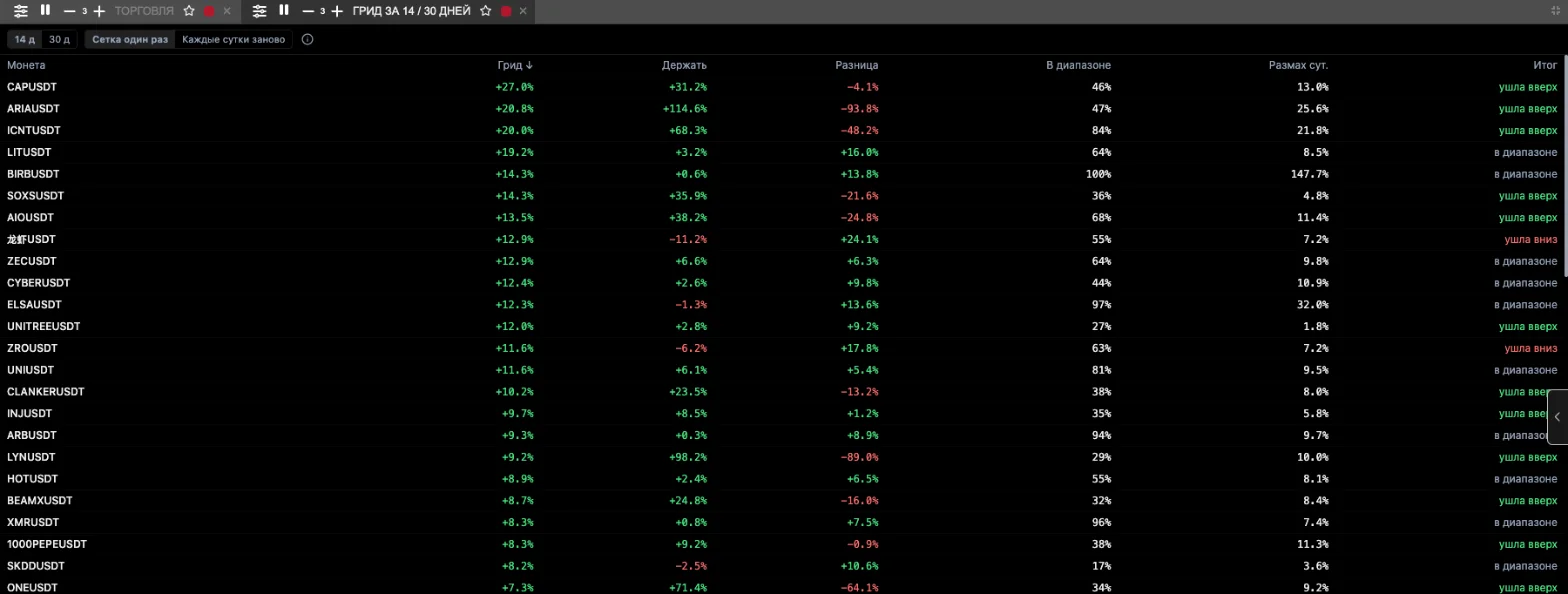
Grid 14 / 30 days screener, 7 Nov 2026: 14-day window, grid set once.
The calculation rules are the same as in the helper: range = current price ± 1.5 of the daily range split in half, step of at least 0.4% and at most 10 grids, fee 0.05%, spot long grid. The calculation runs on 5-minute candles, and the server recalculates the table every 5 minutes.
| Column | What it shows |
|---|---|
| Grid | Grid return over the window |
| Hold | Return of simply holding the coin over the same period |
| Difference | Grid minus hold: a plus means the grid beat holding |
| In range | Share of time the price was inside the grid |
| 24h range | Price range over the day before the grid start; the range was chosen from it |
| End | Where the price is at the end of the window: in range, broke up or broke down |
Modes:
- Grid set once — the grid is placed at the start of the window and does not move.
- Reset daily — every 24 hours the bot is closed (the coin is sold at market with a fee) and placed again around the new price. The price almost always stays in range, but every pullback is locked in as a loss.
Click a row to switch the chart to that coin. Then the "Grid" button opens the helper with the same grid, and it shows the grid's history over 14 or 30 days.
This is history, not a forecast. In our study no feature predicted grid returns for the following days, so the screener does not rank coins by where to place a bot. Volatile coins win more often, but with a heavy tail of losses. The "Difference" column shows the main thing: whether the grid beat simply holding.
Limitations
- The calculation uses one-minute candles. Oscillations inside a minute are not visible, and they help small grids slightly. On 5-minute candles the gain from a large step was about 15% larger than on one-minute ones, so it shrinks as data gets finer but does not disappear.
- Slippage is not accounted for. For a grid on limit orders it is small, and with a large step it is smaller.
- A grid overall remains a sale of volatility. In our earlier research, on average it did not beat simply holding the coin: when the price moves strongly beyond the range, the loss is larger than the earnings from oscillations. A large step lowers fee costs, but does not remove this risk.
- The horizon is one day and one period, August–November 2026. The mechanics (a fee on every trade) do not depend on the market, but the exact gain numbers depend on the volatility of the period.