Market Ratio
A tool that tracks the deviation of asset prices from overall market conditions.
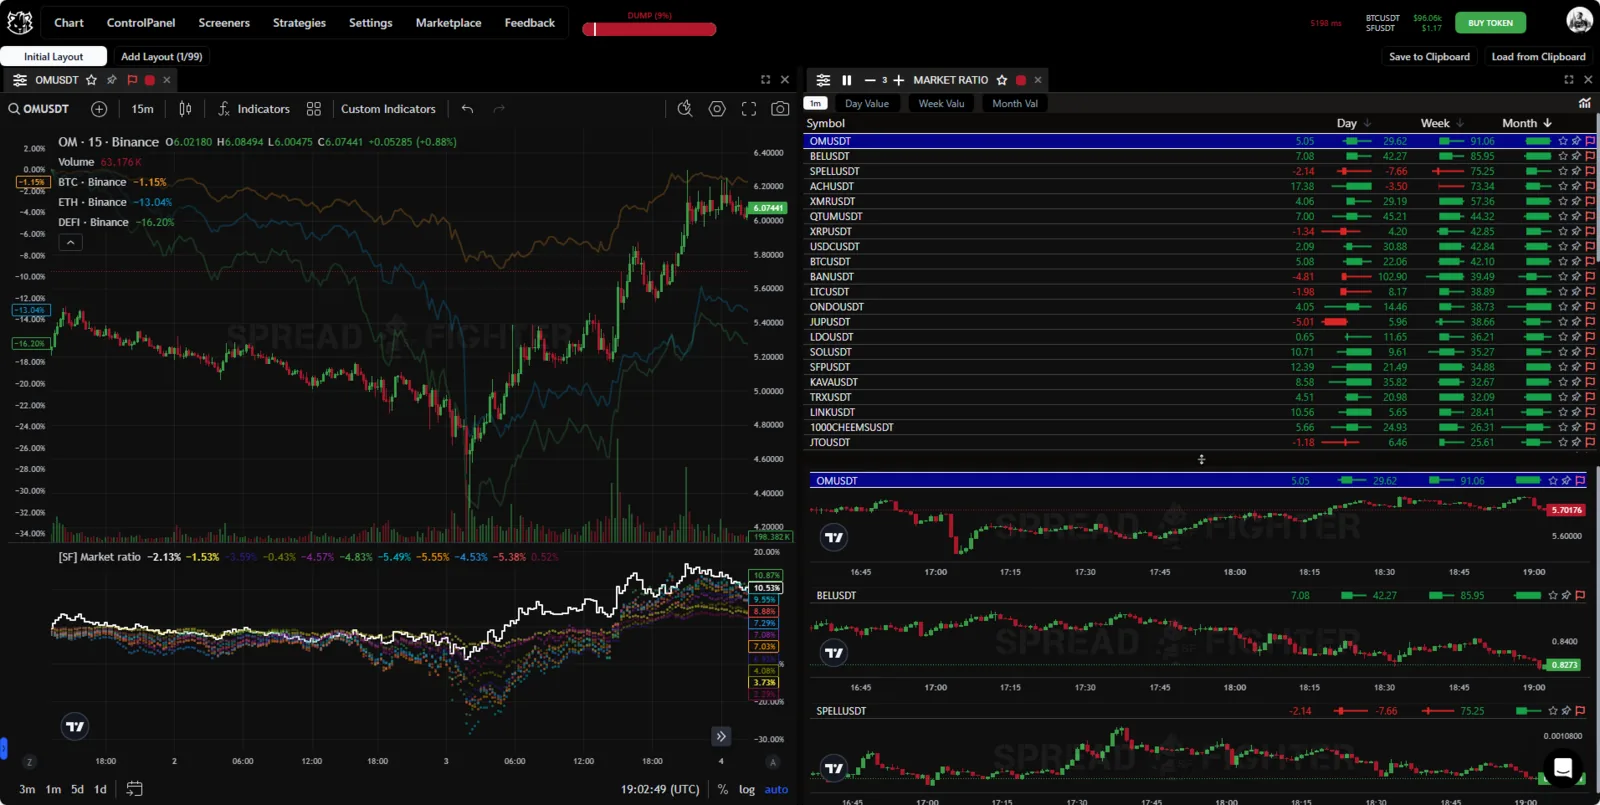
Widget appearance.
Model Description
The model calculates the percentage deviation between an instrument and the moving average of the percentage change of all futures contracts over a period of 24 hours (upper value) and 168 hours (lower value). All futures contracts are used except the DEFI index, BTCDOM and BUSD instruments.
Let us look at how the values are built in more detail. The chart shows the rolling price deviations of various instruments over a 24-hour period.
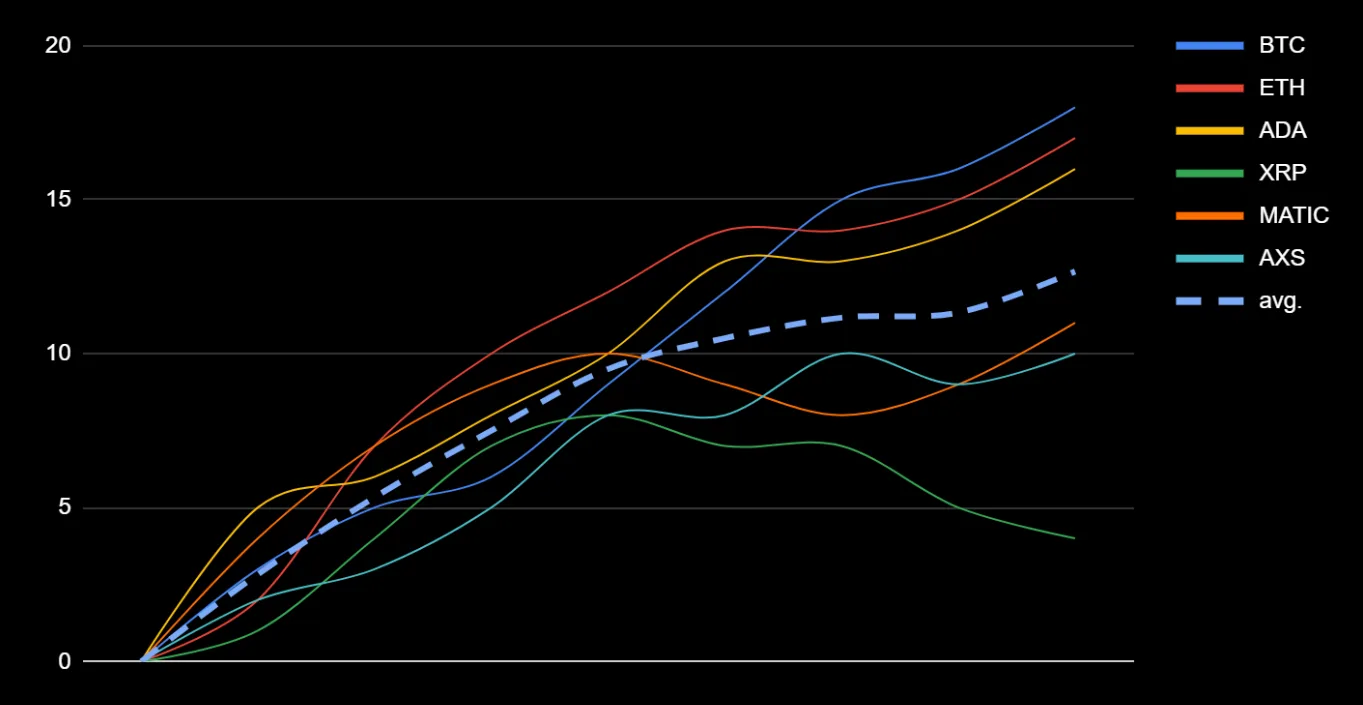
Chart of deviations of individual assets and the market-average deviation.
The avg. value is the average of all the instruments shown. It is the zero point for the Market ratio indicator.
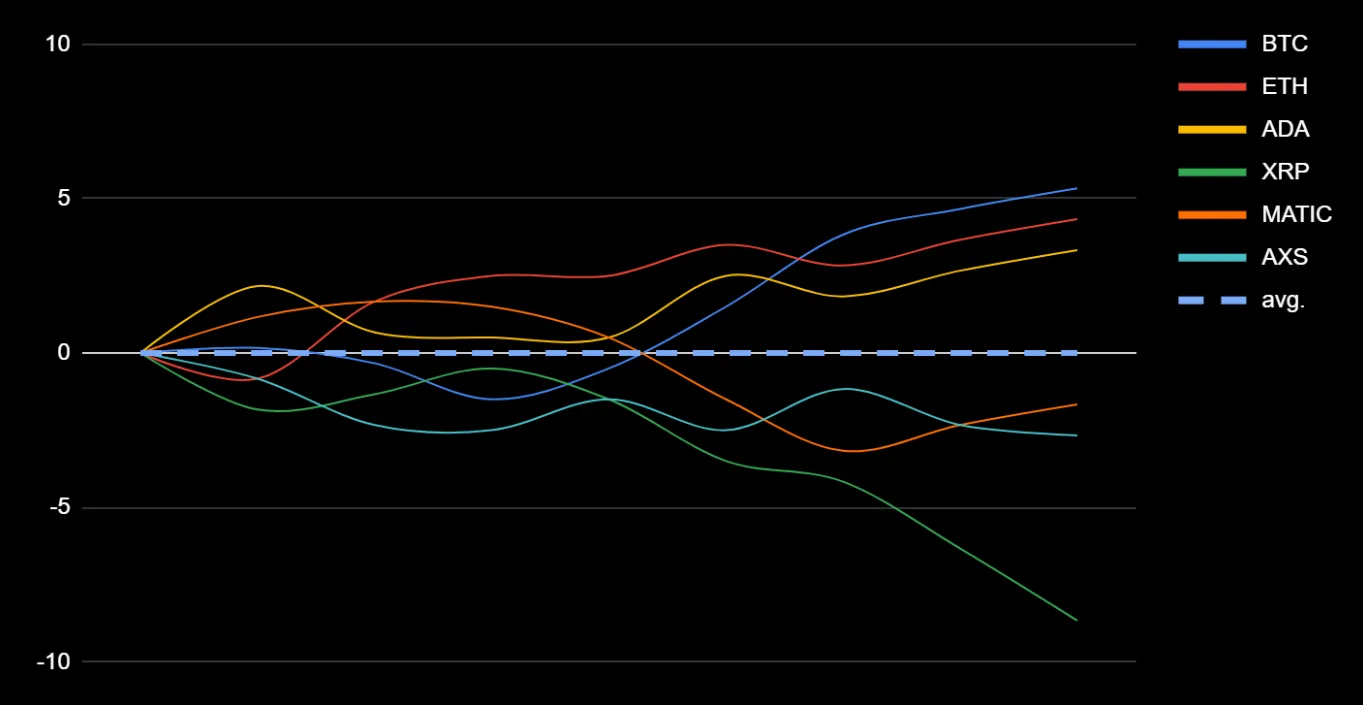
Normalized deviation chart.
Instruments above the average are green, and those below the average are red.

Market ratio value for individual assets.
The 168-hour value of the indicator is calculated and plotted in the same way.
Location
To add the "Market Ratio" tool to your workspace, first click the "Widget menu" button in the platform header. Then click the button of the same name in the "Market Overview" section.
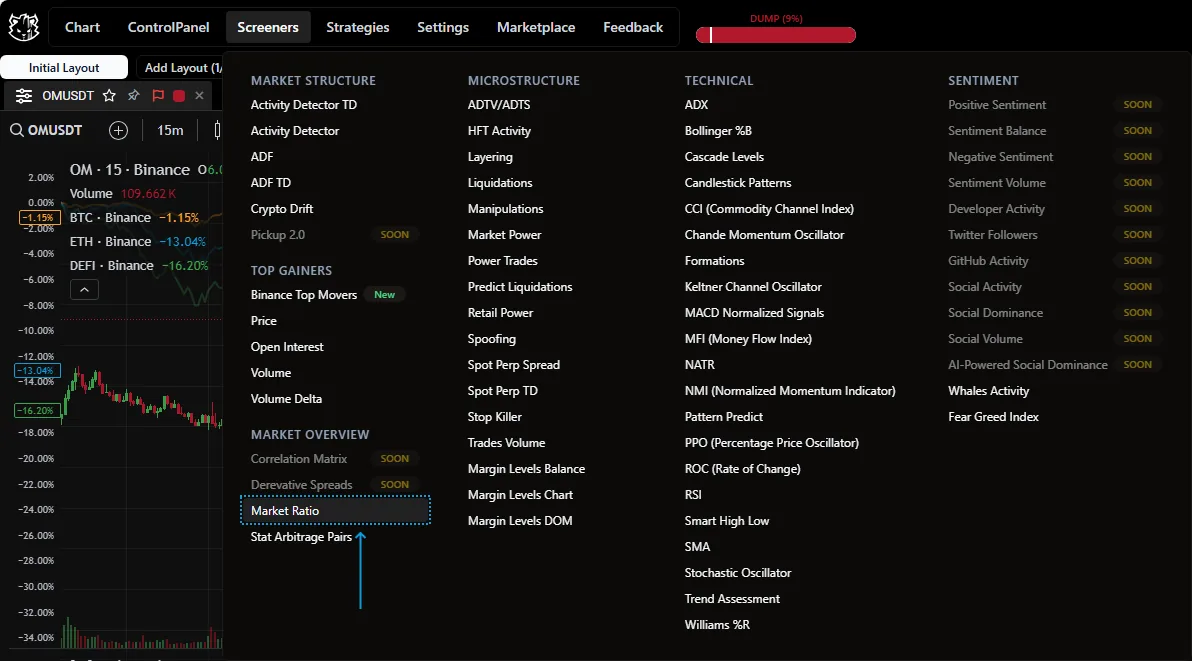
Widget location.
Tool Functionality
Indicator
The indicator is an oscillator that shows the deviation of the asset price from its 24-hour average. The white line is the asset open on the chart, and the colored lines are 10 other symbols.
The user can choose which symbols to display. By default, the TOP 10 assets by market capitalization are selected.
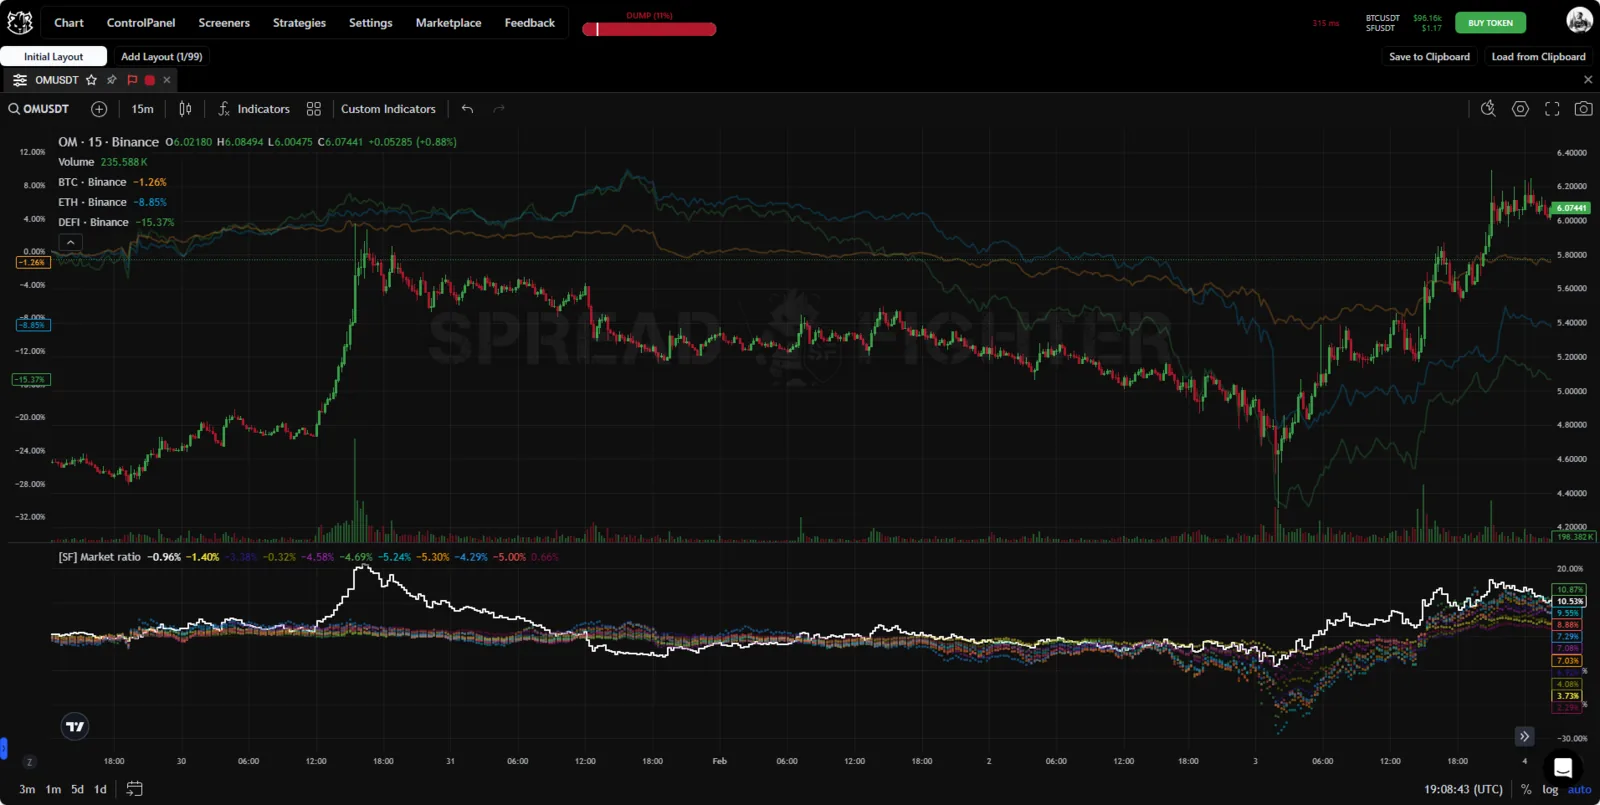
Widget
The widget is a structured table that shows the deviations of asset prices from overall market conditions. Positive values are sorted in descending order.
You can sort by time: track deviations over a day or a week.
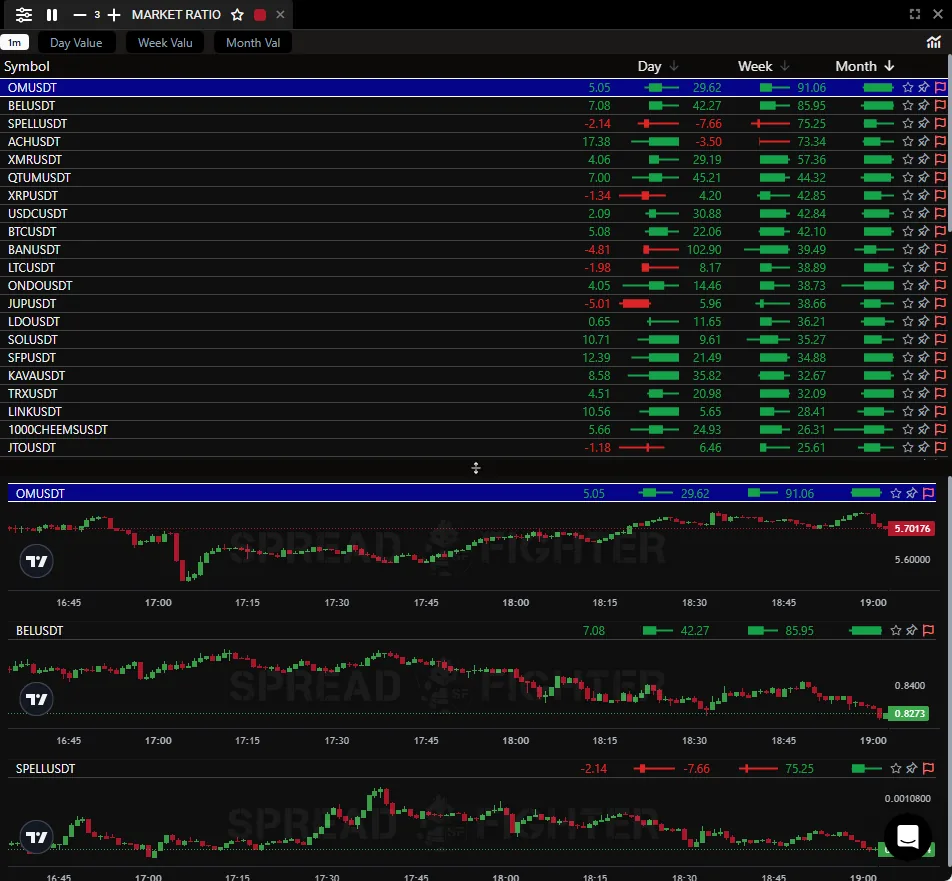
Market Ratio.
The table shows:
- Day - the asset's deviation over one day,
- Week - the asset's deviation over a week,
- Month - the asset's deviation over a month.
Incoming signals can be filtered by the metrics above.
Use Cases
The widget can be used for:
- Determining whether an asset is overbought/oversold in the light of overall market conditions, which may point to a possible price change.
- Selecting assets for building synthetic positions.
- Finding trading situations with heightened participant activity.
- Comprehensive analysis of market structure.
Thus Market ratio clearly shows the position of each asset in the context of market conditions. However, the tool is not a self-sufficient trading model. Market ratio shows its full value only together with other tools and the trader's strategy.