Pump Trend
The model shows how sharply a coin has moved up or down over the last few hours. Green highlighting means "the pump has already happened", not "a pump is starting".
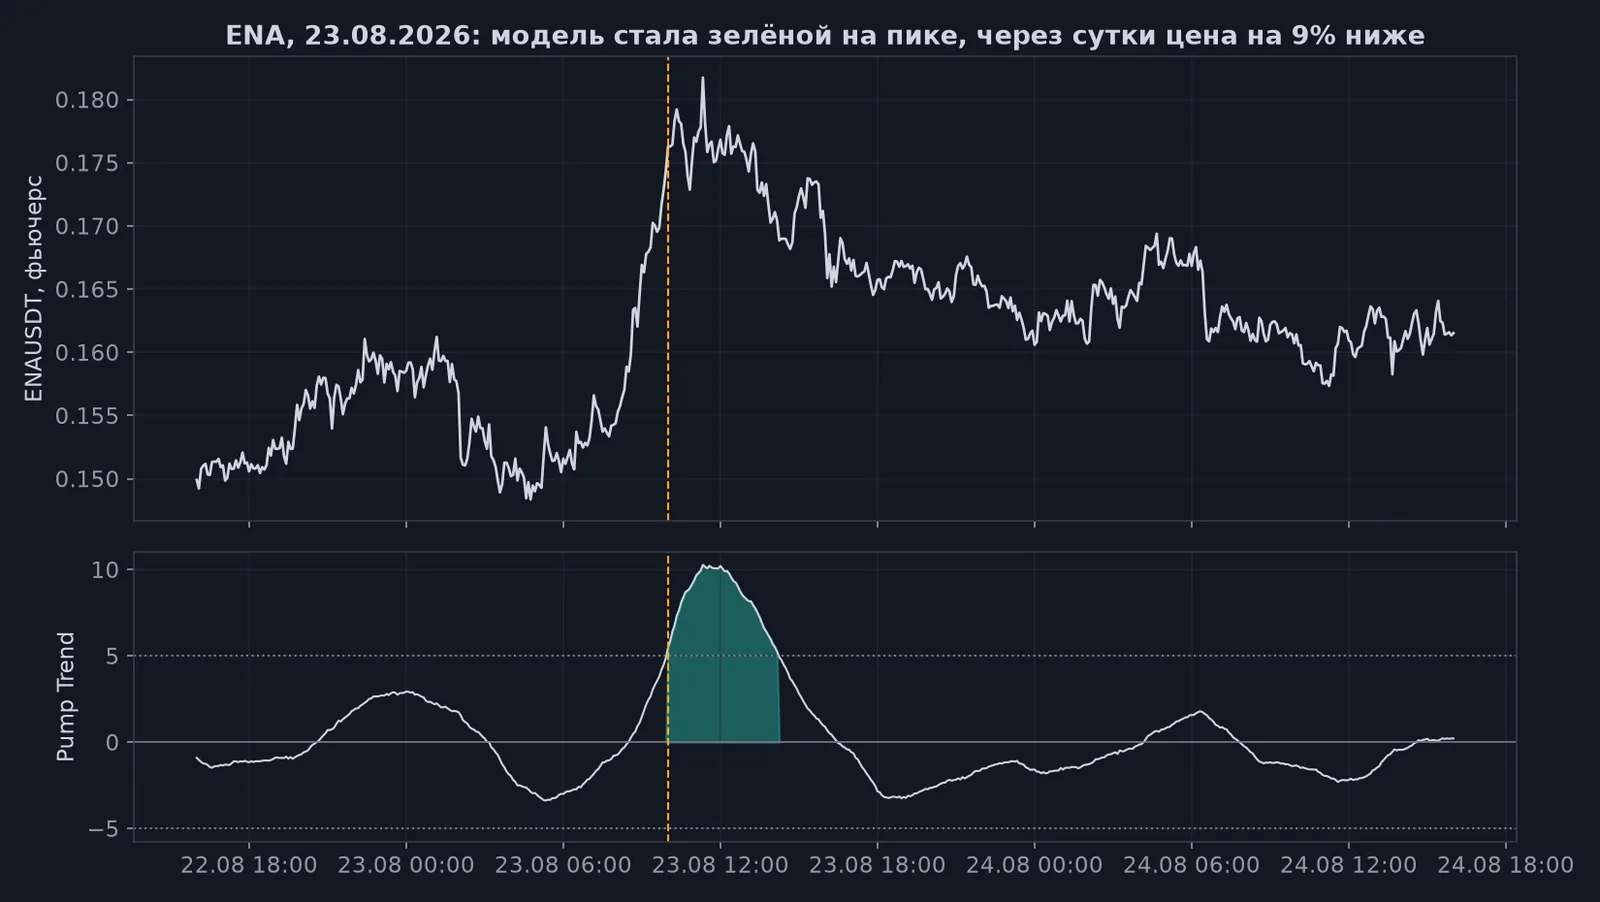
ENA, 23 Aug 2026: the model turned green at the peak of the move, and a day later the price is 9% lower.
Description
Pump Trend is available in two forms:
- the [SF] Pump trend indicator on the chart: a line and background highlighting;
- the Pump Trend widget: a table with all coins and the current model value. It is convenient for sorting and for finding the strongest moves.
The model is calculated on the server from Binance one-minute candles: the USDT perpetual futures and the spot market of the same coin. So Pump Trend includes only coins that have both futures and spot on Binance, currently about 370 coins. The value is recalculated every second and saved to history once a minute. On higher timeframes, the last value of the interval is used.
Formula
Two quantities are calculated:
- The deviation of the futures price from its average over 550 minutes (about 9 hours):
- The deviation of the spot price from its average over 135 minutes (about 2 hours 15 minutes):
Pump Trend is their difference:
The value is measured in percent. The calculation uses the current, not yet closed candle.
Colors
| Value | Highlighting | What it means |
|---|---|---|
| above +7 | bright green | very strong rise over the last few hours |
| from +4 to +7 | from pale green to green | strong rise |
| from −4 to +4 | none | normal market: 98% of all values are here |
| from −7 to −4 | from pale red to red | strong fall |
| below −7 | bright red | very strong fall |
The ±5 threshold is also used in the signal feed: it includes coins whose absolute value is greater than 5. On average, this gives 15–20 new threshold crossings per day across the whole market.
What the model actually measures
The futures and spot prices of one coin are almost always close to each other, so the formula can be split into two parts:
- trend: the difference between two averages of the futures price, a short one (135 minutes) and a long one (550 minutes). When the short average is above the long one, the price has recently risen sharply;
- basis: how far the futures price has deviated from spot at the moment.
We recalculated the model on historical data and compared it with what production showed. The reconstruction matches production values with a correlation of 0.99. The trend accounts for 97.5% of all variability of the value, and the basis for about 2.5%.
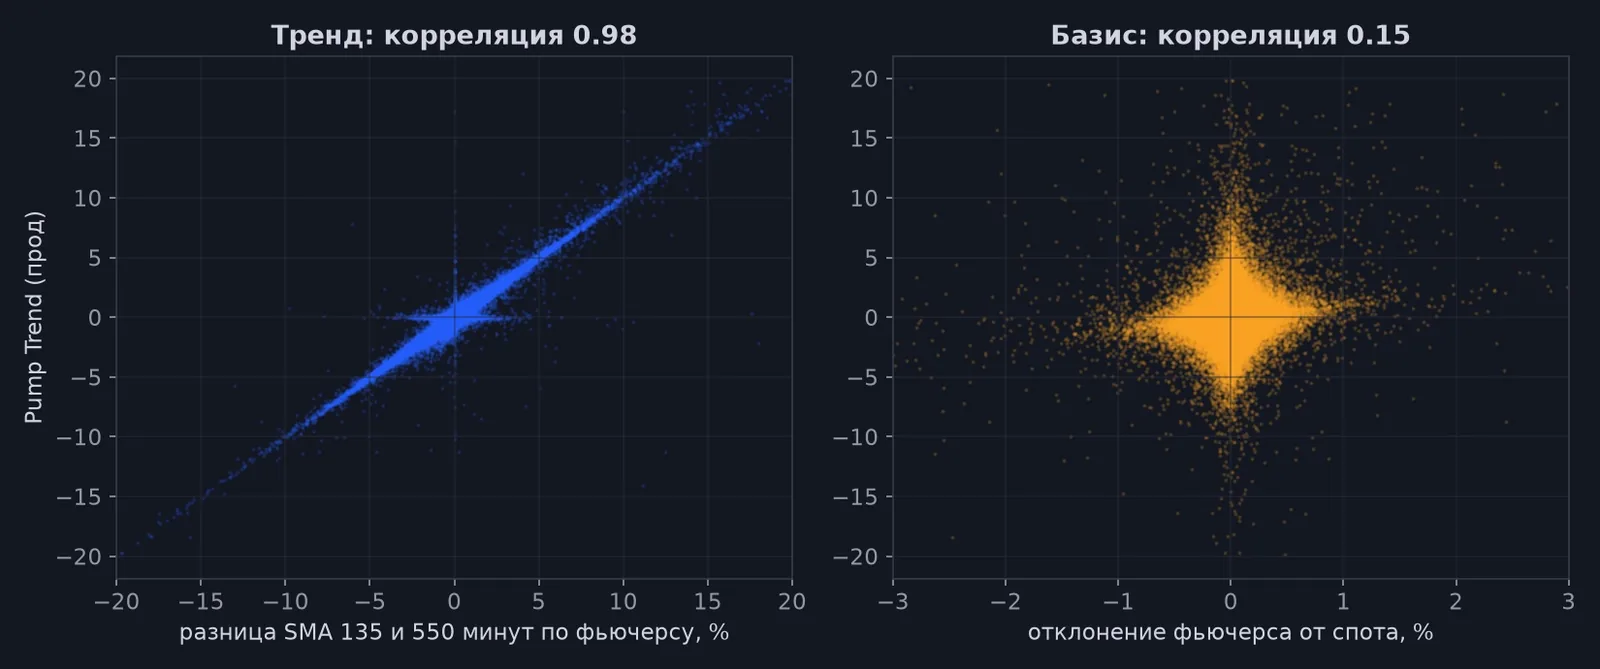
Left: the model value is almost entirely explained by the difference between the 135- and 550-minute averages. Right: the contribution of the futures-spot divergence is visible only at the moment.
In practice, Pump Trend is a crossover oscillator of two averages, over ~2 and ~9 hours on one-minute candles, expressed in percent. A value of +5 means that the average of the last 2 hours is 5% above the 9-hour average. This happens only after a sharp move, so the model confirms that the move has already happened and does not predict it.
Backtest
Data and methodology
- Period: 1 December 2025 to 27 September 2026, almost 10 months.
- Coins: 393 Binance perpetual futures for which the model was calculated in production.
- Model values: the ones users actually saw, taken from production history, not a recalculation.
- Signal: the value crosses +5 from below (green) or −5 from above (red). A repeat signal for the same coin in the same direction comes no sooner than 4 hours later.
- Entry: at the close of the next 5-minute futures candle after the signal, that is, with a delay of about 5 minutes.
- Returns are calculated net of the BTC move to remove the overall market.
- Split: December to April is the research period, May to September is the out-of-sample check. The rules were not tuned in the second period.
- Values greater than 1000 in absolute terms are removed from the data. This is a calculation error after a spot delisting, see the "Limitations" section for details.
What happens to the price after the signal
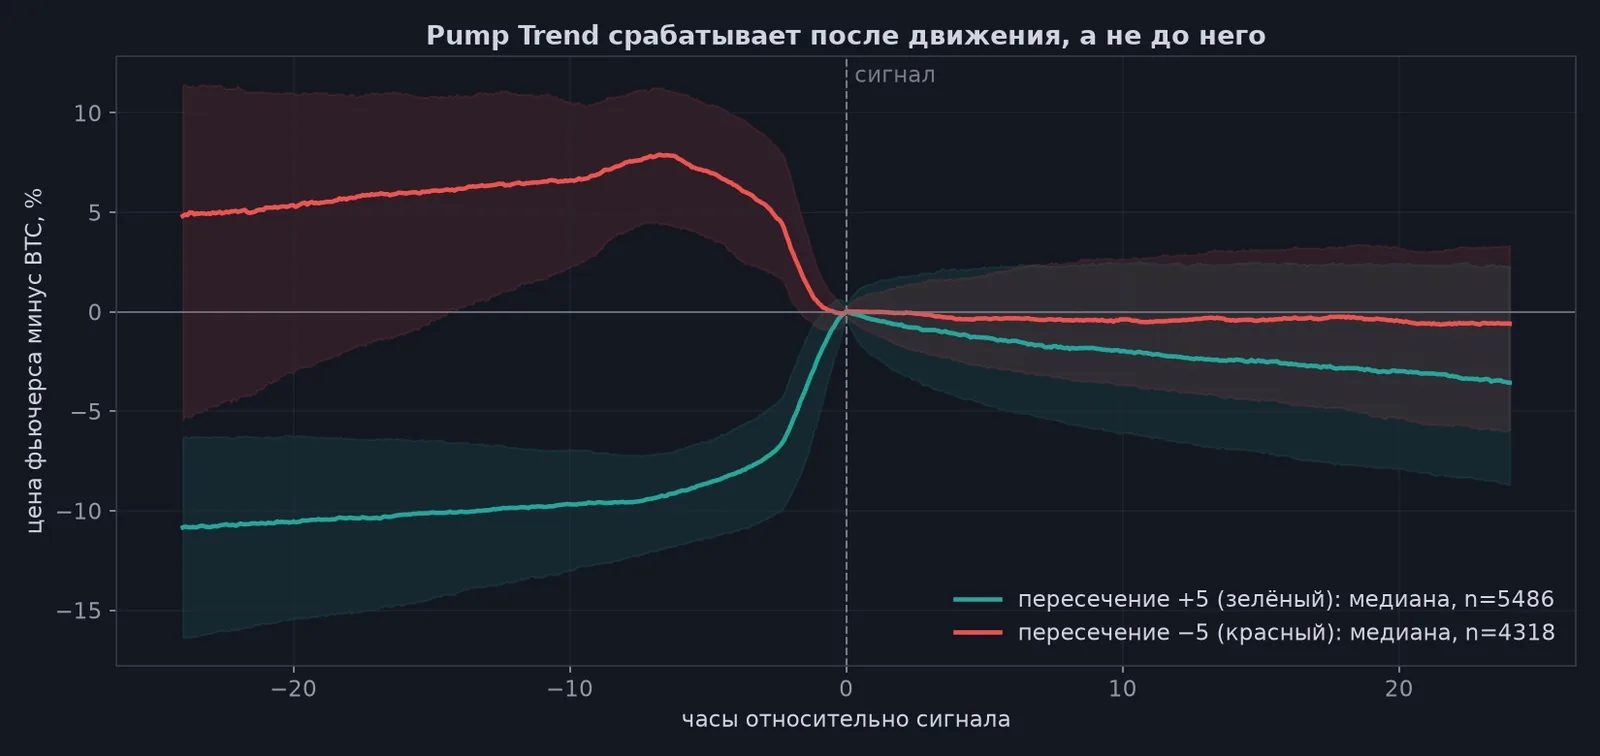
Median price path for a day before and after the threshold crossing. Bands: half of all cases.
| Signals | 4 h before the signal | After 1 h | After 4 h | After 24 h | |
|---|---|---|---|---|---|
| Green (+5) | 5,549 | +9.3% | −0.4% rise continued in 44% | −1.1% rise continued in 40% | −3.6% rise continued in 33% |
| Red (−5) | 4,389 | −7.2% | −0.0% fall continued in 52% | −0.4% fall continued in 56% | −0.6% fall continued in 54% |
The figures after the signal are the median change of the futures price net of BTC. The picture is the same in the research period, out of sample, and at thresholds of 4, 6 and 7.
The main conclusion: on average, the green signal appears at or near the top. Before the signal the coin has already risen 9%, and after it, in two cases out of three, it pulls back within a day. The higher the threshold, the stronger the pullback: after a crossing of +7 the median a day later is −5.2%.
The red signal behaves differently: the fall continues slightly more often than it reverses, but the edge is small.
Strategies
We tested several simple rules. A fee of 0.1% per round trip (taker on entry and exit) is included in all rows. One position per coin, held up to 24 hours.
| Rule | Trades | Profitable | Average trade | Median | Worst | Average: Dec–Apr / May–Sep | Average with funding |
|---|---|---|---|---|---|---|---|
| Long on green (+5) | 4,236 | 32% | −0.91% | −3.38% | −88% | −1.57% / −0.37% | −0.67% |
| Short after green (+5) | 4,236 | 66% | +0.71% | +3.18% | −294% | +1.37% / +0.17% | +0.47% |
| Same, 10% stop | 4,961 | 56% | +0.51% | +1.84% | −44% | +0.95% / +0.14% | — |
| Short after +7, 20% stop | 2,373 | 62% | +1.05% | +4.05% | −67% | +1.22% / +0.91% | +0.72% |
| Short on red (−5) | 3,353 | 49% | −0.41% | −0.10% | −252% | −1.12% / +0.40% | — |
| Short on red (−5), only coins with daily turnover above $50M | 1,160 | 58% | +0.70% | +2.13% | −252% | +0.43% / +0.94% | +0.33% |
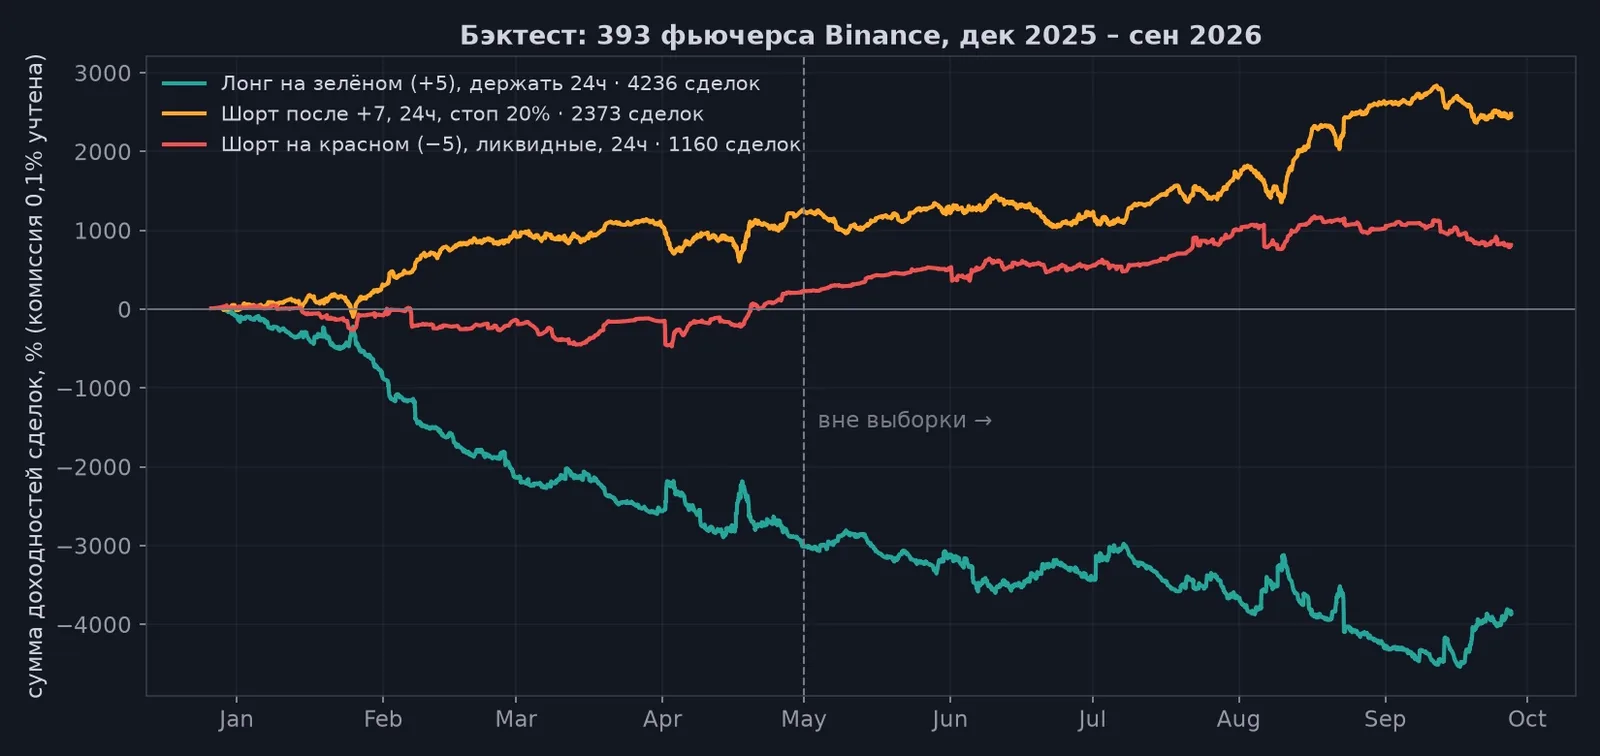
Cumulative sum of trade results. Dashed line: start of the out-of-sample check.
Long on green is the most stable result of the research, but with a minus sign. The rule loses money in 9 months out of 10 and in both periods. You must not buy a coin because Pump Trend turned green.
Short after green wins in two trades out of three, but the distribution of results is skewed: many small gains and rare catastrophic losses when the pump continues several-fold.
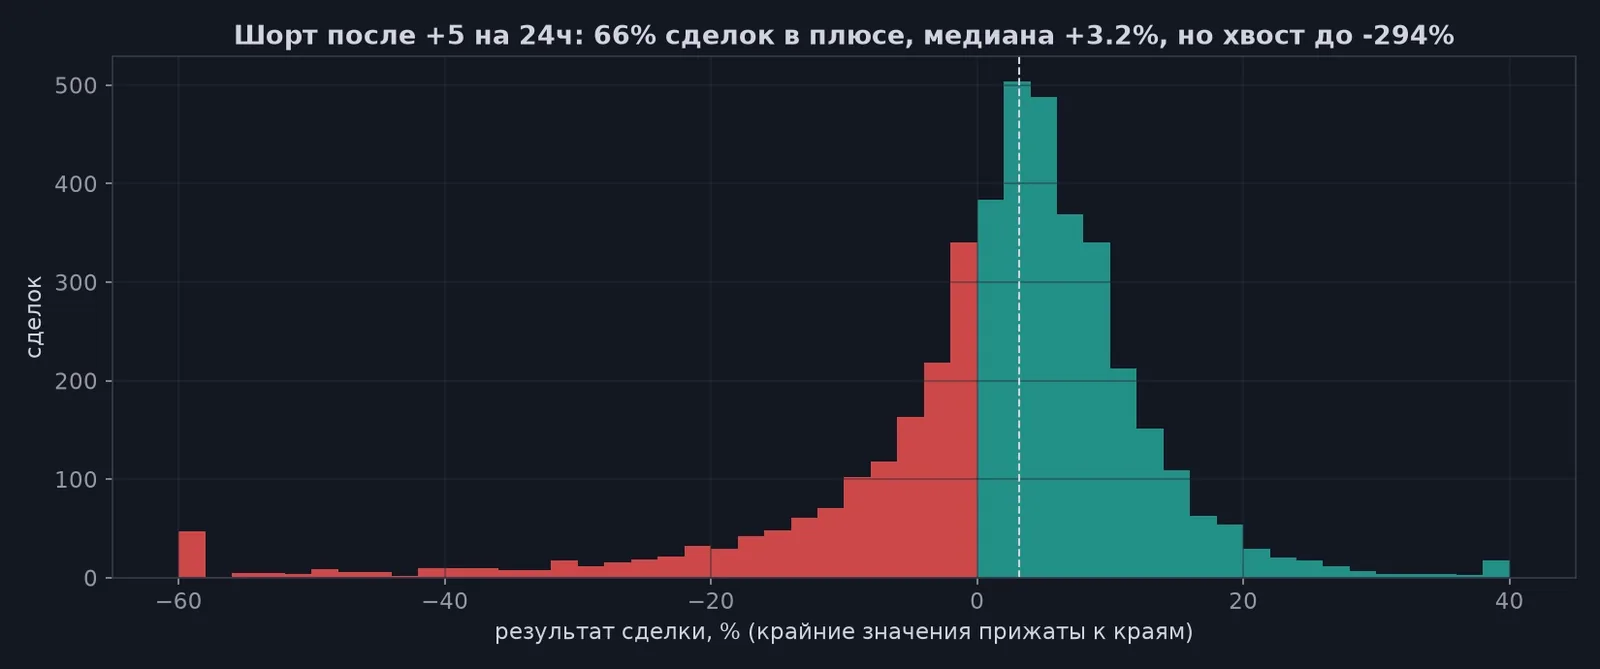
Results of a short after a +5 crossing, held for 24 hours.
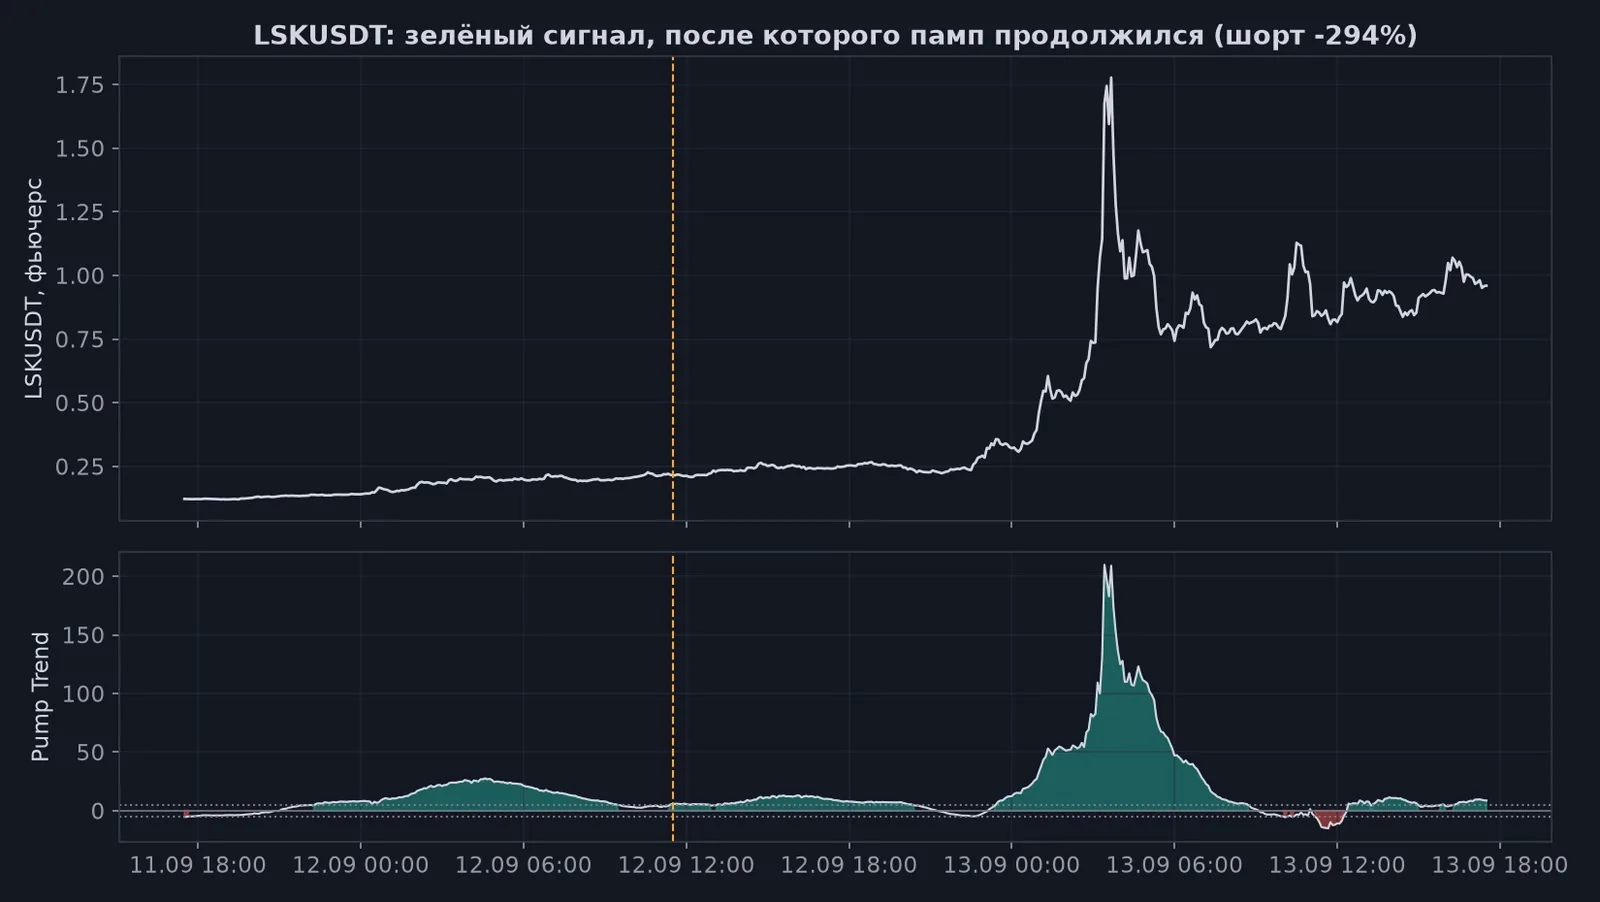
LSK, 12–13 Sep 2026: a green signal at +5, after which the coin rose another 4 times. Without a stop, such a short wipes out the result of a hundred successful trades.
At the +7 threshold with a 20% stop, the edge held out of sample: +0.91% per trade in May to September against +1.22% in December to April. The rule was profitable in 8 months out of 10. After funding, about +0.7% per trade remains. This is a workable but thin margin: it is easily eaten by slippage on illiquid coins and by more frequent funding payments on overheated alts.
Backtest limitations:
- the stop is checked on the closes of 5-minute candles, and in reality execution during a pump will be worse;
- slippage is not included, and on coins with daily turnover under $5M it is noticeable;
- funding is estimated from the predicted rate, assuming an 8-hour interval. For coins with a 4- or 1-hour interval the real cost is higher;
- the "sum of results" is the sum of percentages across trades of equal size, not portfolio return: trades overlap in time, especially on days of a broad market move.
How to use
- As an overheating filter. Green highlighting means the coin has already completed most of its move. If you are going to buy a coin with Pump Trend above +5, you are most likely buying from those who entered earlier.
- As a list of pullback candidates. Sort the Pump Trend widget in descending order: the coins that have risen the most over the last few hours will be at the top. These are candidates for a return, but not a short signal by themselves. Look for confirmation in other models: position closing in Net open interest, liquidation buy-ups in Stop killer, fading Power trades. A stop is mandatory.
- As an indicator of the end of an impulse. When the value returns to zero, the short average has caught up with the long one and the impulse is exhausted.
- A red signal on liquid coins slightly more often means a continuation of the fall than a reversal. The statistics do not advise catching the bottom on a red Pump Trend.
Limitations
- The model is calculated only for Binance and only for coins that have spot on Binance. Coins without spot do not appear in Pump Trend.
- The model lags by construction: it is a difference of averages, and it grows after the price.
- Known error: after a spot delisting, the model keeps calculating the coin on empty candles and gives meaningless values of the order of −10¹⁴. This happened, for example, with TON in June to August 2026 and with a group of coins in April to May 2026. Such values must be ignored.