Range (volatility cone)
The cone shows where the close price will be 1–10 bars ahead, with 50% and 80% probability. It estimates the size of the move, not its direction.
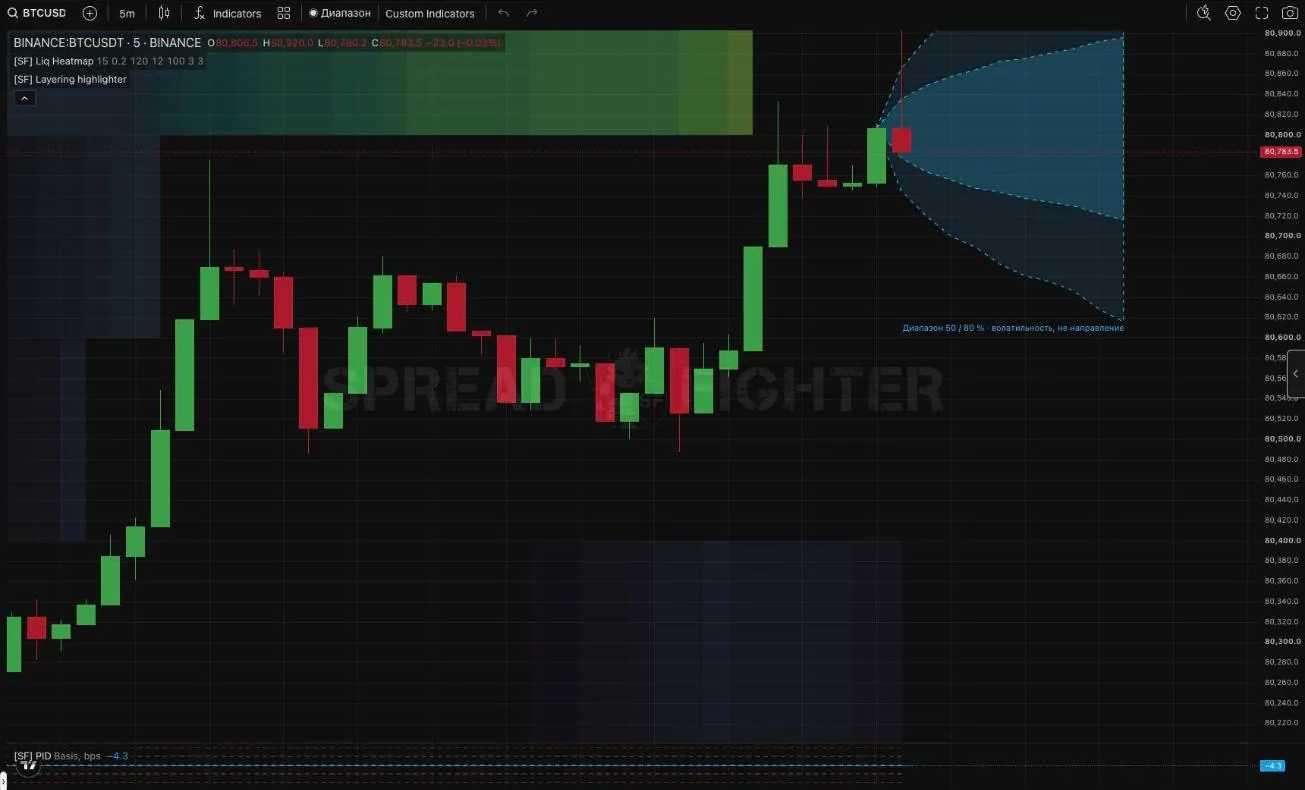
BTCUSDT, 5m: a fan spreads to the right from the close of the last bar. The inner band is 50%, the outer band is 80%.
Description
Turn the cone on with the Range button in the chart header. The button state is remembered separately for each tab and survives a page reload. The feature is available on all plans, including without logging in.
The cone starts at the close of the last closed bar and extends 10 bars to the right. The current unclosed bar is the first step of the cone. When a bar closes, the cone is recalculated and shifts by one bar.
Where it works:
- exchanges: Binance, Hyperliquid, Aster;
- timeframes: from 1 minute to 1 week. There is no cone on second timeframes, synthetic instruments, and derived series (funding, OI, and so on);
- history is required: at least about 200 bars, and full accuracy from 2048 bars. The cone is not built for newly listed coins.
How to read it
| Element | Meaning |
|---|---|
| Inner (dark) band | in half of cases, the close price h bars ahead will be inside |
| Outer (light) band | in 4 cases out of 5, the close price h bars ahead will be inside |
| Above the outer band | about 1 case in 10 |
| Below the outer band | about 1 case in 10 |
| Cone width | expected volatility: a wide cone means the market is moving a lot, a narrow one means it is calm |
The cone widens to the right roughly as the square root of the number of bars: at 4 bars it is twice as wide as at 1. The bounds can be asymmetric if sharp moves in one direction happened more often than in the other in the instrument's history.
The cone describes the close price h bars ahead, not the wicks inside a bar. The probability that price touches a bound at least once within 10 bars is clearly higher than 20%. Keep this in mind when you place a stop at a cone bound.
How it is calculated
The calculation runs in the browser, on the instrument's last 2048 closed bars. The server calculates nothing, and the unclosed bar is not included.
- Logarithmic bar returns: , where is the close price.
- Current volatility is the exponentially weighted average of squared returns (EWMA) with a half-life of 100 bars. Recent bars weigh more, and a bar 100 bars back weighs half as much: ,
- Historical h-bar moves, scaled to the volatility of their time: . Here is the EWMA estimate known before the start of the segment, so there is no look-ahead.
- Quantiles of these values for the 10%, 25%, 75%, and 90% levels.
- The cone bound h bars ahead: , where is the last close.
Step 2 sets how strongly the market is moving now. Steps 3–4 set the shape of the distribution: crypto has heavy tails, and sharp moves happen more often than a normal distribution predicts. So the quantiles come from the instrument's own history, not from a normal distribution table. This approach is called filtered historical simulation (FHS).
Validation
Band accuracy
We tested the cone on history: BTC, ETH, SOL, DOGE, and XRP, on 15m, 1h, and 4h timeframes, 1,800 points in 2026, horizons from 1 to 10 bars. For each point, the cone was built only from data before that point.
| Band | Target | Actual, all points | Actual by timeframe and horizon |
|---|---|---|---|
| Inner | 50% | 49.6% | 48–51% |
| Outer | 80% | 79.7% | 77–82% |
The bands hold the promised probability without fitting. In the second half of 2025, when volatility was falling, the cone was wider than needed. On 4h, the outer band was breached less often than in 10% of cases on each side.
Comparison with other methods
On the same points, we compared the cone with GARCH(1,1) and two neural networks for time series forecasting: Kronos-base and Timestral-209M (Mistral, October 2026). Band quality was measured with pinball loss, the standard measure of probabilistic forecast accuracy.
| Method | Result relative to the cone |
|---|---|
| GARCH(1,1) with t-distribution | better by about 1%, within statistical noise |
| Timestral-209M | about the same: the difference is from −3% to +1% depending on the timeframe, within noise |
| Kronos-base | worse: the band is clearly narrower than the real spread, and it contained 41–63% of outcomes instead of 80% |
None of the tested models, including the neural networks, predicted price direction 1–10 bars ahead better than "price will not change". That is why the cone has no "forecast" midline, and the cone itself is symmetric around the last close, adjusted for the instrument's history.
How to use it
- Stops. A stop inside the inner band will most likely be hit by ordinary noise. If you need a stop over a horizon of several bars, it is reasonable to place it beyond the outer band at the horizon you need, and size the position for that distance. Remember that touching a bound is more likely than closing beyond it.
- Targets. A target beyond the outer band at the 10-bar horizon is reached by a close in about one case in 10. If the trade relies on such a move, you need either a longer horizon or a reason to expect an unusual move.
- Regime assessment. The cone width in percent is comparable across instruments and periods: a sharp widening after a calm market means volatility has risen.
- Unusual moves. A close beyond the outer band is an event that, by the instrument's history, happens about once in ten times. A series of such closes in a row points to a regime change that the cone has not yet accounted for.
Limitations
- The cone estimates only the size of the move. It does not predict direction and is not meant to.
- The cone does not foresee news, listings, delistings, and other events that change the market in a jump. At such moments price leaves the bounds more often.
- Volatility is calculated with a lag: the half-life is 100 bars. When the market moves sharply from a lull to a strong move, the cone will be narrower than the real spread for the first few bars.
- History is required: the cone is not built for instruments younger than 200 bars on the selected timeframe, and below 2048 bars the estimate is less reliable.
- Accuracy was tested on liquid Binance perps. On low-liquidity coins, wicks and gaps make the real spread wider.