Standardized active return measure
The percentage gain or loss of an investment relative to a benchmark.
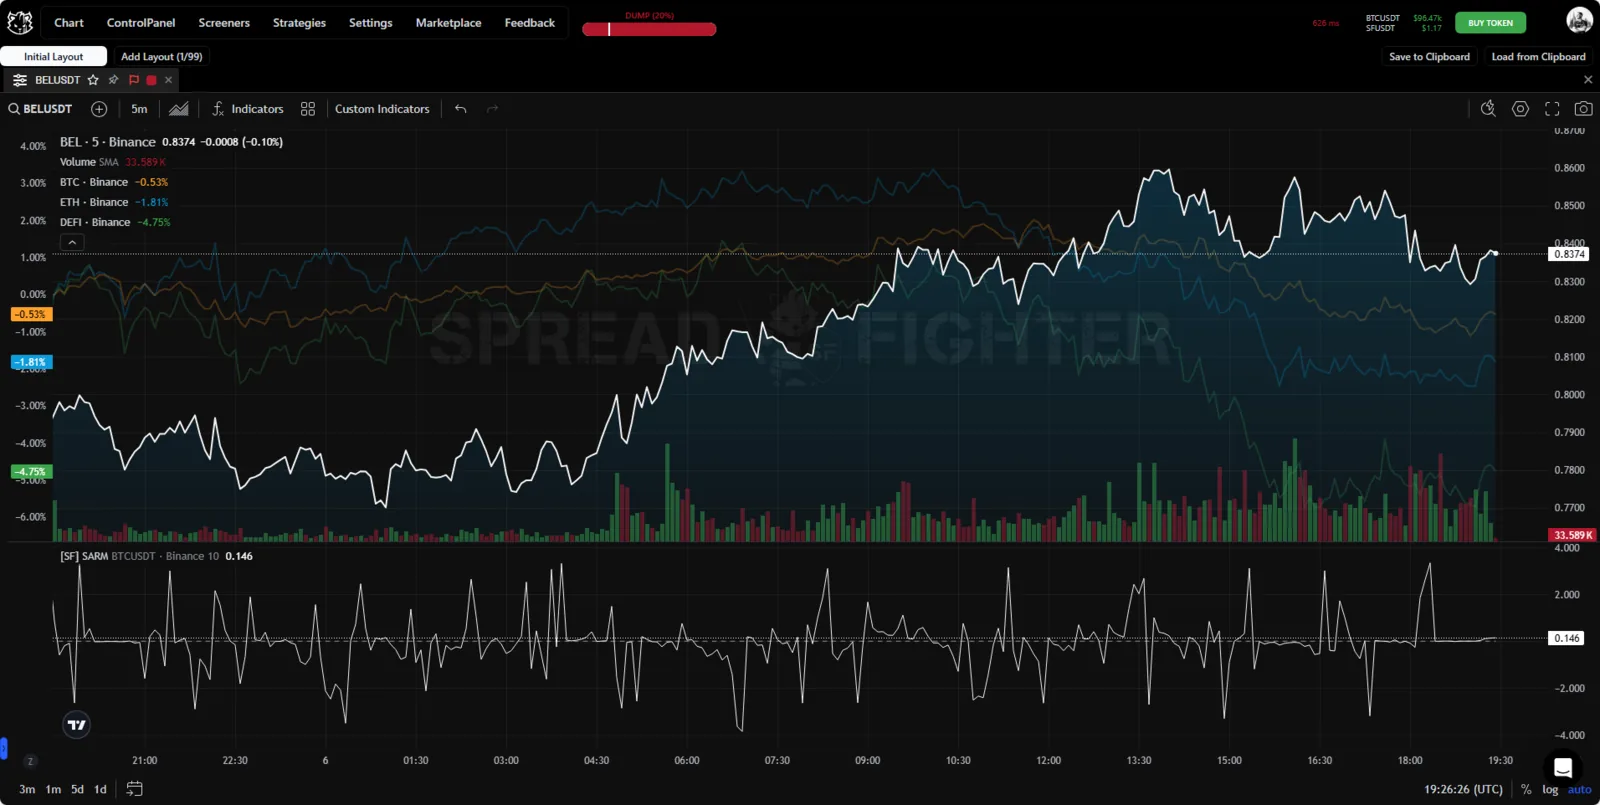
Indicator appearance.
What is SARM?
SARM is the percentage gain or loss of an investment relative to an investment benchmark. The benchmark can be market-wide, such as the Standard and Poor's 500 index (S&P 500), or sector-specific, such as the Dow Jones US Financials index.
Active return is the difference between the benchmark return and the actual return. It can be positive or negative and is usually used to evaluate investment performance.
Model description
A portfolio that beats the market has a positive active return (SARM), assuming the market as a whole is the benchmark. For example, if the benchmark return is 5% and the actual return is 8%, the active return is 3% (8% - 5% = 3%). If the same portfolio earned only 4%, it would have a negative active return of -1% (4% - 5% = -1%).
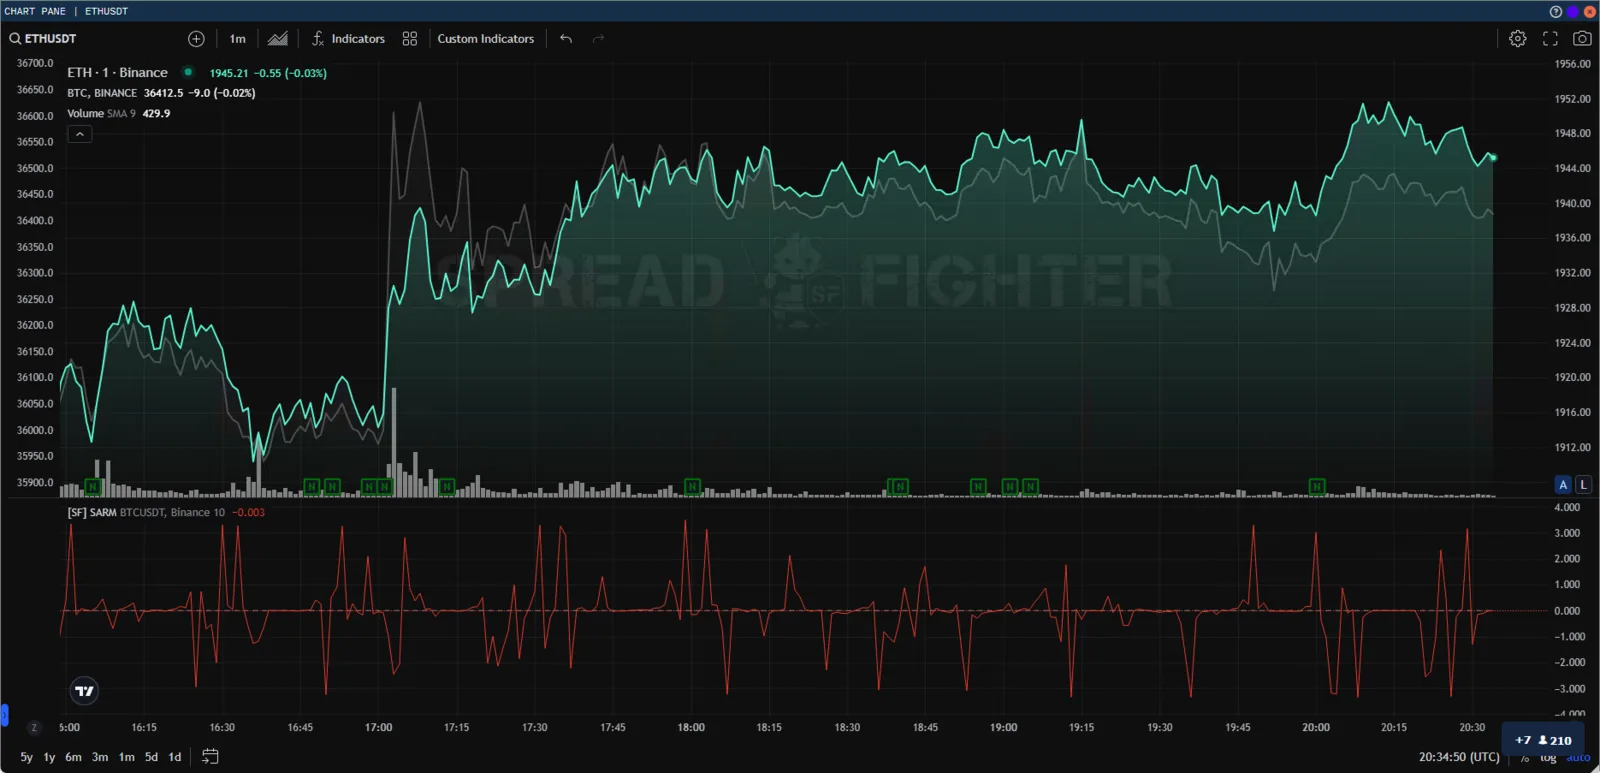
Ethereum vs Bitcoin.
If the benchmark is a specific market segment, the same portfolio could in theory lag the broader market and still have a positive active return against the chosen benchmark. This is why it is essential for investors to know which benchmark a strategy uses and why.
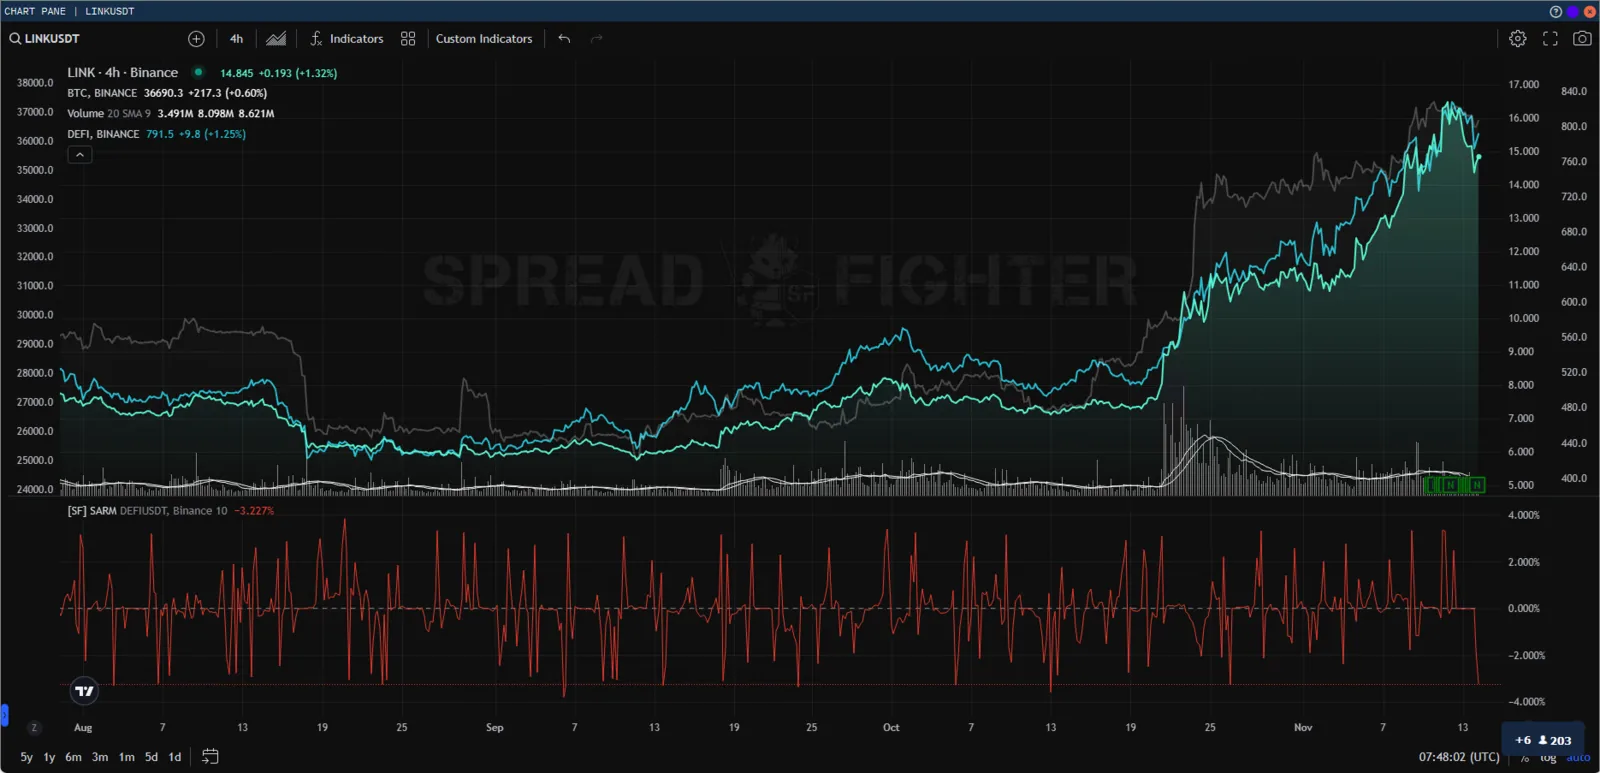
Chainlink vs DeFi index.
SARM is a more sensitive version of CARM. The example below shows Trellor against its benchmark, together with the spread between Trellor and the benchmark. An important caveat: it is not correct to read a direct relationship between them, because SARM is calculated over a period and also accounts for the risk-free return. The spread is calculated only from real-time data.
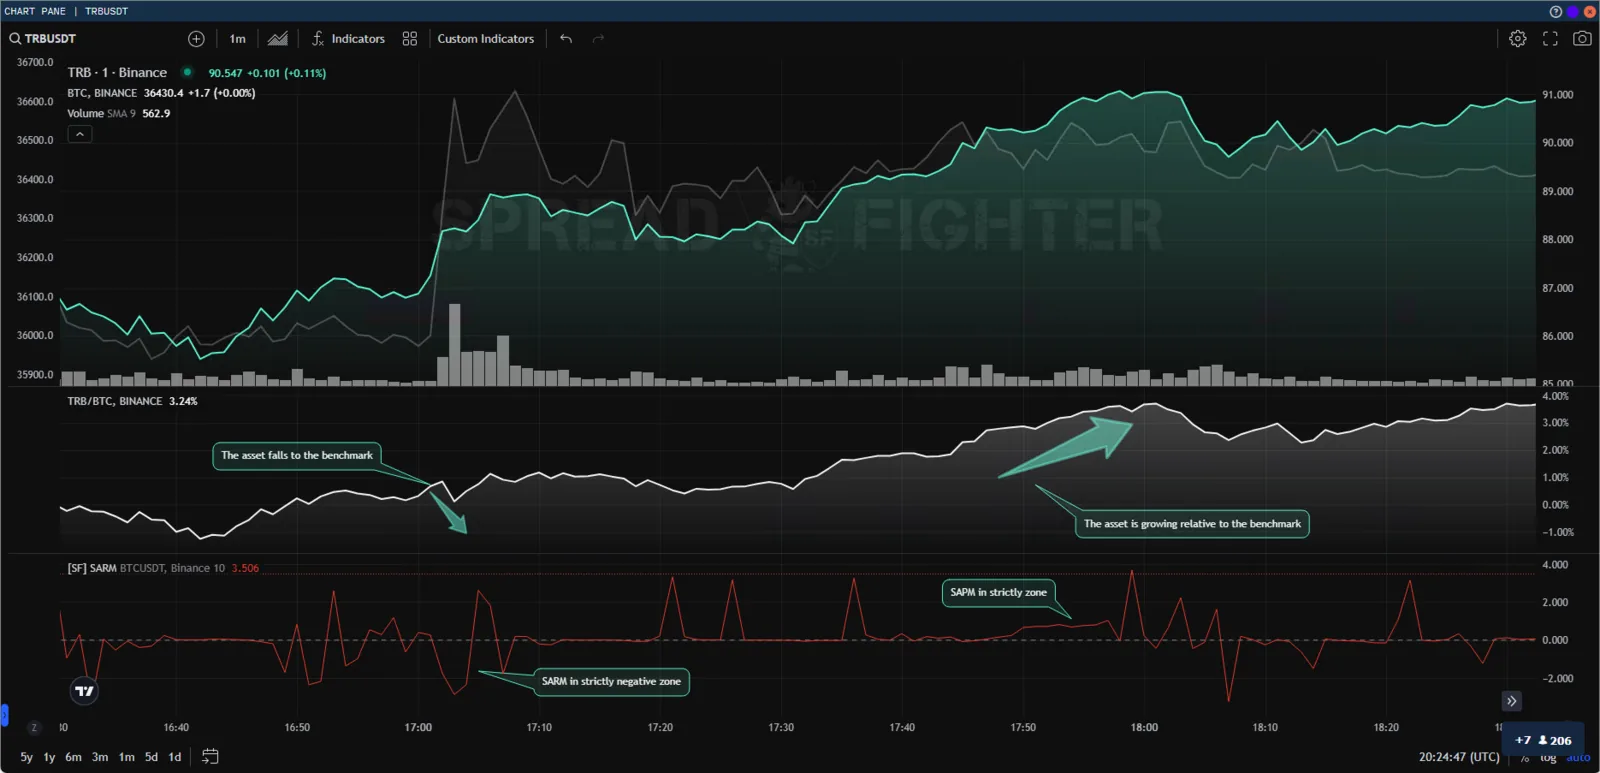
Trellor vs Bitcoin.
How Standardized Active Return Measure (SARM) is calculated
The Standardized Active Return Measure (SARM) indicator measures the relative active return of a portfolio against a benchmark asset. It uses the standard deviation of active return as the risk measure.
Calculating the average HLC3 over periods:
where is the upward price move on the -th bar, and is the number of candles used to calculate the average.
Calculating the deviation of HLC3 from the average:
where is the deviation of the current from its average over candles.
Calculating the portfolio return:
where is the portfolio return, is the current deviation, and is the deviation bars ago.
Calculating the portfolio active return:
where is the portfolio active return relative to the benchmark,
is the benchmark return, requested from another asset on the same timeframe.
Calculating the active return risk (standard deviation):
where is the standard deviation of active return over candles.
The final SARM calculation:
where is the standardized active return.
Key takeaways
- SARM shows how much an investment gains or loses, in percentage terms, against its benchmark.
- SARM can be positive or negative and is treated as a sign of investment performance.
- Those who invest in actively managed funds believe that, under a talented manager, the fund will beat a passively managed fund.
- Critics argue that, statistically, passively managed funds that do not try to beat the market tend to do better over the long term.
Source: investopedia