Stat Arbitrage Pairs Screener
A tool for finding stationary synthetic pairs.
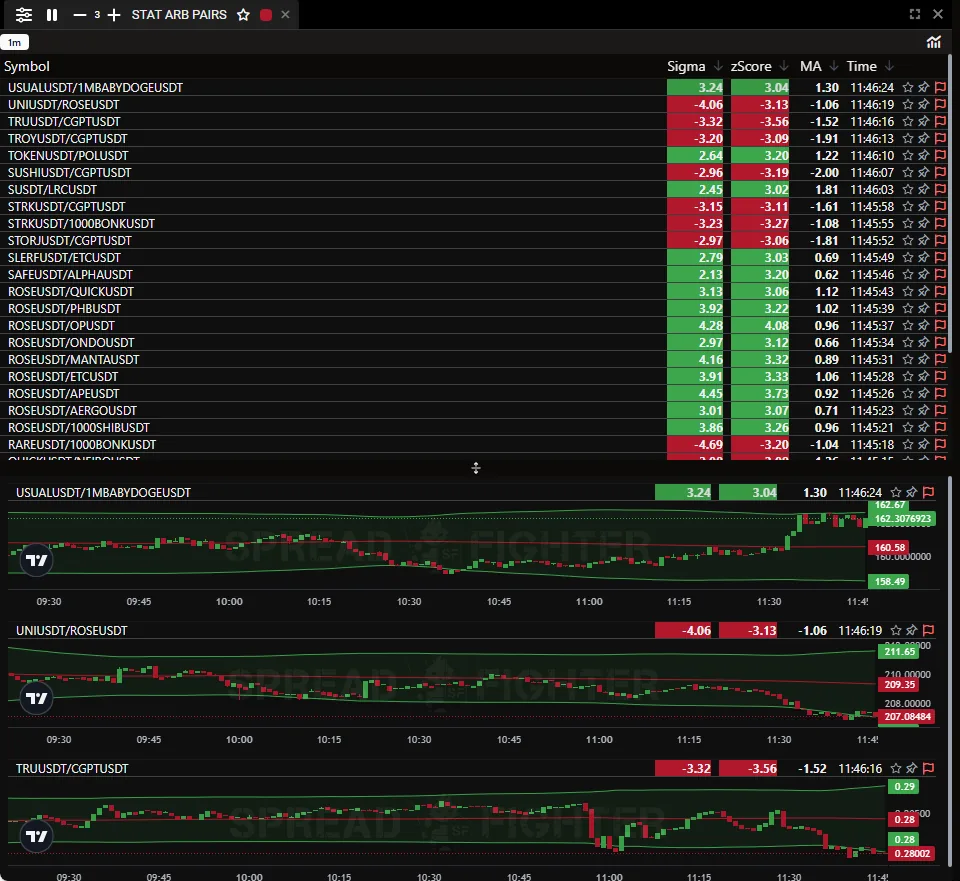
Widget appearance.
Model description
The widget checks assets for stationarity using the augmented Dickey-Fuller test.
The augmented Dickey-Fuller test is widely used in quasi-arbitrage, pairs trading and basket trading to find cointegrated pairs.
Cointegration is a property where a price series made up of several non-stationary series, taken in a certain proportion, becomes stationary.
Let's look at cointegration in a practical example.
BAT is an Ethereum token that supports the blockchain-based digital advertising platform of Brave Software. Internet users who browse with the free Brave web browser (available at Brave.com) can replace the ads they see with ads from the Brave ad network. Users then receive BAT from advertisers as compensation for their attention.
Source: Coinbase
The BAT price series is not stationary.
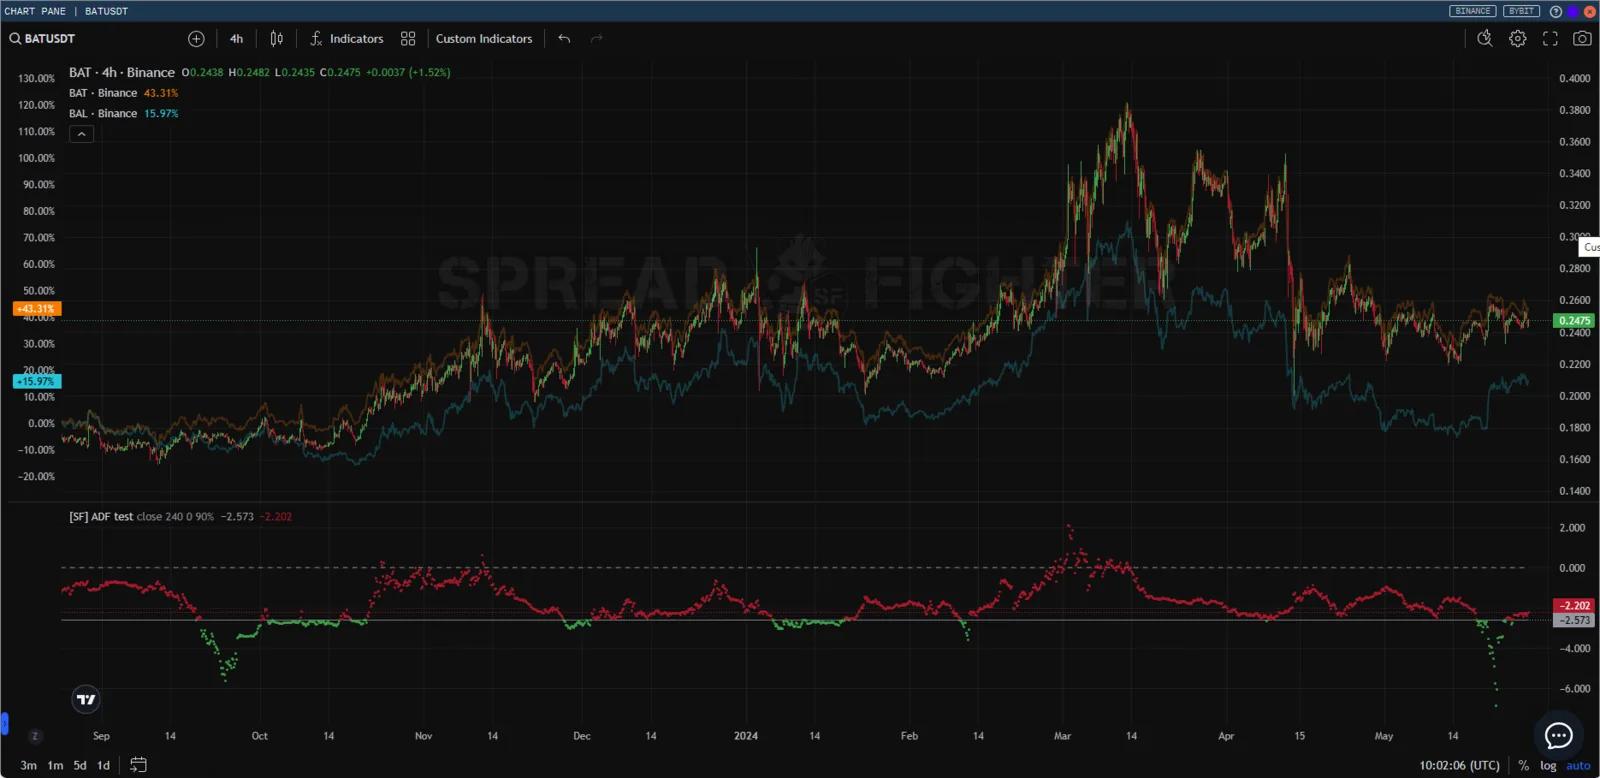
BAT
Balancer (BAL) is an Ethereum token behind the Balancer protocol. The protocol works as an automated market maker, so anyone can create trading pools and add liquidity to them, earning configurable trading fees. A Balancer pool can hold up to 8 tokens. Each token can have its own weight, which can be limited to as little as 2% of the total.
Source: Coinbase
The BAL price series, like BAT, is not stationary.
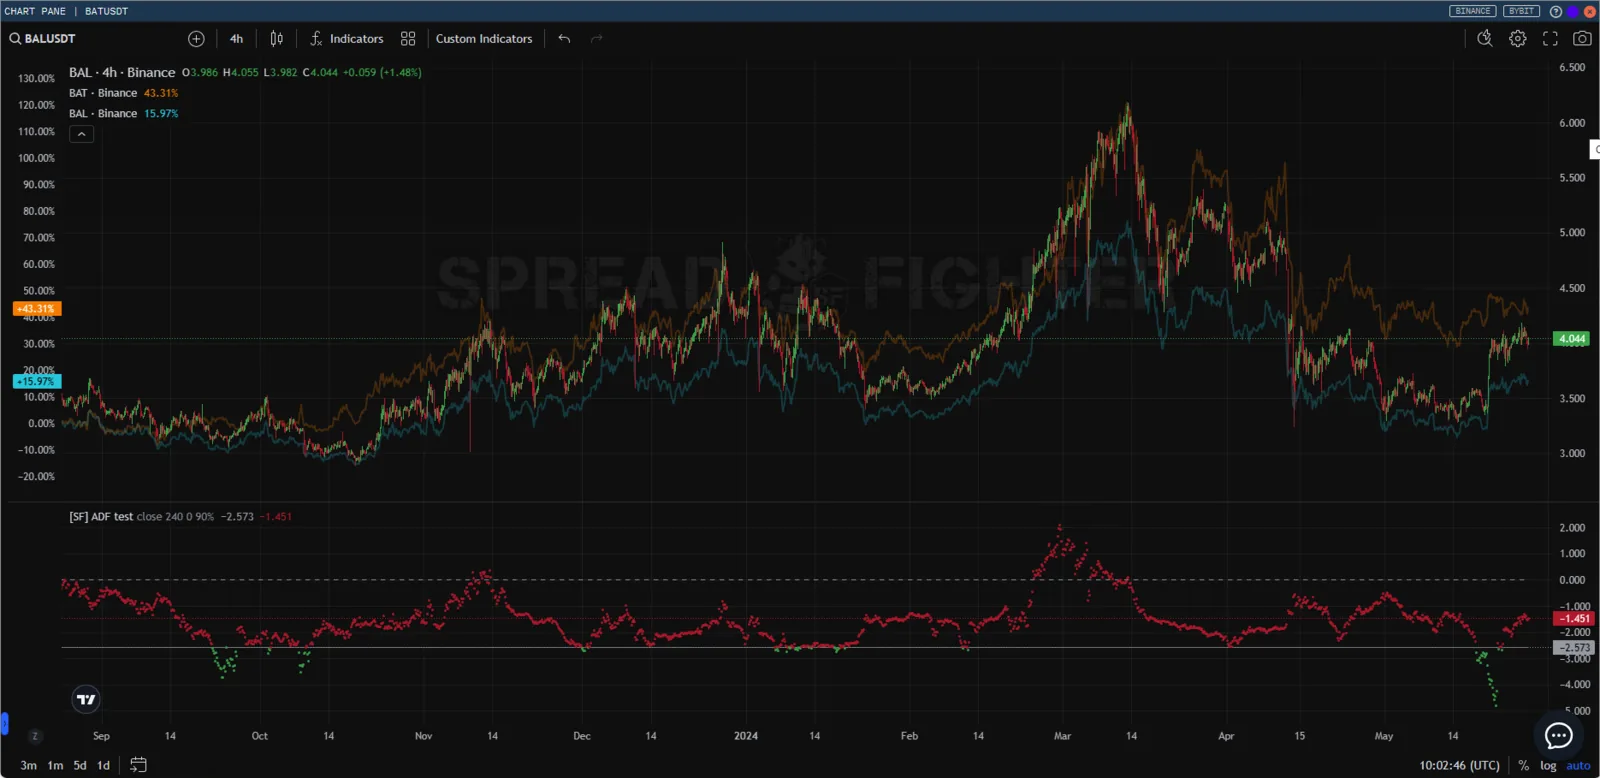
BAL
However, if we take a basket of BAT against BAL (BINANCE:BATUSDT/BINANCE:BALUSDT), the synthetic series starts to show stationarity over a certain period.
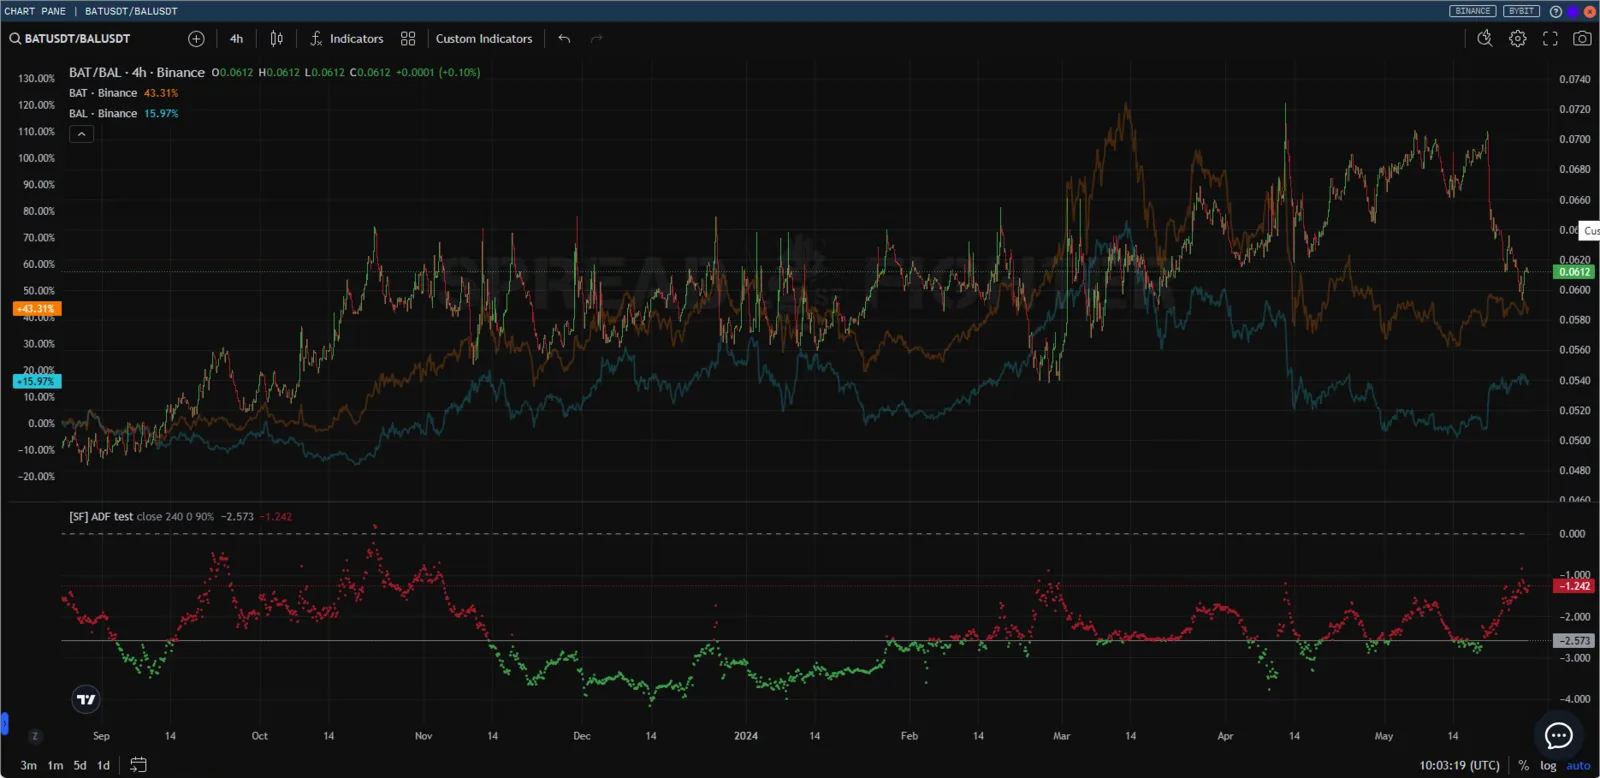
BAT/BAL
Trading stationary series has several advantages:
- Predictability:
- Sudden changes are less likely: Stationary assets have stable statistical properties (mean, variance) over time, which makes their future values more predictable.
- Historical data matters: Since the parameters do not change over time, past data can be used to forecast future prices.
- A defined structure:
- Mean reversion: Stationary assets tend to return to a long-term mean, which lets traders use strategies based on this principle (for example, pairs trading).
- Some autocorrelation: Stationary assets can show patterns in price changes, which allows more accurate forecasting models.
- Simple modeling and analysis:
- Fewer difficulties in model estimation: For stationary assets, simple time series models such as ARIMA (autoregressive integrated moving average) can be used for analysis and forecasting.
- Stable parameters: The parameters of models built on stationary data stay stable over time, which improves the reliability and accuracy of forecasts.
- Lower risk:
- Controlled risks: Since stationary assets are less prone to extreme swings, traders can assess and manage risks more precisely.
- Lower volatility: Stable volatility makes trading more predictable and less stressful.
- Arbitrage strategy opportunities:
- Cointegration: When two or more stationary assets are cointegrated, traders can use an arbitrage strategy to profit from price imbalances.
- Less dependence on trends: Stationary assets offer more opportunities to trade reversions than trending markets do, which diversifies trading strategies.
- Spotting seasonal and cyclical changes:
- Pattern detection: Using stationary variables helps identify patterns such as seasonal or cyclical changes, which can be useful for developing trading strategies.
- Efficient capital management:
- Better data-driven decisions: Thanks to the predictability and stability of stationary assets, traders can make better-informed decisions on capital management and position setup.
In the end, trading stationary assets lets traders use the statistical properties of time series to build predictable, manageable and less risky trading strategies.
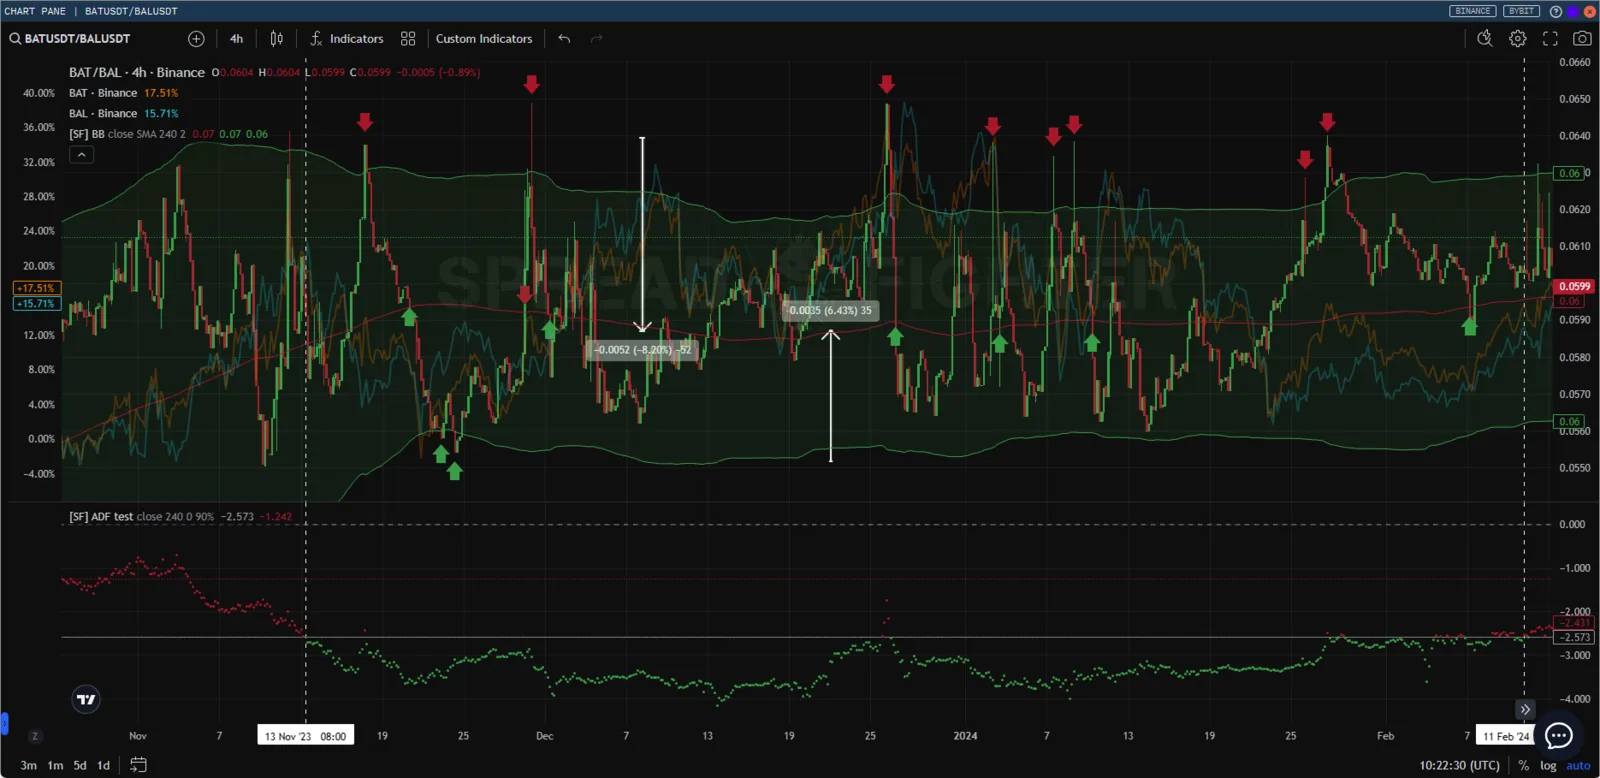
An example of the simplest trading logic for a synthetic stationary series.
But do not treat quasi-arbitrage of stationary series as the Holy Grail. Like any speculative activity, statistical arbitrage comes with a number of risks and tasks the trader has to solve.
- The first problem is finding related assets. For example, if the crypto market is flat, classic cointegration tests can find quite a lot of related assets. But if Bitcoin starts a trending move up or down, it quickly turns out that the relationship is not that good, and the word hedge starts to lose its meaning along with the trader's deposit.
- From this, and not only from this, follows the second problem: detecting a cointegration break in time, that is, the loss of the link between the assets.
- The third problem is finding the average price, since there are many methods to determine it. They all give different results.
- The fourth problem is finding the entry point. Usually, standard deviations from a weighted average fair price are used. But deviations can be calculated in different ways.
- The fifth problem is the lack of infrastructure and software that lets you set risk or profit limits. And, in general, something that makes it convenient to trade and select assets. However, despite these problems, even the simplest interfaces and trading in this direction will give a clear edge over most traders with a classic approach.
Widget location
To add the "Pair screener" tool to your workspace, first click the "Widget menu" button in the platform header. Then click the button of the same name in the "Correlation" section.
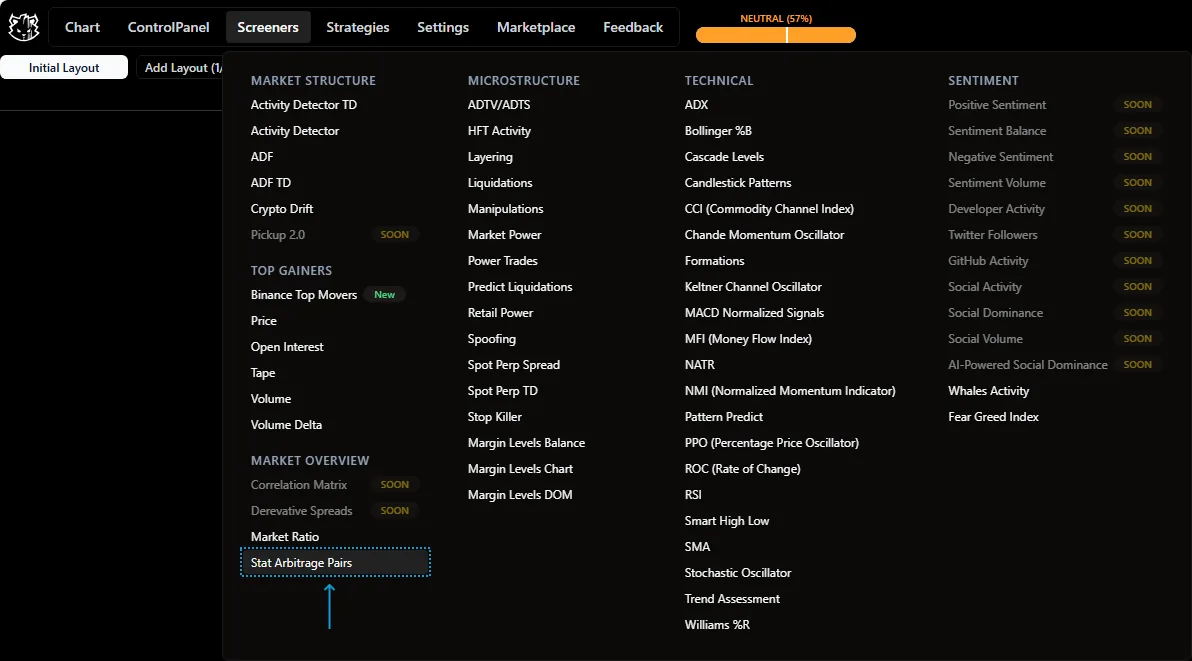
Widget location.
Tool features
The table shows:
- Sigma - the number of standard deviations by which the synthetic pair has deviated from its average price.
- zScore - Z-Score of the synthetic pair's price series.
- MA - the percentage by which the synthetic pair has deviated from its average price.
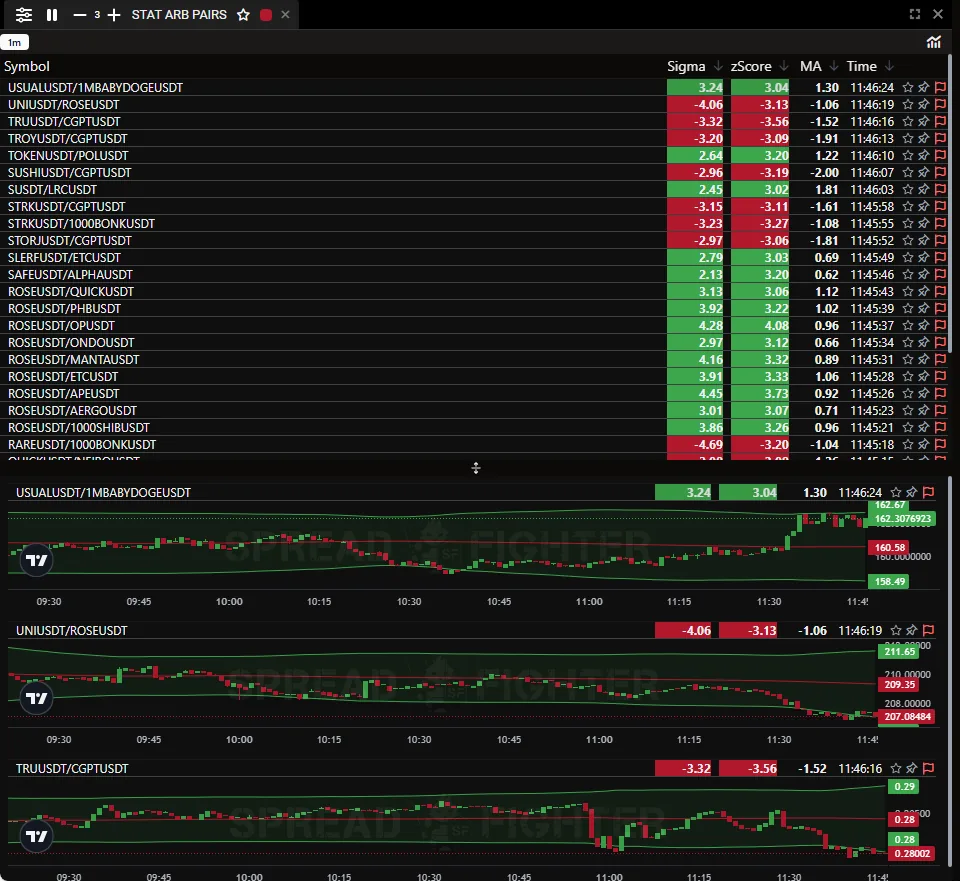
Widget features.