Top Gainers
The tool shows the leaders of growth and decline across market data metrics.
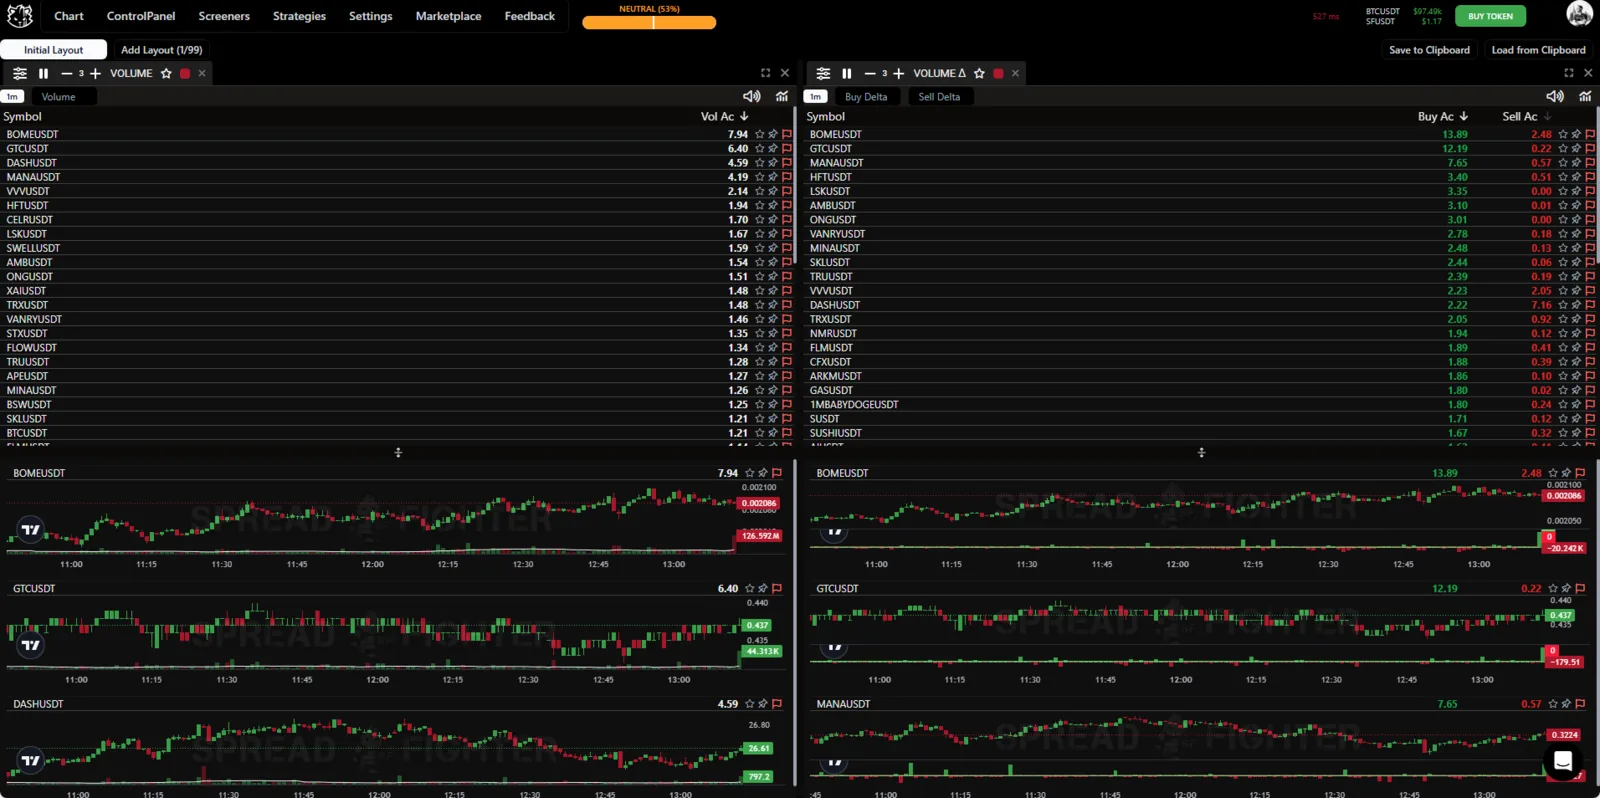
Widget appearance.
Model description
Top Gainers lets you quickly find assets that stand out from the broad market. You can use it to:
- build synthetic basket positions;
- run a comprehensive analysis of broad-market volatility;
- find assets "in play" by filtering on open interest and trading volume.
Top Gainers values are calculated with the formula:
where is the metric value at time , and is the period over which the scanner measures the change.
Widget location
To add the "Top Gainers" tool to the workspace, first click the "Screeners" button in the platform header. Then click the scanner you need in the "Top Gainers" section.
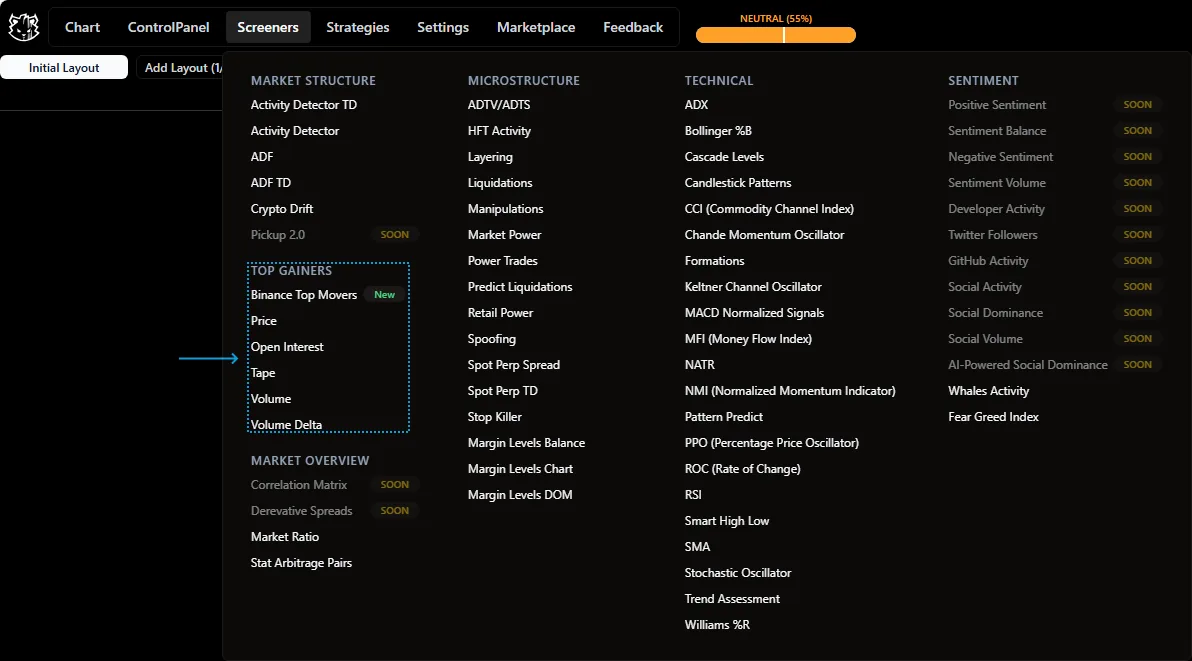
Widget location.
Widget functionality
The widget table shows the value of the metric by which you want to filter the leaders of growth and decline.
- Pr Ac - price change.
- Vol Ac - volume change.
- Trades - number of trades.
- Oi Ac - open interest change.
- Buy Ac - change in taker buy volume.
- Sell Ac - change in taker sell volume.
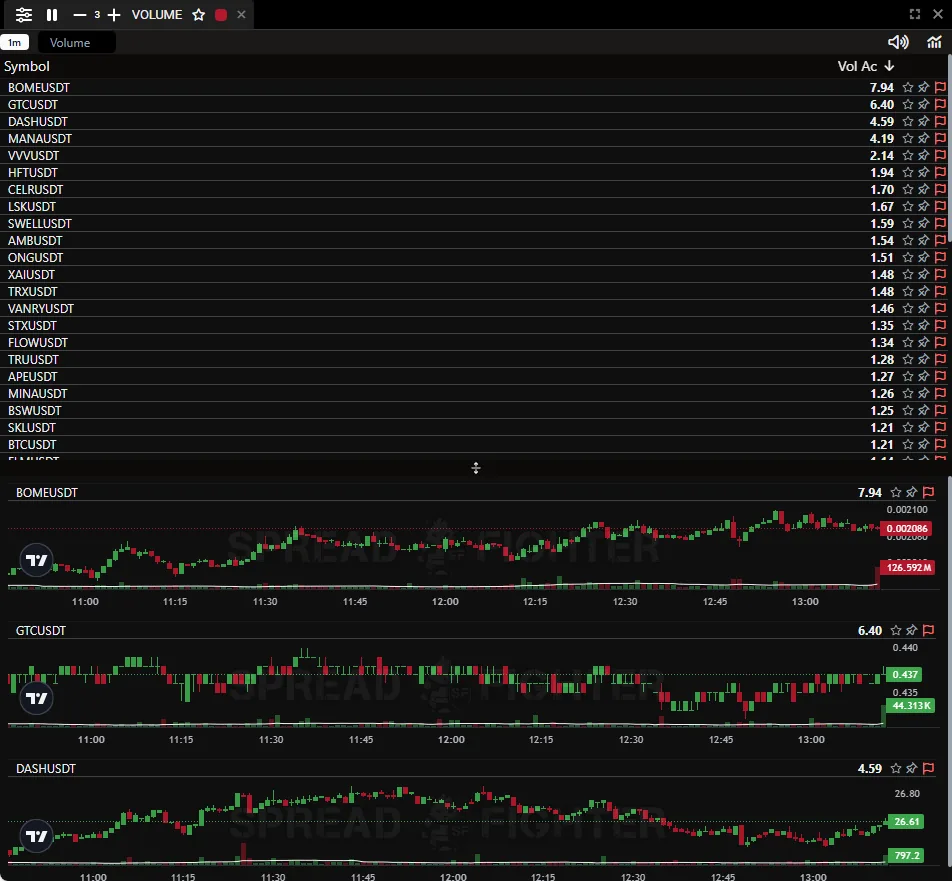
Widget functionality.