Z-Score
Z-Score of an asset's price.
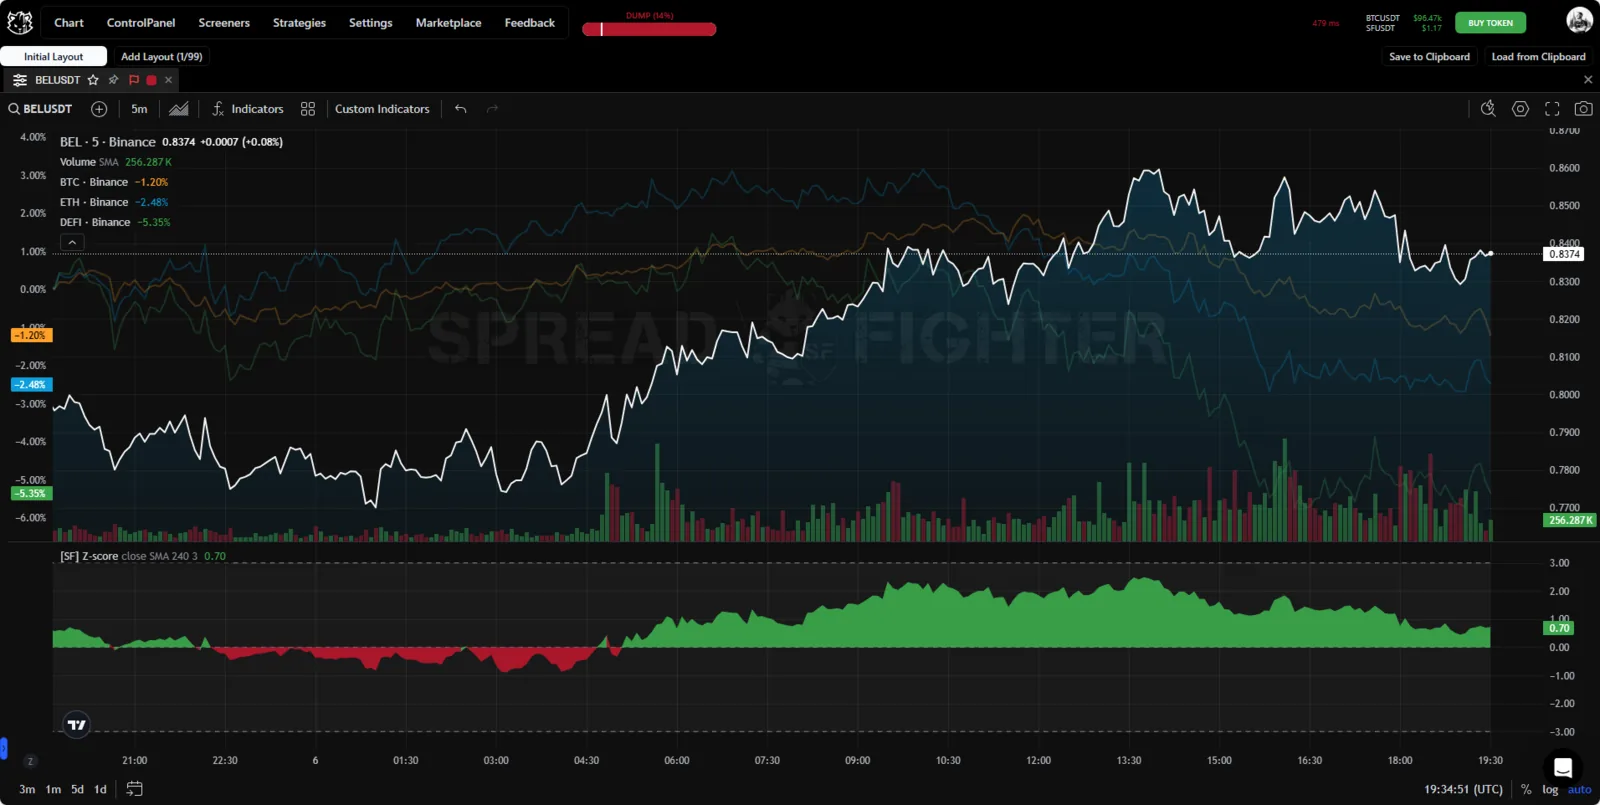
Indicator appearance.
Description
The standard score (Z-Score) is a measure of relative dispersion of an observed or measured value. It shows how many standard deviations the value lies from the mean.
How Z-Score is calculated
The Z-Score indicator measures how far the current price deviates from its moving average, in standard deviations.
Moving average of the closing price over \( n \) periods:
where:
- — moving average of the closing price,
- — closing price,
- — number of periods.
Standard deviation of the closing price over \( n \) periods:
where:
- — standard deviation of the closing price over periods.
Z-Score calculation:
where:
- — Z-Score, which shows how far the current price is from the mean in units of standard deviation.