SF - Network profit and loss
Realized profit and loss of the network
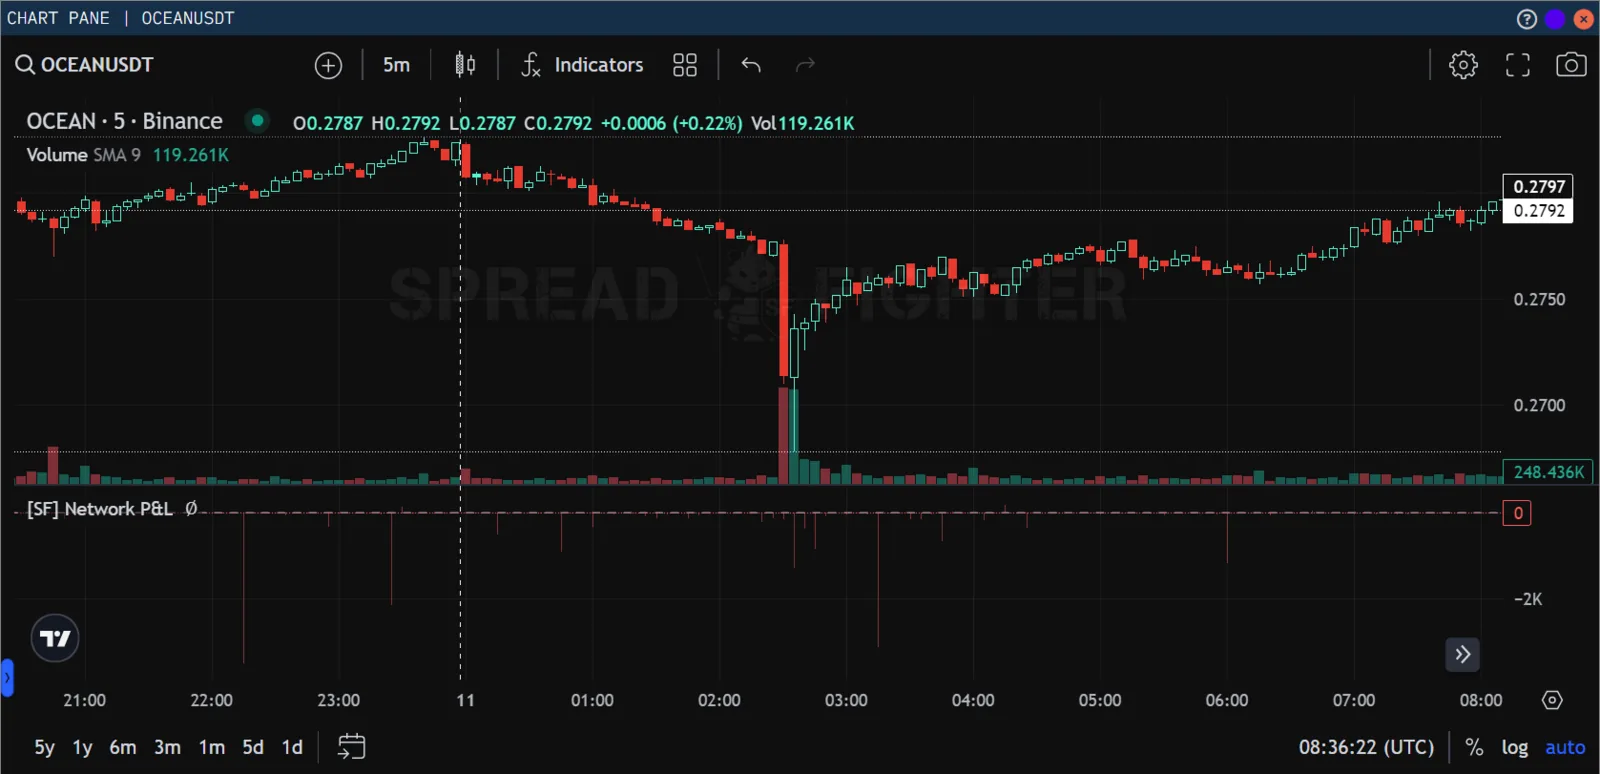
Indicator appearance
Description
Network profit and loss is a sentiment analysis indicator. It shows the average profit or loss of all coins that change addresses each day.
For each coin that moves on-chain, NPL takes the price at which it was last moved and assumes this is its acquisition price. Once the coin changes address again, NPL assumes it has been sold.
Features
In the graphics settings window, the user can choose the display colors and the opacity of the indicator.
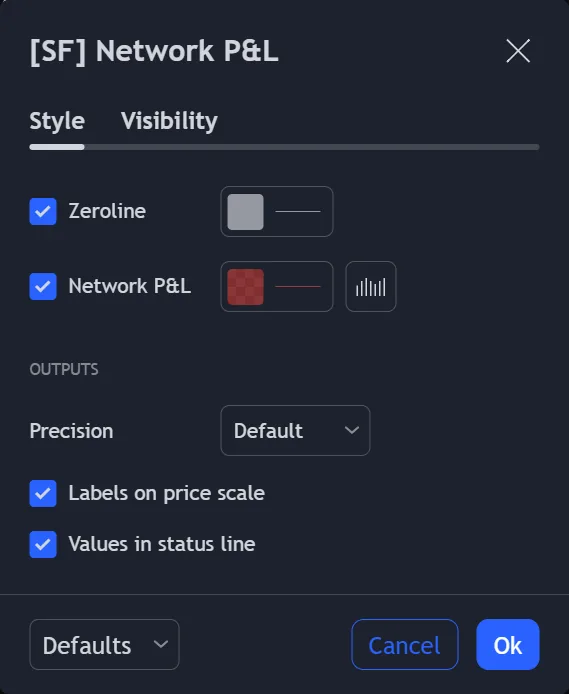
Indicator graphics settings
Access by plan
The indicator is available on all subscription plans.
Use cases
Network profit & loss is a metric that calculates the net profit or loss (in US dollars) for all coins over the period under review. It reflects aggregate market sentiment, capital inflows and outflows, and network profitability trends.
A typical interpretation looks like this:
Positive values show that profit is being realized on the network. If the price keeps rising, this shows that capital inflow is absorbing the sell side. Progressively higher peaks can also show a growing chance of a local top if demand weakens as larger profits are taken.
Negative values show that losses are being realized on-chain. If the price keeps falling, this shows capital outflow. Deep lows can signal investor capitulation, which raises the chance of an upward reversal.
Neutral values close to zero show spent coins whose transactions are close to their cost basis. This can signal that coins with large profits or losses remain dormant. During a bull market correction, it can signal renewed positive sentiment and the chance of a price rebound. In bear markets, it can show investors exiting at their cost basis, which creates extra resistance.
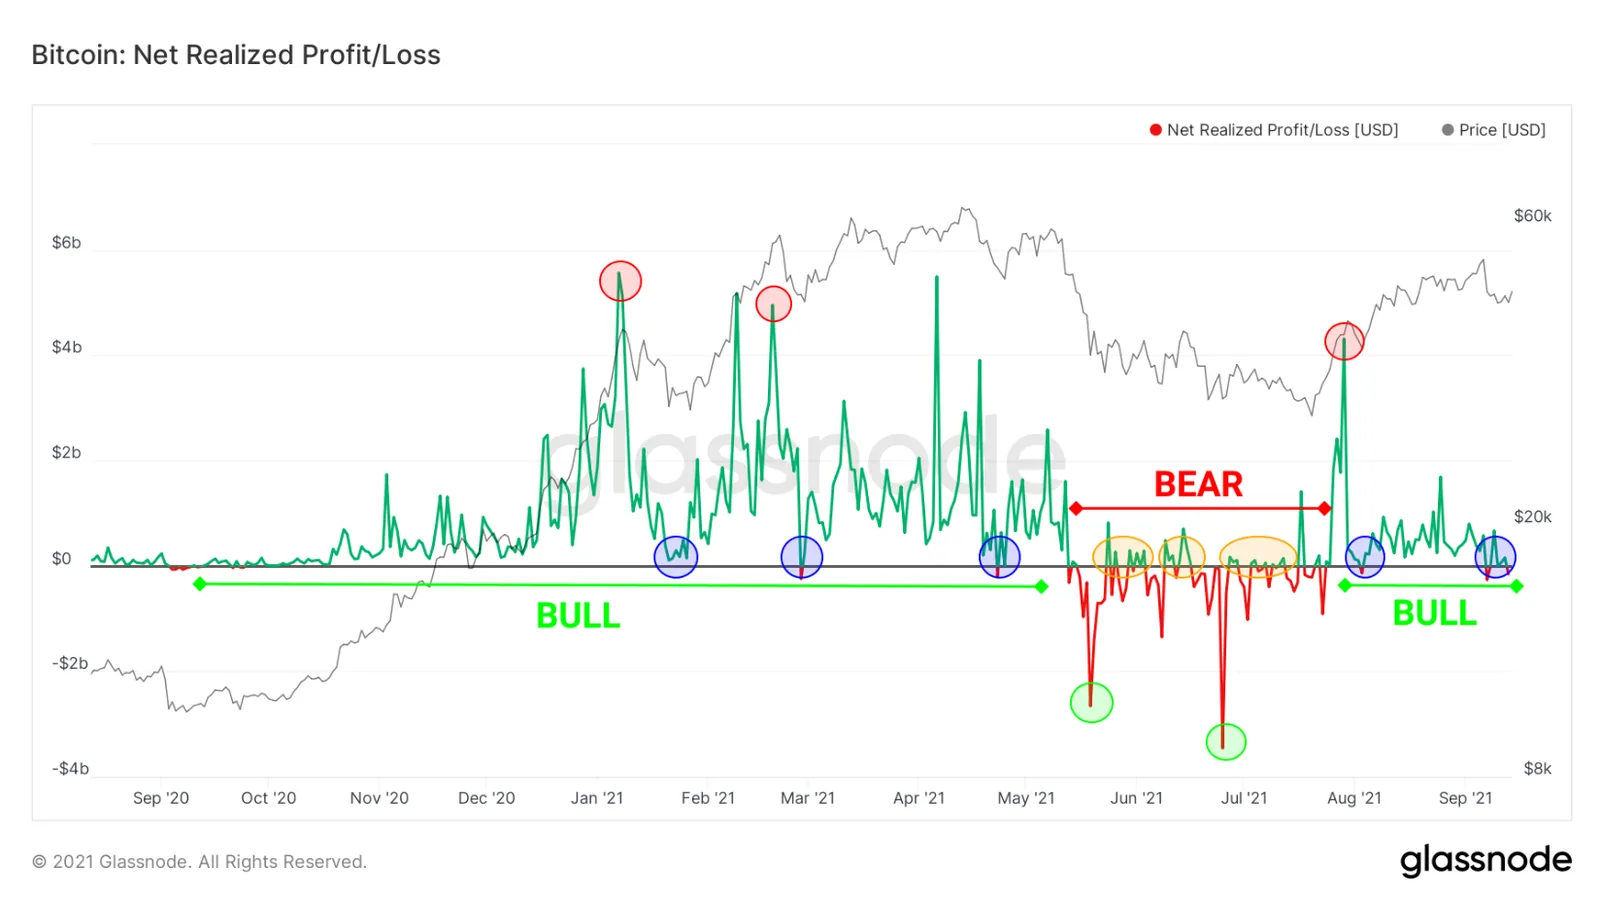
Bitcoin NPL
Source: Glassnode academy