SF - Network value to transactions ratio
Ratio of network value to transaction volume
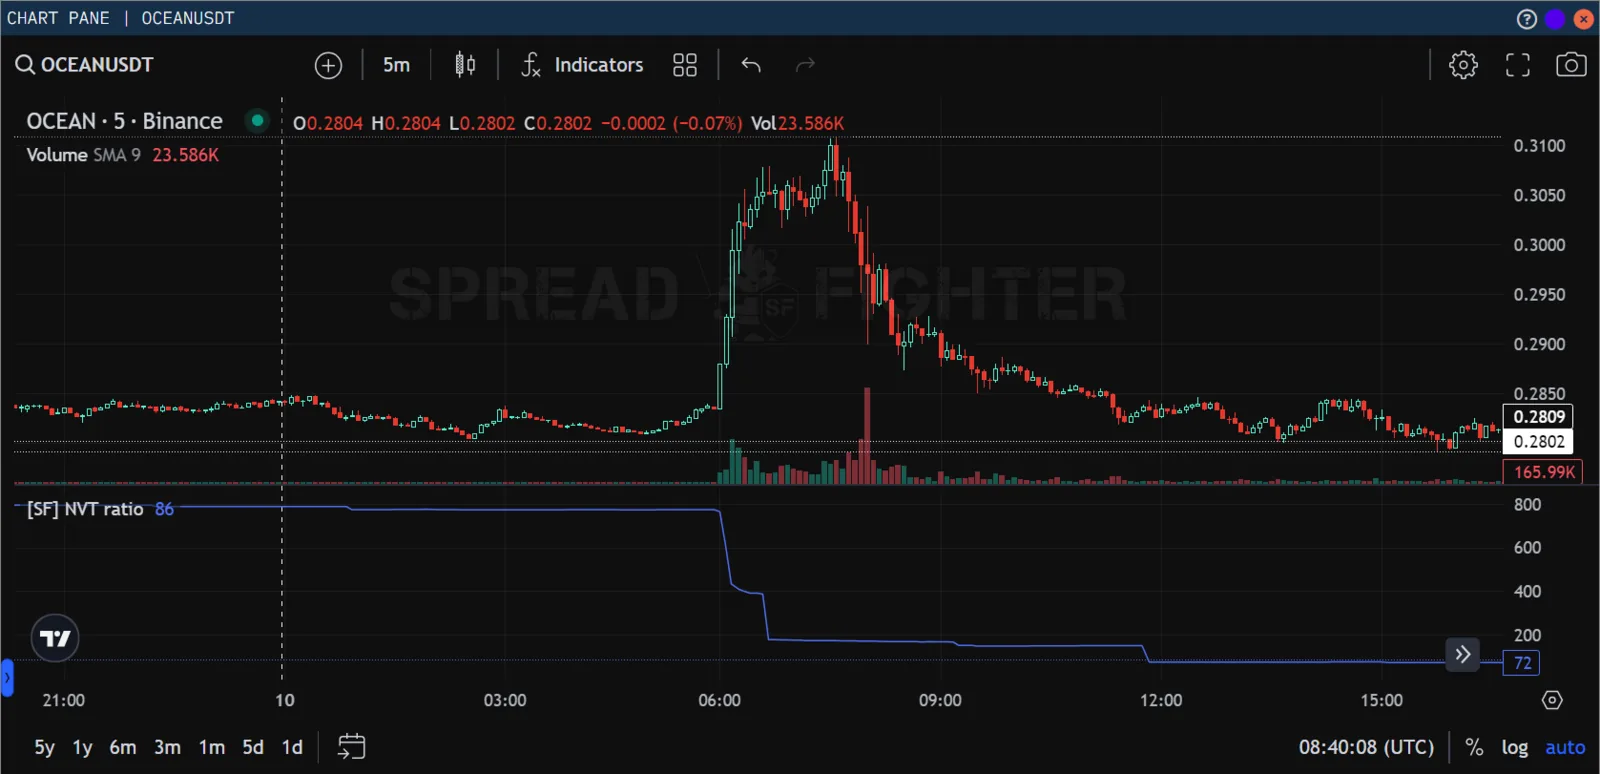
Indicator appearance
Description
Network value to transactions ratio is a sentiment analysis indicator. It shows the ratio of network value to transaction volume and describes the relationship between market capitalization and transfer volume.
According to Willy Woo, who created the metric, it can be seen as an analogue of P/E (price to earnings) in traditional markets.
Features
In the graphics settings window, the user can choose the display colors and the opacity of the indicator.

Indicator graphics settings
Access by plan
The indicator is available on all subscription plans.
How to use the NVT ratio
NVT was one of the first onchain metrics. It linked two main parts: value and utility. Bitcoin is not only a store of value but also a payment and settlement network. The NVT ratio tries to model the balance and divergence between the network value the market assigns and the utility it gives users in terms of transaction throughput.
An important note on interpreting NVT is how use of the Bitcoin network and market prices have changed and will keep changing over time. As technology develops (for example, the Lightning network), interpretations change, and coin prices rise over time. A direct comparison of NVT values in 2013 with prices in 2021 is unlikely to be clear-cut. As Bitcoin is monetized and spreads, the share of coin holders who use it as a payment network rather than a long-term store of value has changed. So it is recommended to compare absolute NVT values with market cycles of similar maturity, and to give the direction of the trend more weight in analysis than the absolute value.
As a result, it is often useful to apply a moving average to NVT to see broader trends. The chart below shows how, despite the rise in the minimum NVT value over time (which in theory is bearish), for a full assessment
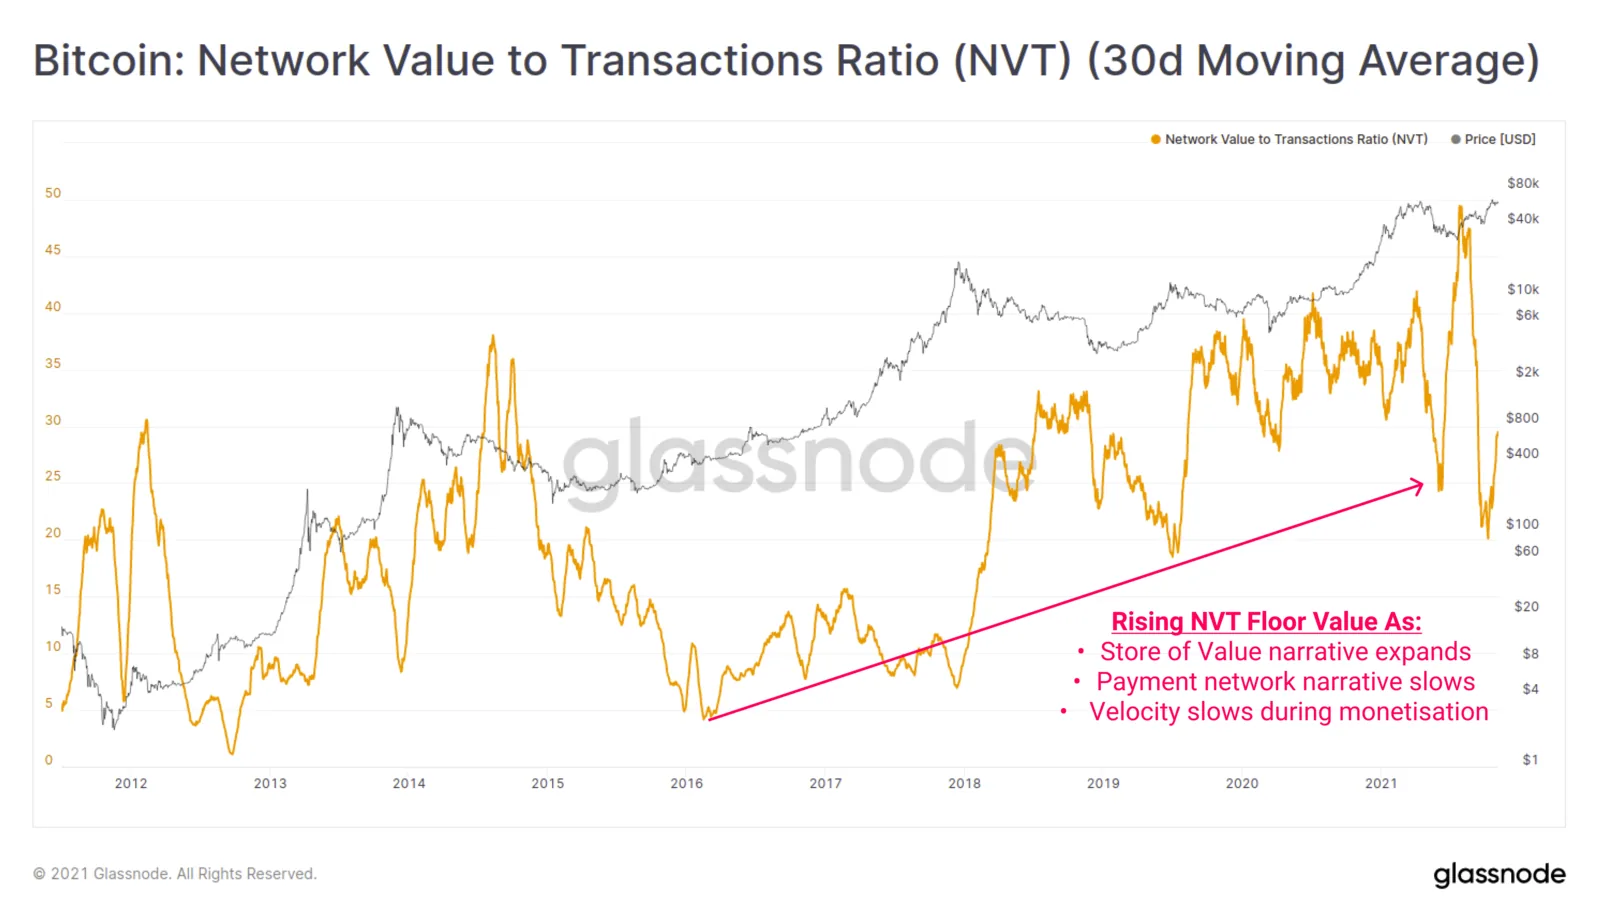
Network value to transactions ratio
NVT ratio signals
The signal NVT provides is usually easy to read, and this simplicity made it a staple of the onchain space. NVT values naturally change every day, but the focus is only on very high and very low NVT values:
High values and rising trends:
Signal: bearish, weakening fundamentals.
Description: The network's valuation runs ahead of the value moved within the network. When value exceeds utility, it suggests falling user demand for settling value and possible overvaluation.
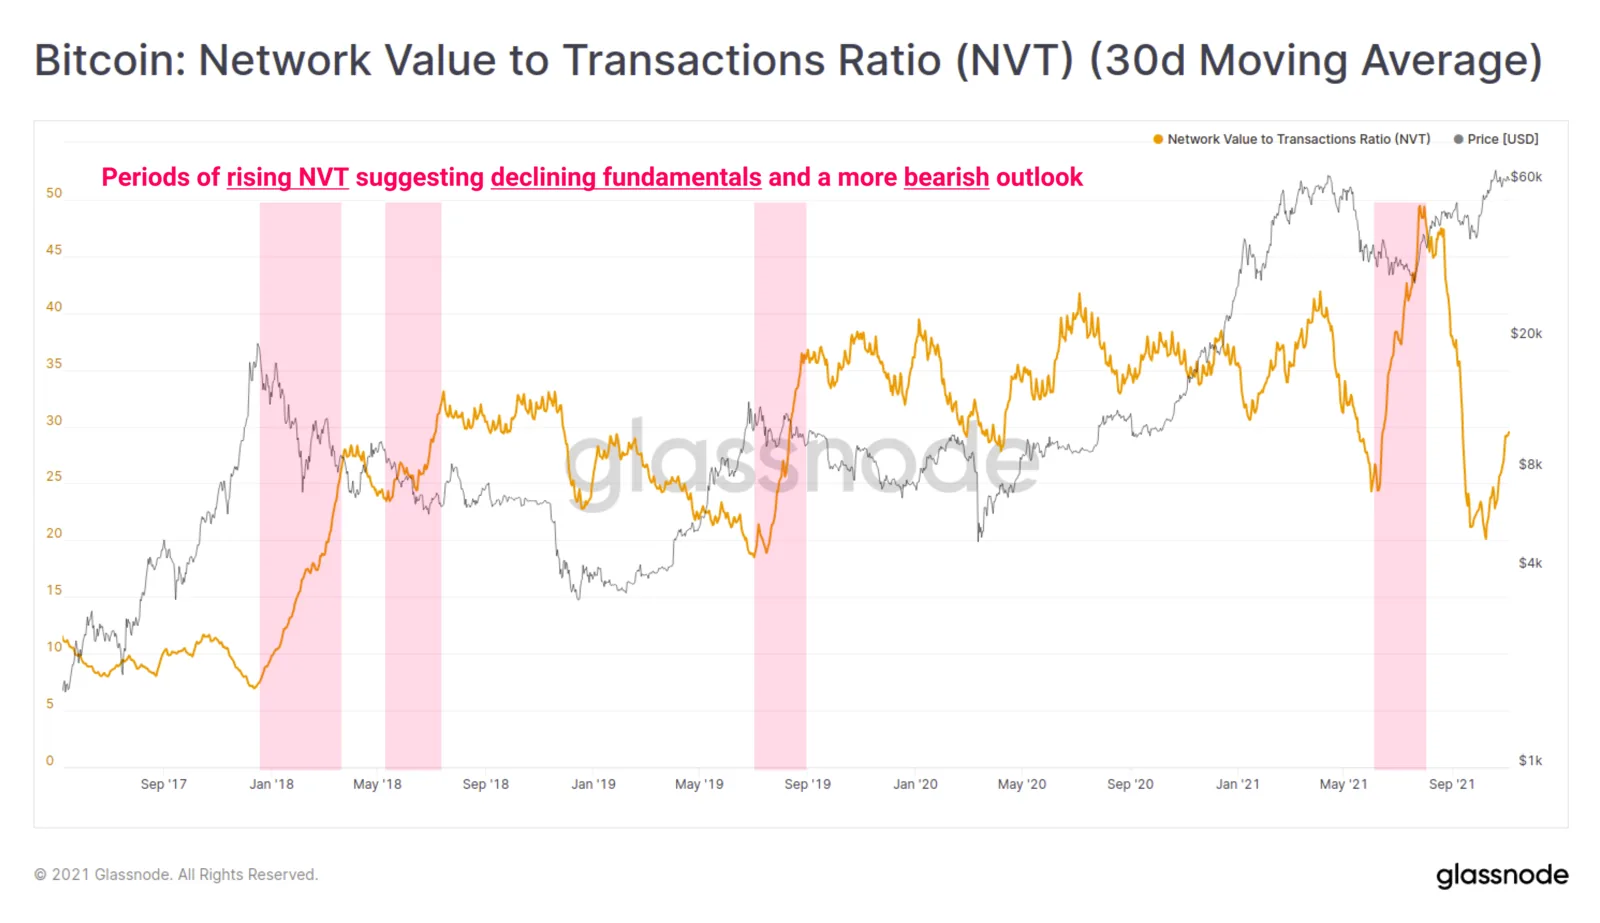
Bearish signals
Low values and falling trends:
Signal: bullish, improving fundamentals.
Description: The value moved on-chain exceeds the network's valuation. This means more users are entering the system and a higher value is being settled, and it can signal undervaluation.
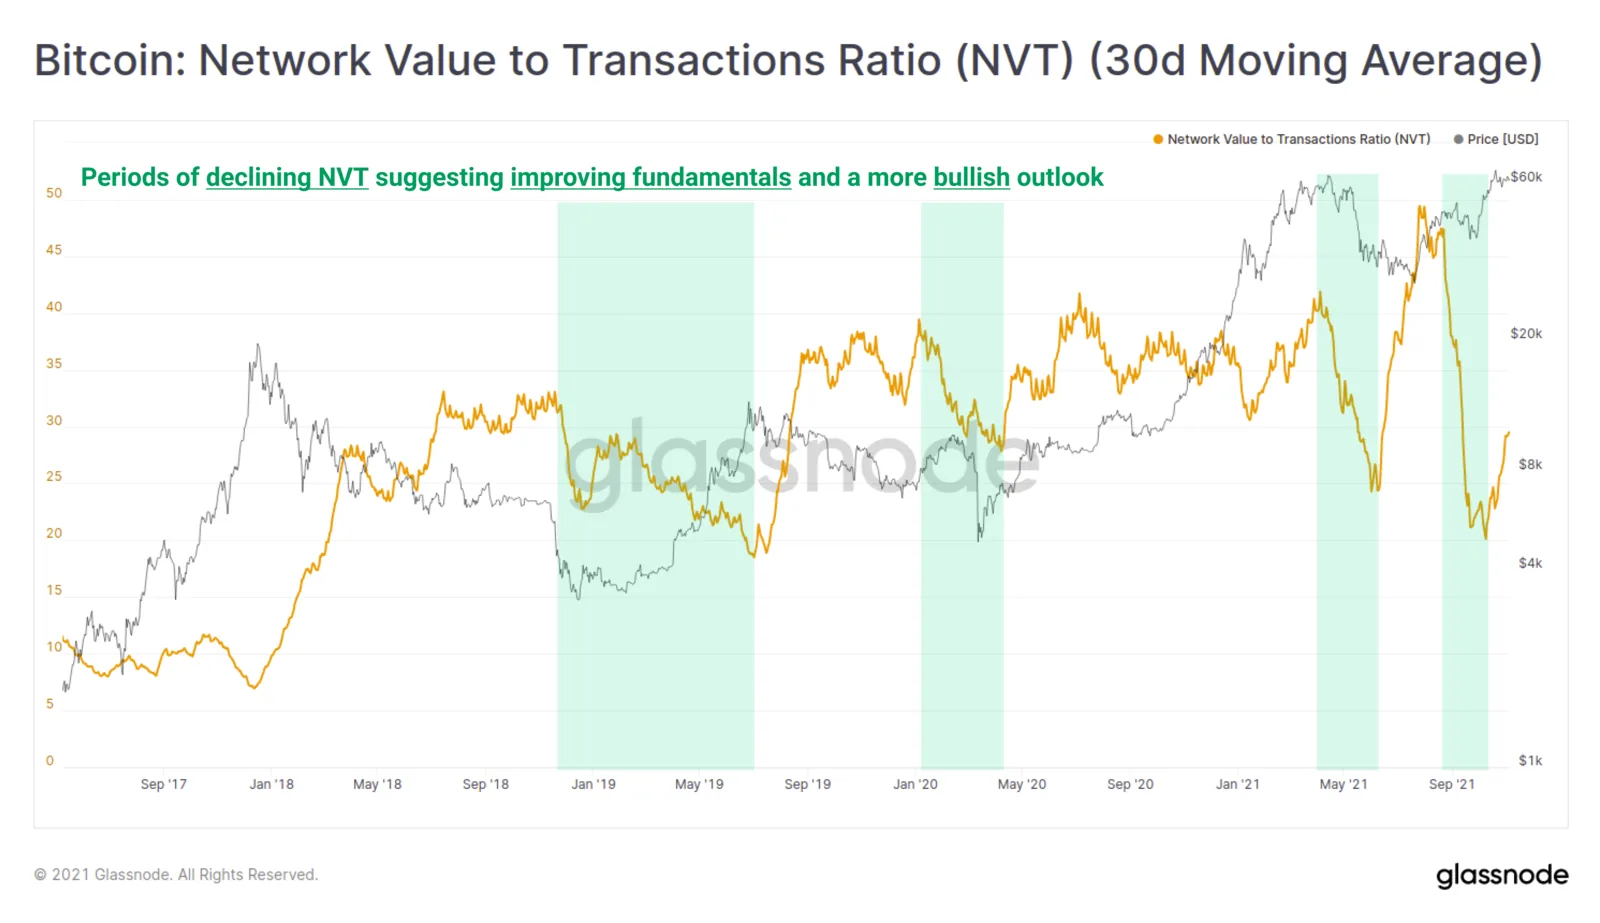
Bullish signals
Flat values and sideways trends:
Signal: stable equilibrium.
Description: The network's value and the value moved on-chain are in balance and change at the same pace. This usually means the prevailing market trend is stable and likely to continue.
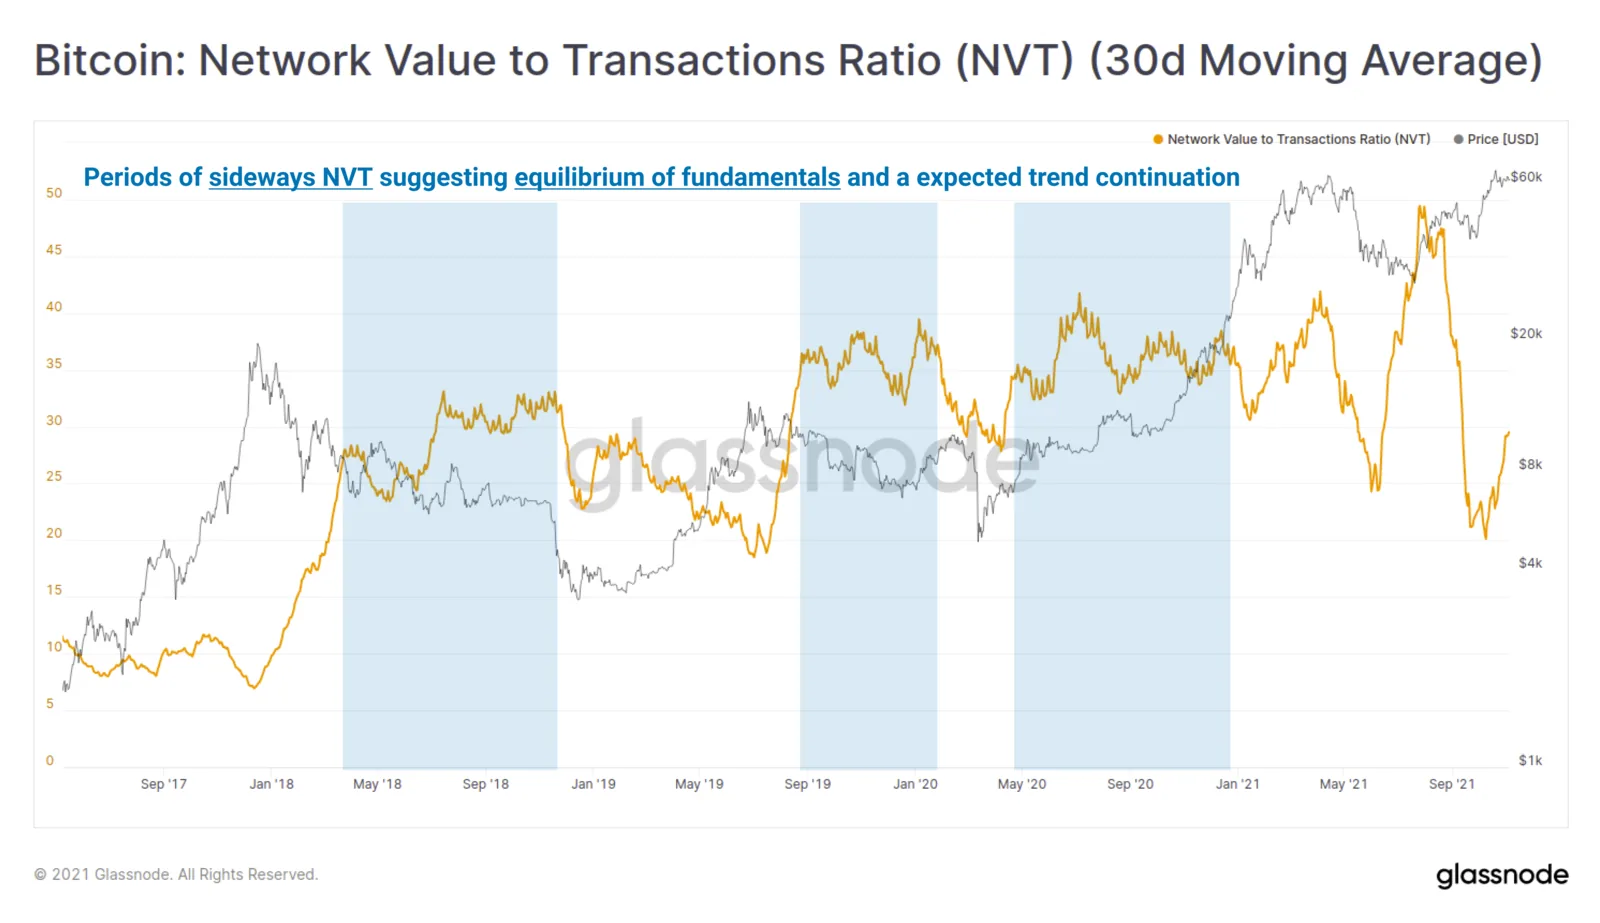
Equilibrium
Source: forklog