SF - Active addresses, Transaction volume, Github activity, Developers activity
Assess how a project is developing, how active its founders are, the practical interest of its audience, and its utility.
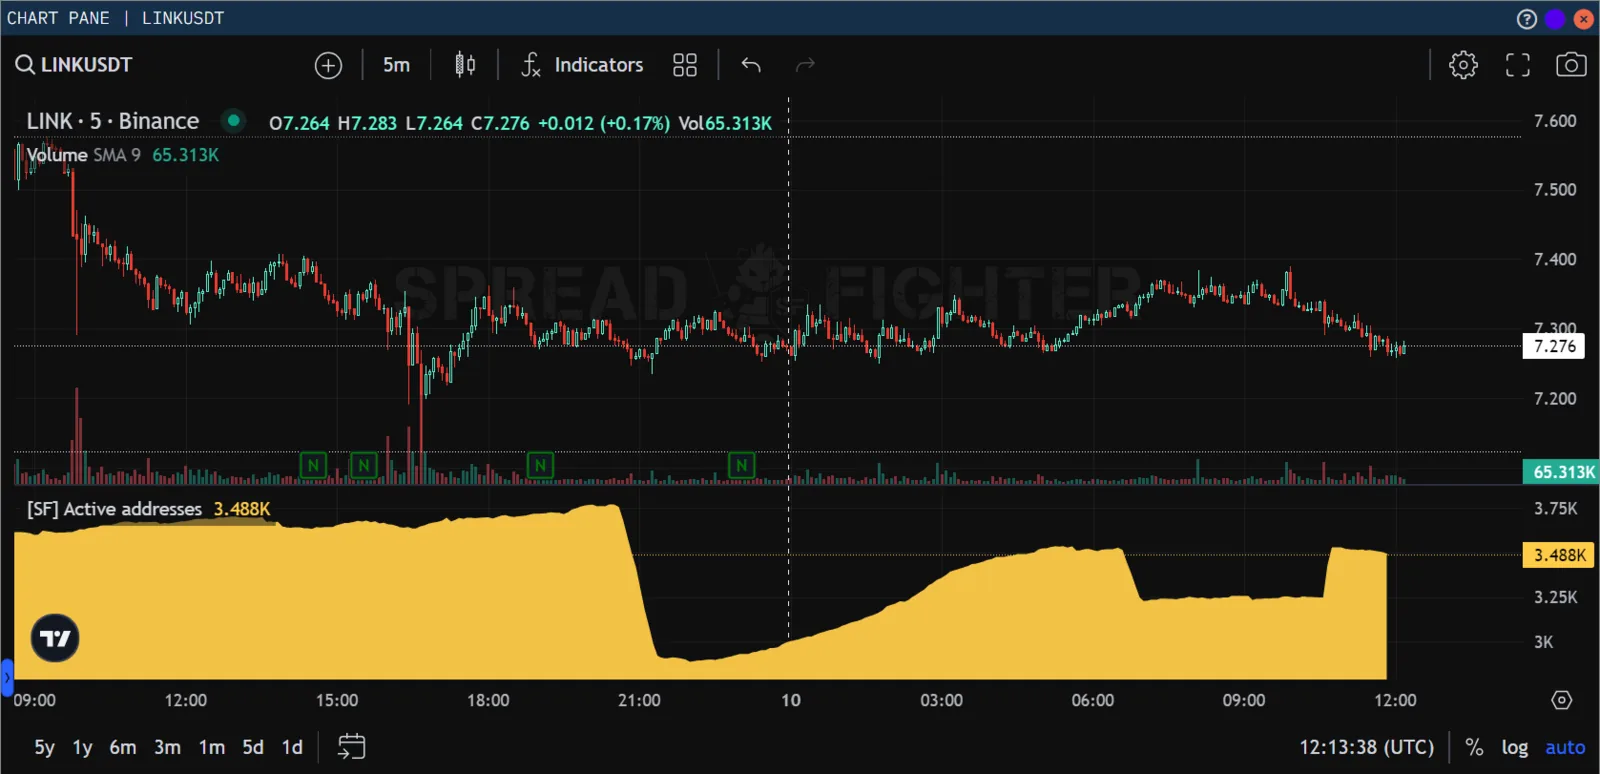
Indicator appearance.
Description
Active addresses is a sentiment analysis indicator that shows the number of active addresses on the network of the token in question.
Active addresses are blockchain addresses that performed some activity over a given period of time.
There are different counting methods. The most popular one counts both the sender and the recipient address of each transaction over a set period (for example, days, weeks, or months). You can also check the cumulative number of unique addresses, which means tracking the total number of active addresses over time.
Transaction volume is a sentiment analysis indicator that shows the volume of transactions on the token's network.
Developers activity is a sentiment analysis indicator that shows the activity of the project's developers.
Github activity is a sentiment analysis indicator that shows developer activity on the project's Github page.
Functionality
In the style settings window, the user can choose the display colors and the transparency of the metric.
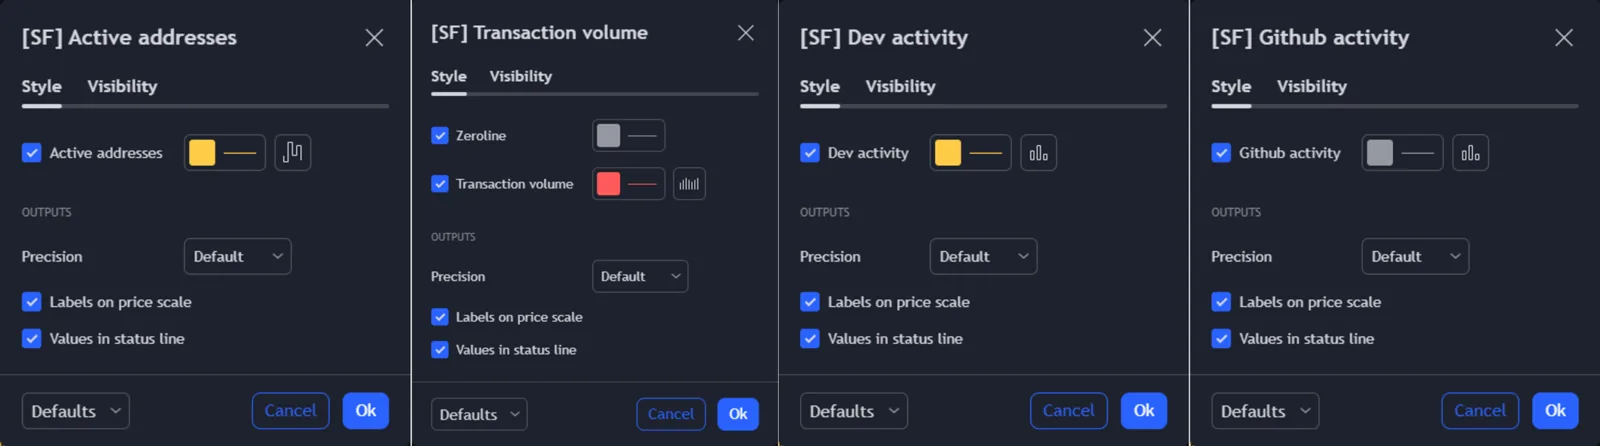
Indicator style settings.
Indicator access by plan
| Indicator | Basic | Trader | Pro |
|---|---|---|---|
| Active addresses | - | + | + |
| Transaction volume | + | + | + |
| Developers activity | - | + | + |
| Github activity | + | + | + |
Use cases
The number of active addresses that interact with a token, and developer activity, are important metrics that show in numbers:
- how the project is being developed and how its pace changes over time;
- how actively the project's audience interacts with the token.
These metrics point to the project's utility and the fundamental usefulness of its token.
Disclaimer: the authors of this article have no bias toward any of these projects
Tellor (TRB)
Tellor (TRB) is a decentralized oracle platform for DeFi.
The project regularly shows high developer activity and a large number of active users.
In the second half of August 2023, the project signed a partnership agreement with DWF Labs, a large liquidity provider and investment firm.
Rotations in participants' portfolios are also reflected in the Active addresses and Transaction volume metrics.
Soon after, the token price rose by more than 15 times.
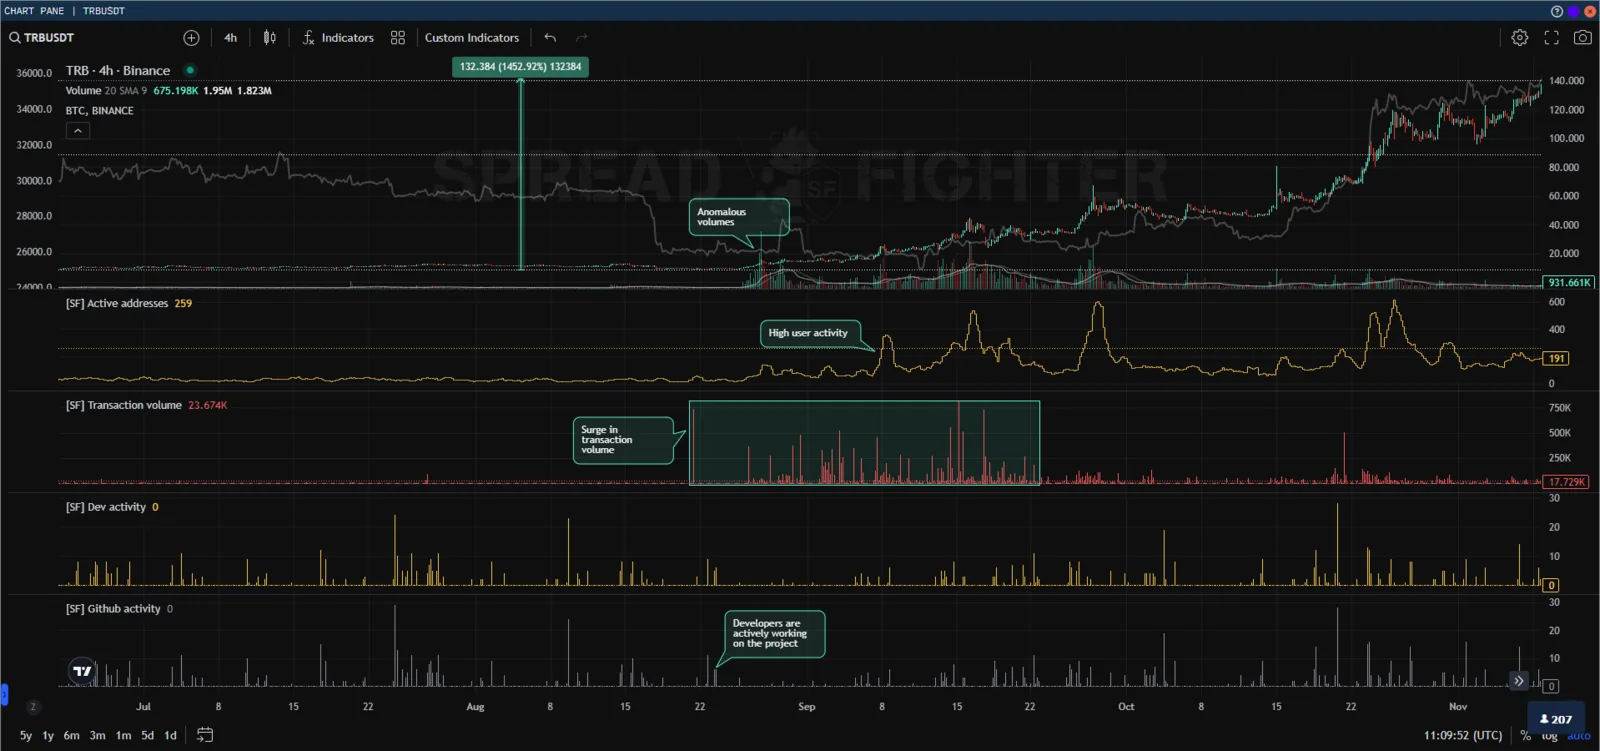
Tellor (TRB).
Fundamentally strong assets are potentially much more interesting to large investors and liquidity providers
Aragon (ANT)
ANT is the governance token of a decentralized platform built on the Ethereum network. The platform offers a modular way to create and manage dApps, crypto protocols, and decentralized autonomous organizations (DAOs).
Source: block-chain24.com
The asset shows stable, high, and regular activity from developers and users.
The ANT price grew 212% in 2023, which is 1.5 times the benchmark.
The Bitcoin price is used as the benchmark. Price growth for the period from 10 Nov 2022 to 10 Nov 2023 was ~132%.
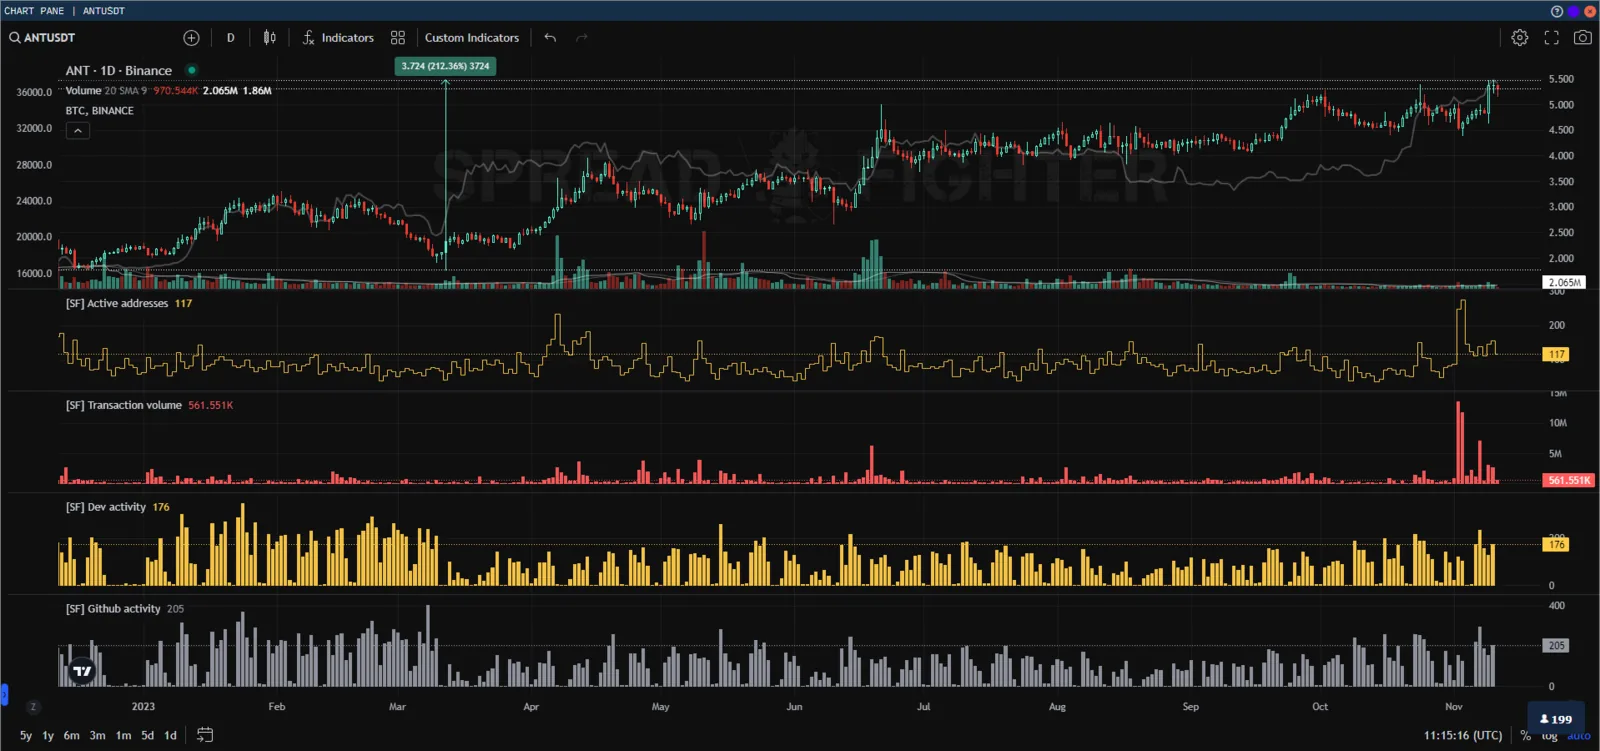
Aragon (ANT).
Ocean Protocol (OCEAN)
OCEAN is the native ERC-20 token of the Ocean Protocol data management platform.
Ocean aims to help users unlock the use of data on the blockchain, especially for AI. It is designed to scale for high speed, and it uses the blockchain to guarantee data integrity.
Source: block-chain24.com
The asset shows stable, high, and regular activity from developers and users.
The OCEAN price grew 245% in 2023, which is 2 times the benchmark. At the peak, growth reached 330%.
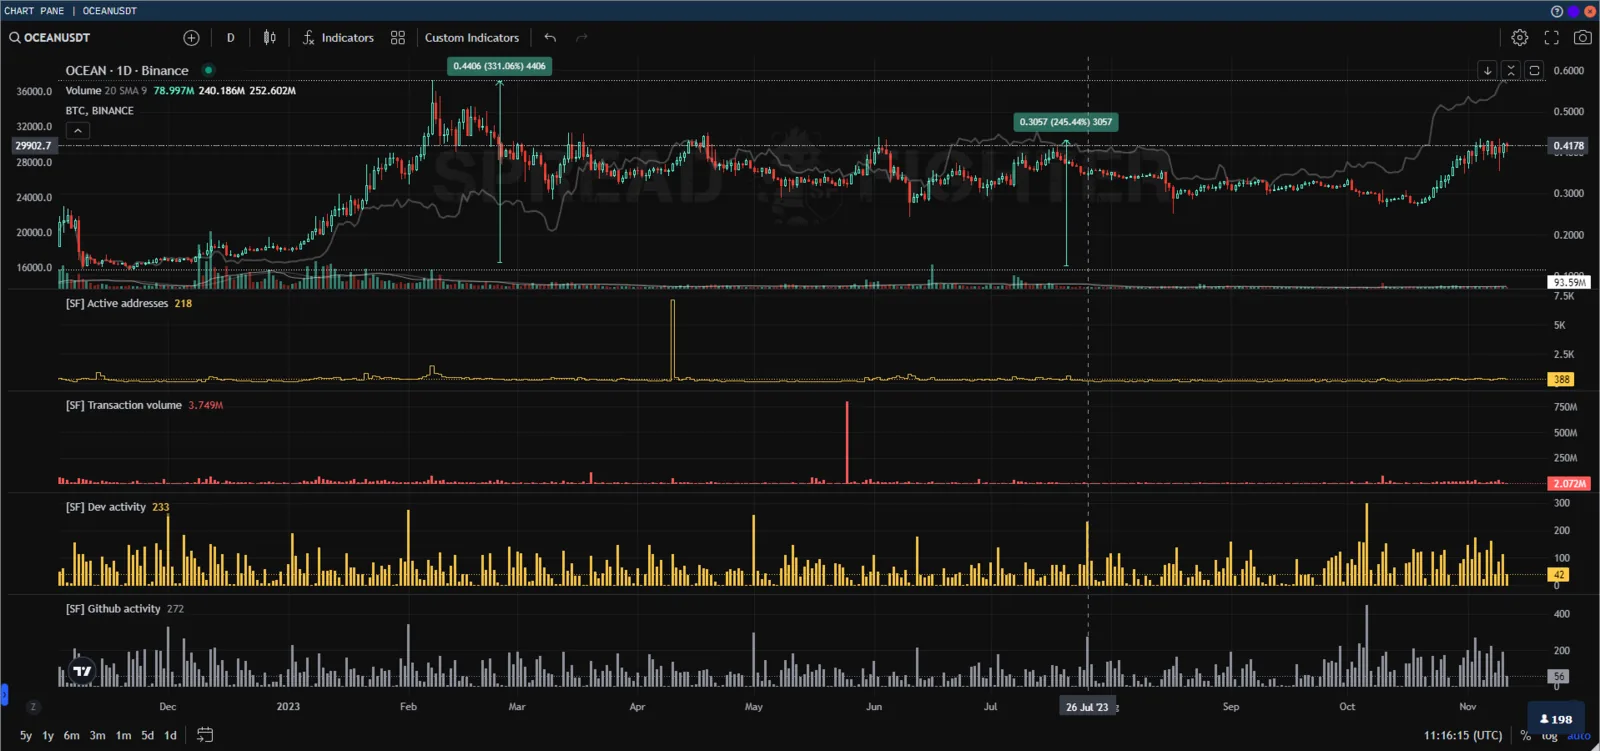
Ocean Protocol (OCEAN).
Stepn (GMT)
The STEPN app was developed by the Australian company Find Satoshi Lab. Its co-founders, Jerry Huang and Yawn Rong, have many years of experience in mobile development. The startup's advisers include Scott Dunlap, Vice President of the digital division at Adidas Runtastic, and William Robinson, who works at Alliance DAO.
Source: forklog
The project became the flagship of the move-to-earn category. It outperformed the market for several months in 2022 despite the bear market, and it was discussed very actively on social media.
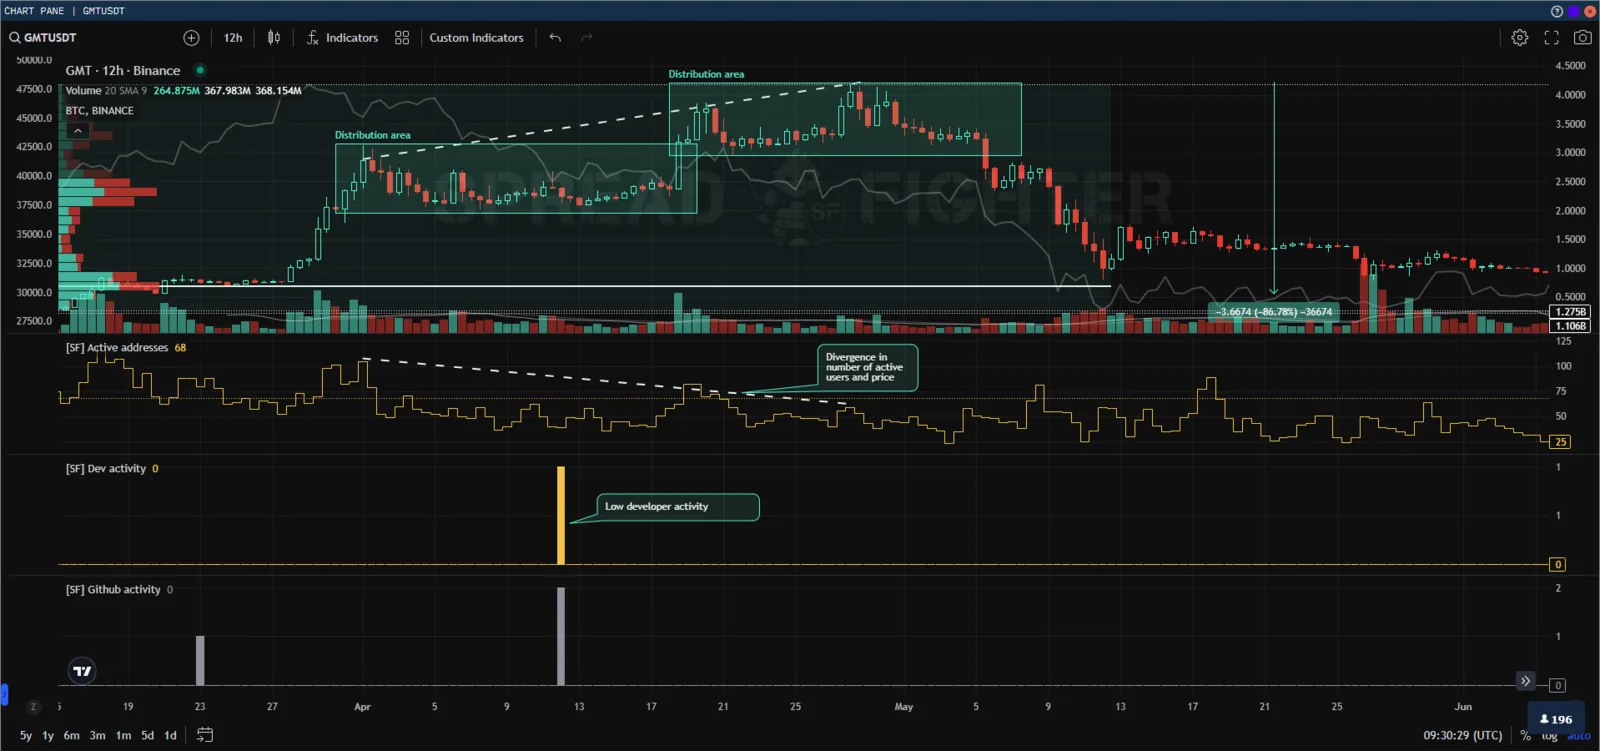
The onchain metric "Active addresses" helps determine how many users are interested in the project. Here, there is a persistent divergence between the asset price and the number of new users in the distribution zone. Meanwhile, the developers show fairly weak activity.
Taken together, these indicators can be a signal for an investor to take profit or to hedge a long position. They can also be a signal for a short/medium-term trader to open a short position, because the project shows clear fundamental weakness and the developers show no desire to develop it.
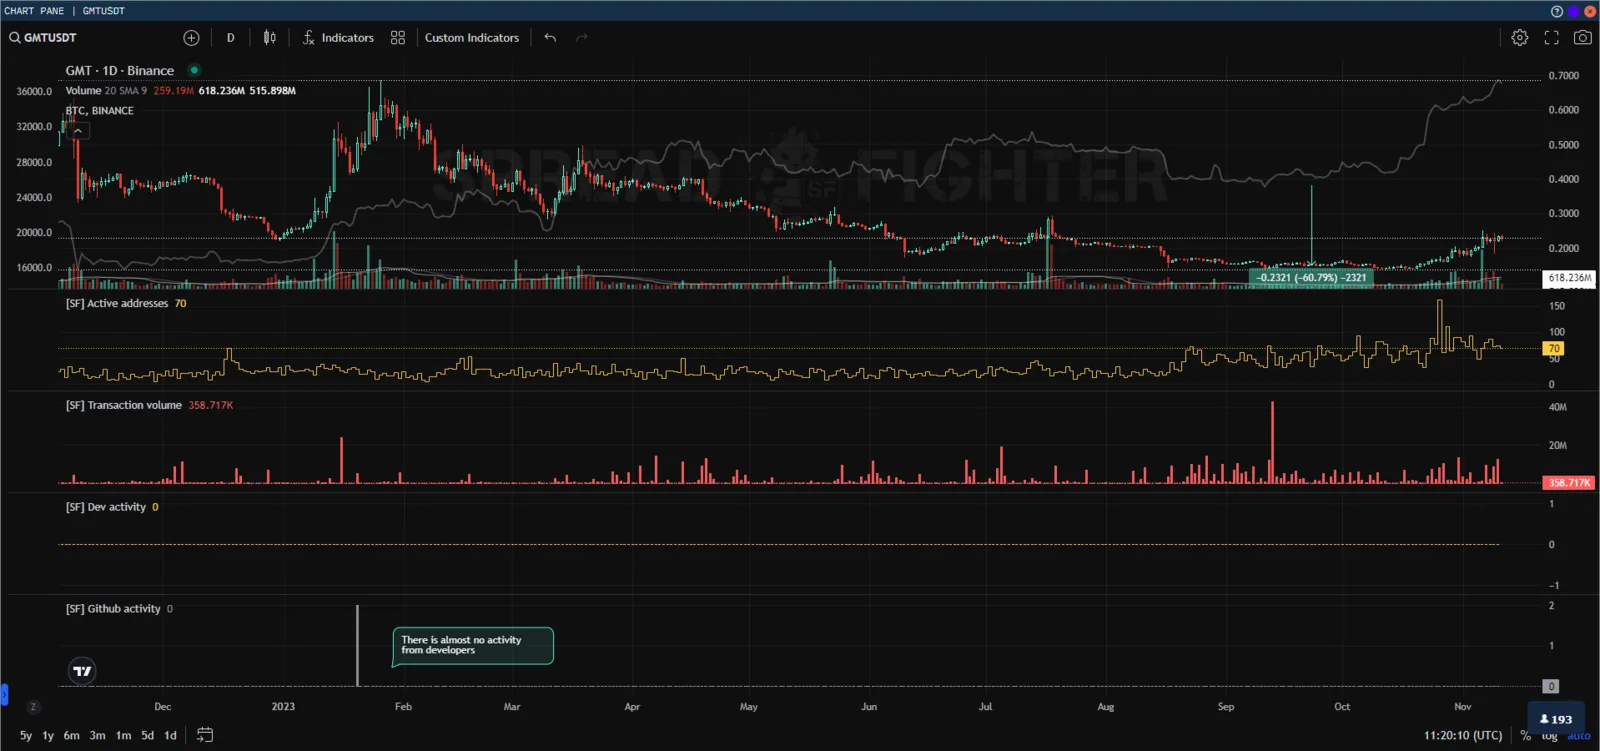
Over time, the GMT price fell 86%, while the benchmark fell 25%.
Stepn (GMT).
The project showed positive dynamics relative to the broad market only during the move-to-earn hype. Afterward, the GMT token lagged the market.
Stepn (GMT).
Balancer (BAL)
Balancer is an automated market maker, decentralized exchange (DEX), and liquidity pool protocol built on Ethereum. It lets users provide liquidity for several assets at once. The Balancer token (BAL) acts as a governance token. It powers functions such as issuance rewards and whitelisting of pools for liquidity mining. When users trade, their orders are filled by several pools with better prices and a smaller spread.
Source: block-chain24.com
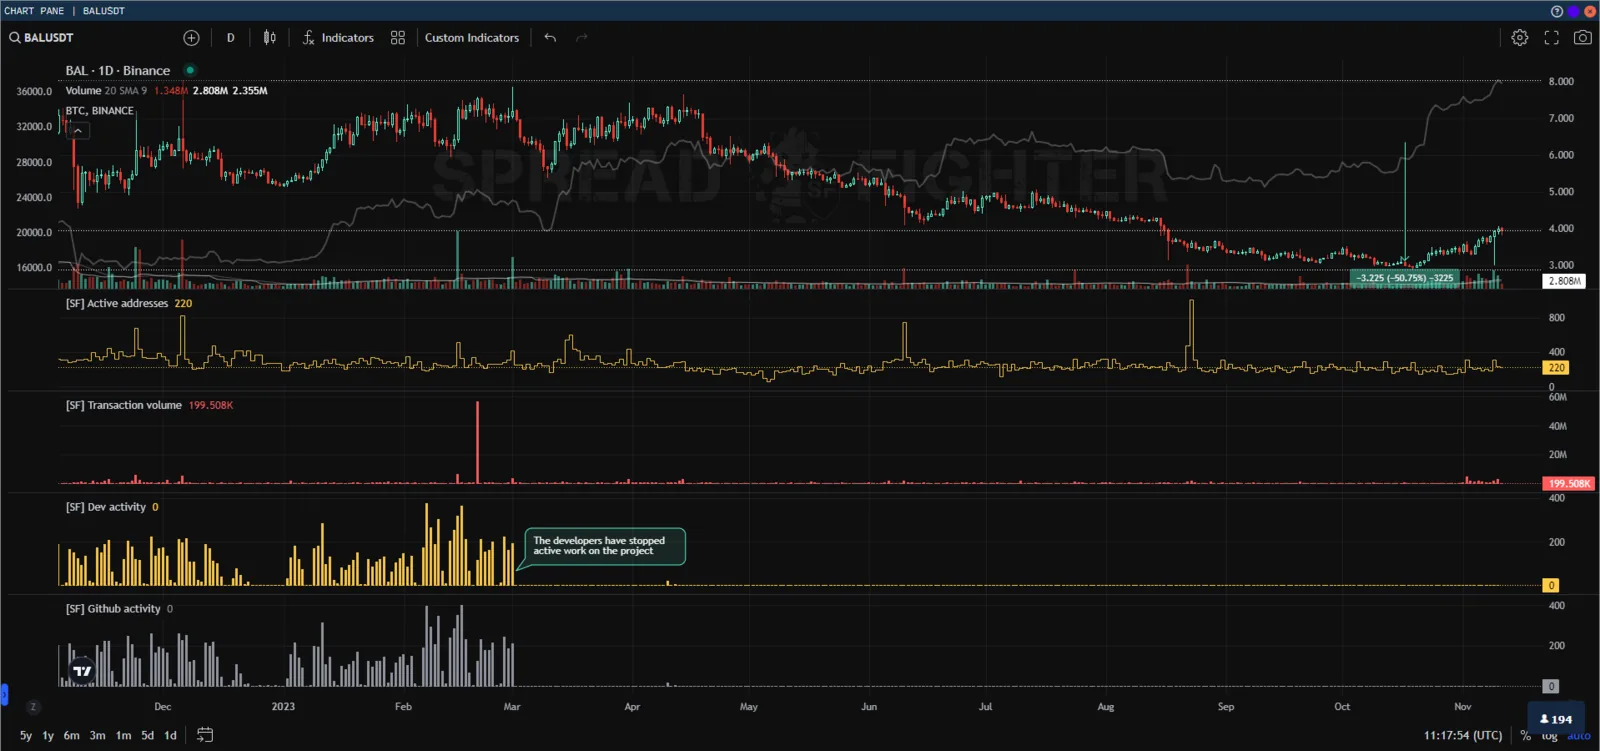
The project developed until March 2023, and after that developer activity faded. In 2023, the BAL token lost 50% of its value from that point, while the benchmark gained 130%.
Balancer (BAL).
Synthetic positions
Let's look at how portfolios of the coins above, synthetic positions, and baskets would behave.
To keep things simple, assume the agent invested $ 1000 in each project. The positions as of 10 Nov 2022 are then:
| Asset | Price | Position | Symbol |
|---|---|---|---|
| ANT | $ 1.826 | $ 1000 / $ 1.826 ~ 547.65 | ANTUSDT*547.65 |
| BAL | $ 5.2 | $ 1000 / $ 5.2 ~ 181.06 | BALUSDT*181.06 |
| GMT | $ 0.2367 | $ 1000 / $ 0.2367 ~ 2388.35 | GMTUSDT*2388.35 |
| OCEAN | $ 0.1460 | $ 1000 / $ 0.1460 ~ 6849.32 | OCEANUSDT*6849.32 |
| TRB | $ 11.51 | $ 1000 / $ 11.51 ~ 86.89 | TRBUSDT*86.89 |
Besides ROE, the analysis also relies on classic risk assessment models: Beta, Common active return measure, and Standard active return measure. They let you assess how the equity of the portfolio depends on the equity of the broad market, and measure the risk premium.
Tellor (TRB) strongly affects the final result because of its rapid price growth and volatility in the second half of 2023, so it is excluded from most of the examples.
Example 1. Buying a broad index
Ticker: ANTUSDT*547.65+OCEANUSDT*6849.32+GMTUSDT*2388.35+BALUSDT*181.06
In this case, the agent's portfolio lags the benchmark by ~50%. The portfolio equity also depends heavily on the market narrative.
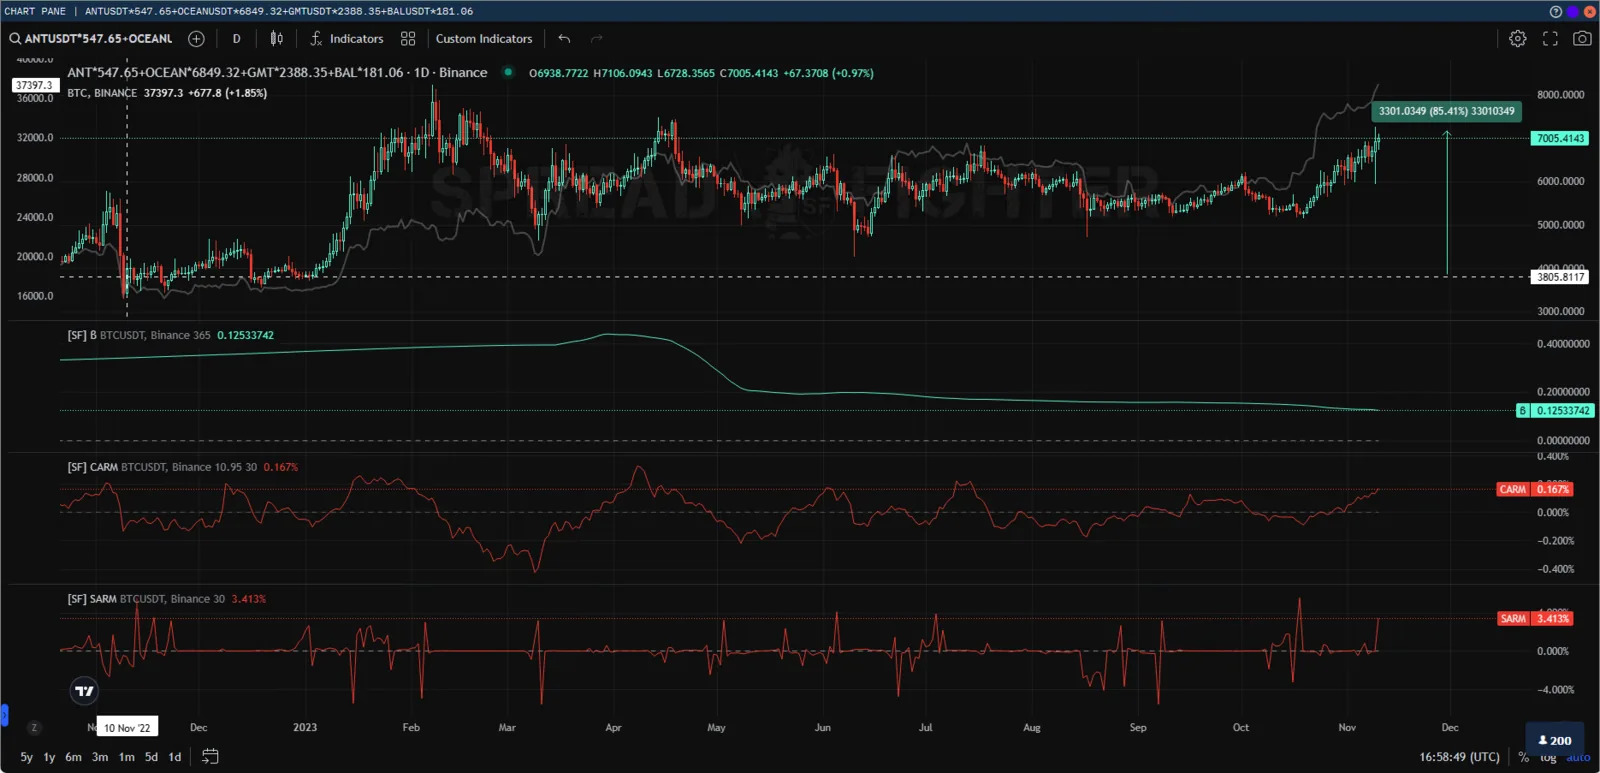
Buying a broad index.
Example 2. Buying only strong assets
Ticker: ANTUSDT*547.65+OCEANUSDT*6849.32
Here the agent's portfolio beats the benchmark by ~80%, which is clearly a plus. However, the dependence on the market narrative has increased.
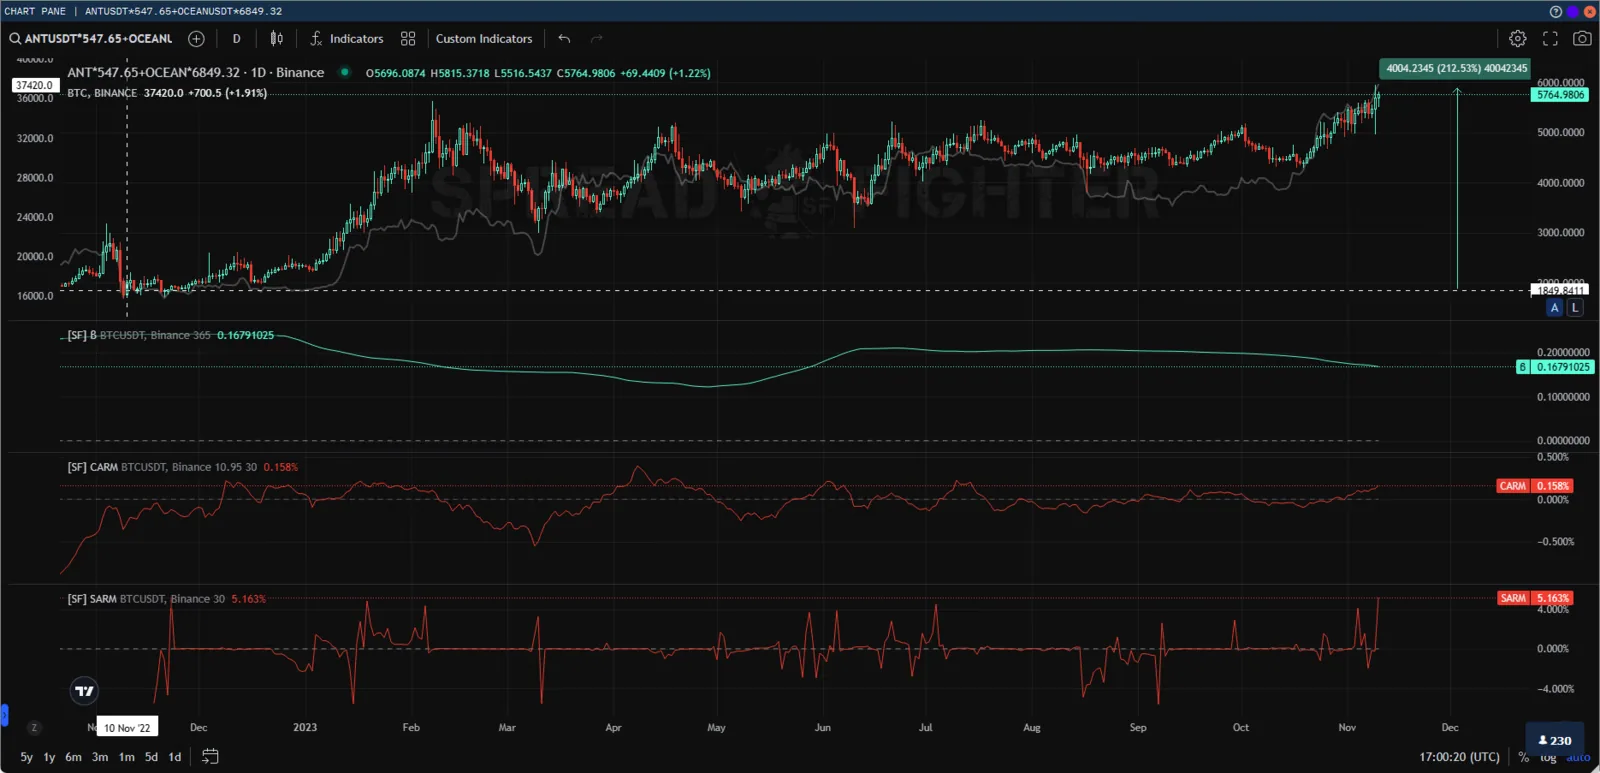
Buying only strong assets.
Example 3. Buying strong assets and hedging with weak ones
Ticker: (ANTUSDT*547.65+OCEANUSDT*6849.32)/(GMTUSDT*2388.35+BALUSDT*181.06)
The agent's synthetic position beats the benchmark by more than 1.5 times. Equity volatility and the dependence on the market narrative are much lower. An excellent result.
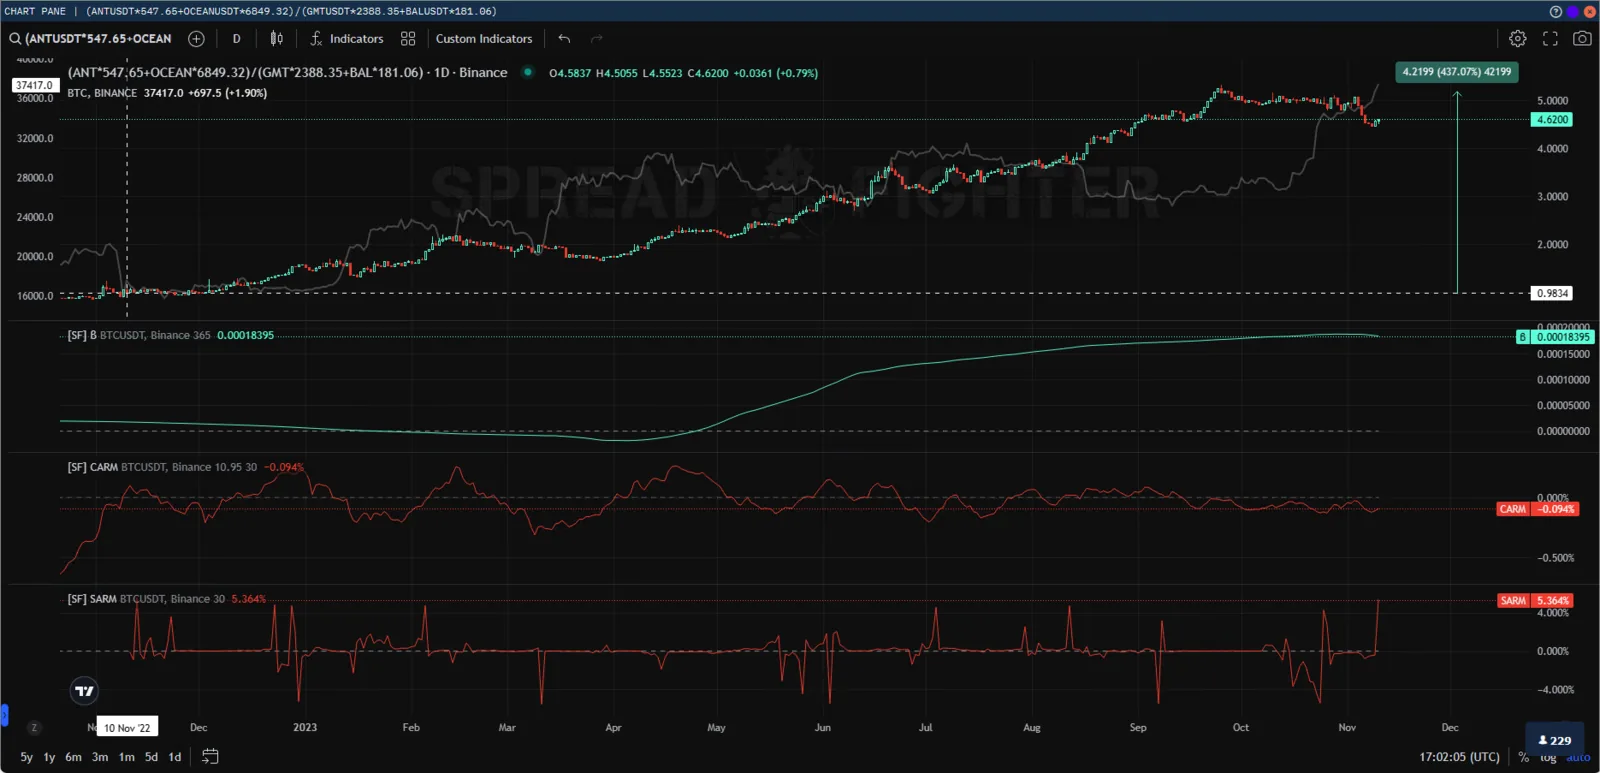
Buying strong assets and hedging with weak ones.
When you look at spreads and baskets, you need to adjust the equity percentage values. Here, divide by 2. If you do not understand why, make sure to work it out. It matters in non-linear trading.
Example 4. Buying strong assets, hedging with weak ones, and a little luck
Ticker: (ANTUSDT*547.65+OCEANUSDT*6849.32+TRBUSDT*86.89)/(GMTUSDT*2388.35+BALUSDT*181.06)
The agent's synthetic position beats the benchmark by more than 4 times. Equity volatility and the dependence on the market narrative are still small. An outstanding result!
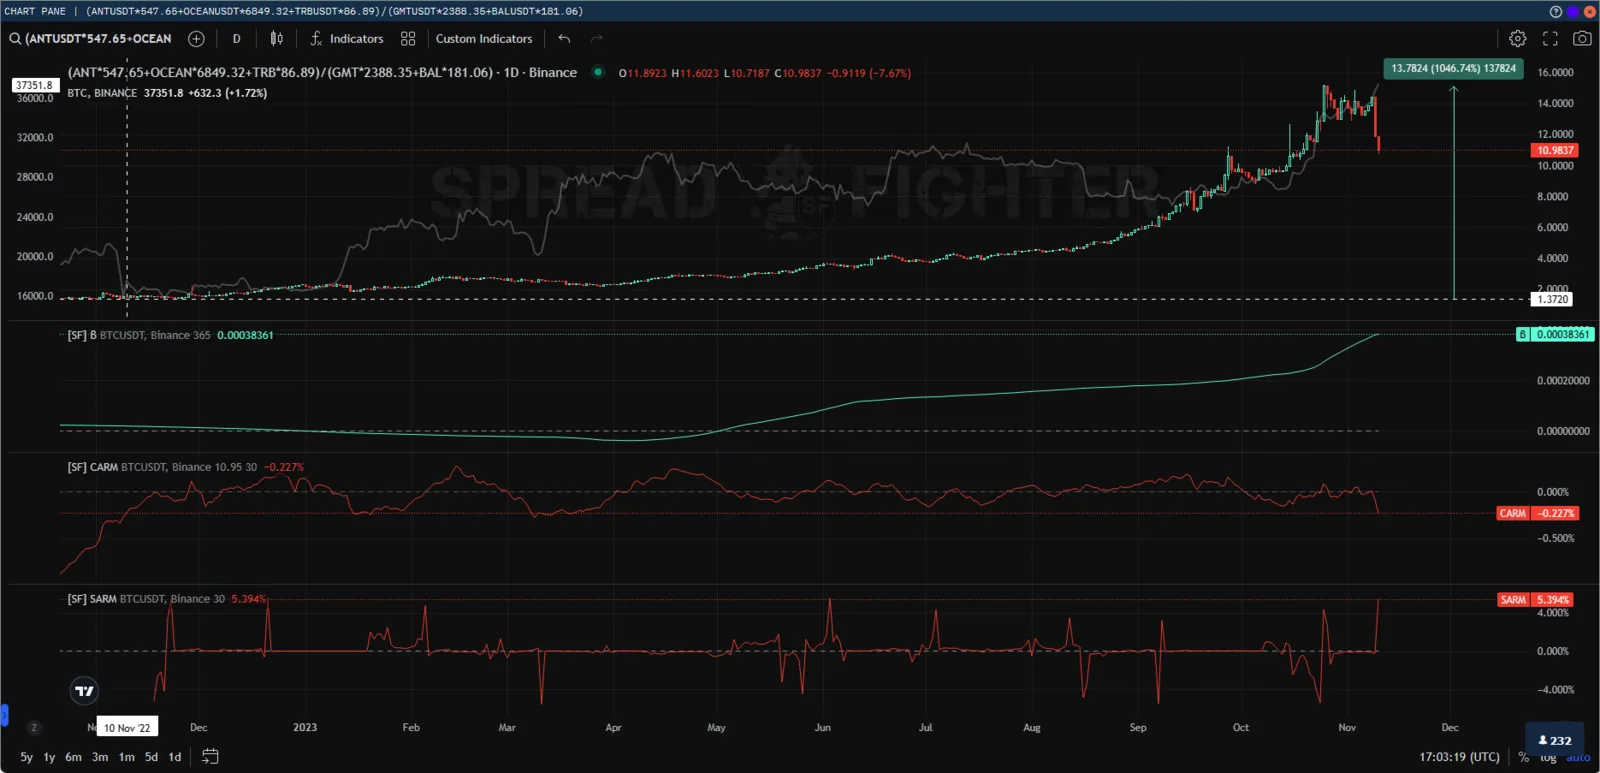
Professionalism and a little luck.
Summary
By analyzing the activity of a project's developers and users, the agent can select fundamentally strong projects (those with high numbers of active wallets and active developers) for the portfolio, and cut risk in fundamentally weak ones (those with low numbers of active wallets and active developers).
With the right skills, plus infrastructure and financial capacity, the agent can build exotic synthetic positions and beat the benchmark several times over.
The cases above are examples. For self-study, we recommend that users do their own research and scale up the logic shown: to wider pools, to better logic for allocating capital across assets, and to better risk management methods.