SF - Social dominance & AI dominance, Social volume total, Sentiment balance & negative & positive total
The share of crypto media discussion devoted to a specific asset relative to the broad market, its significance and its sentiment
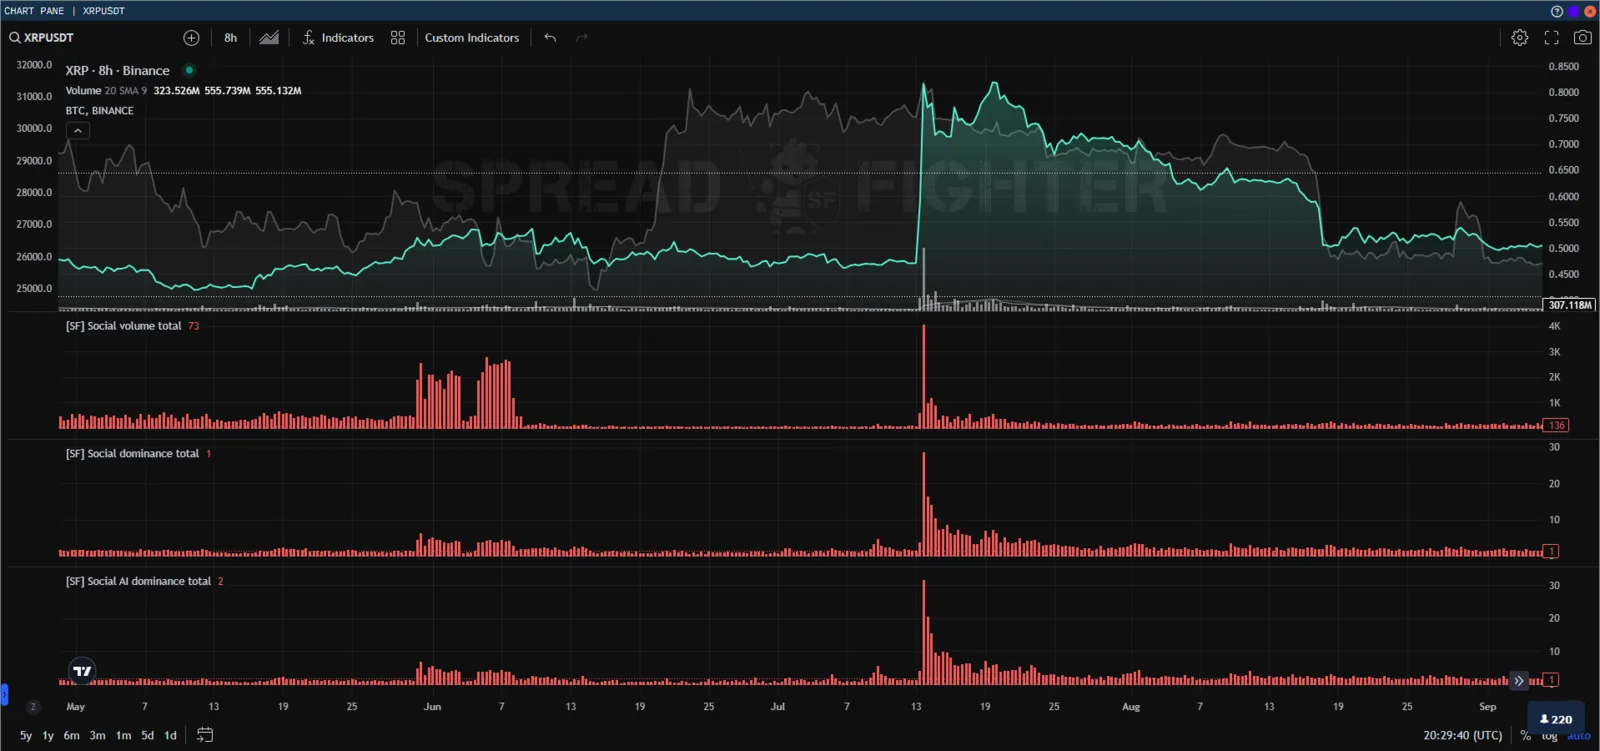
Indicator appearance
Description
Social dominance total is a sentiment analysis indicator that compares the social volume of an asset with the combined social volume of the 100 largest assets by market capitalization.
A social dominance of 50% for an asset means that the number of messages/posts discussing this asset equals half the number of messages/posts discussing assets from the top 100 by market capitalization.
Social AI dominance total is calculated with machine learning algorithms that analyze message content and determine its influence on market sentiment. So Social Dominance AI reflects more accurately how much a given group of users influences the market.
Social volume total is a sentiment analysis indicator that shows the total number of mentions of the selected crypto asset on media resources.
Examples of documents are Telegram messages and Reddit posts. If one short Telegram message contains the word crypto more than once, that message increases the social volume of the word crypto by 1. If a long Reddit post contains the word crypto 10 times, it again increases the social volume of the word crypto by 1.
Sentiment balance total is a sentiment analysis indicator that shows the crowd's sentiment toward the asset. Positive sentiment is colored green, negative sentiment red.
Sentiment negative total is a sentiment analysis indicator that shows the crowd's negative sentiment toward the asset.
Sentiment positive total is a sentiment analysis indicator that shows the crowd's positive sentiment toward the asset.
Functionality
In the chart settings window, the user can choose the display colors and the opacity of the indicator and the zero line.
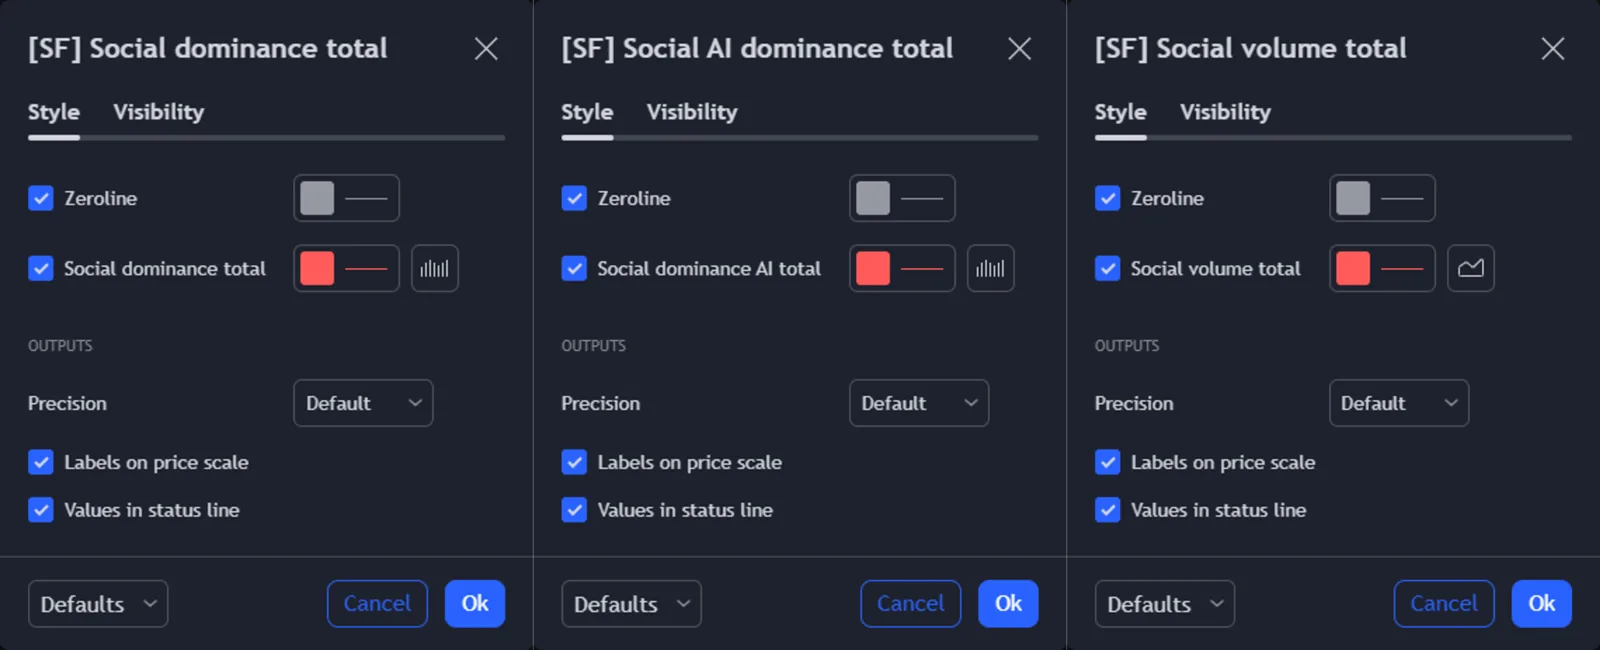
Indicator chart settings
Access by plan
The indicator is available on all subscription versions.
Use cases
Sentiment models let a trader quickly and, most importantly, quantitatively (!) assess the significance and quality of the news flow, save time on data analysis and gain a time edge over other participants.
Assessing news volume and quality
dYdX
dYdX is a market leader in developing open and trustless protocols for advanced crypto-financial products. Over the last three years, dYdX has delivered more than $11 billion in perpetual, margin and spot trading with more than 64,000 unique traders, and has attracted more than $250 billion in borrowings and flash transactions from dYdX liquidity pools.
Source: block-chain24.com
In the second half of October 2023, quite a lot of positive news came out on the asset. However, the Social AI dominance model did not register a news flow significant enough for a serious change in the asset's price. Later the asset rose in price but did not lose its correlation with the benchmark and moved with the market.
The opposite happened in mid-November. Positive news came out on the asset again, though not on such a scale. But Social AI dominance rated their impact much higher than that of the earlier news. The price reacted with a 30% rise, a loss of correlation with the benchmark (BTC did not change in price over this time), and a rise in the CARM value.
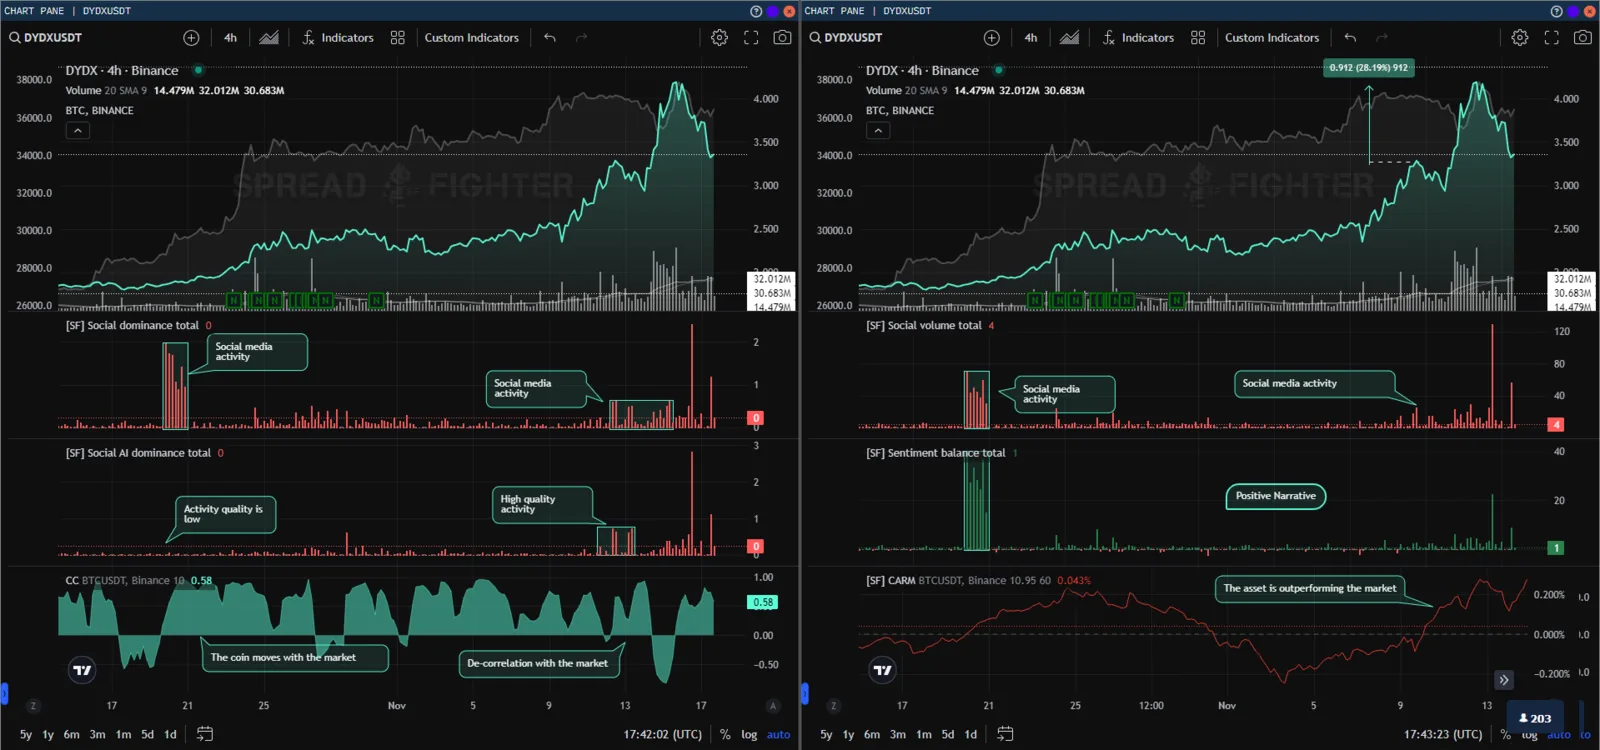
*dYdX *
UniFi Protocol
UniFi Protocol is positioned by its developers as an interoperable DeFi ecosystem launched on several public networks. UniFi provides unique and powerful incentives for liquidity providers, traders and farmers through its unique token economics. UniFi currently runs on Binance Smart Chain, Ethereum, TRON, Ontology and Harmony.
Source: block-chain24.com
In mid-July 2023, activity starts in social media
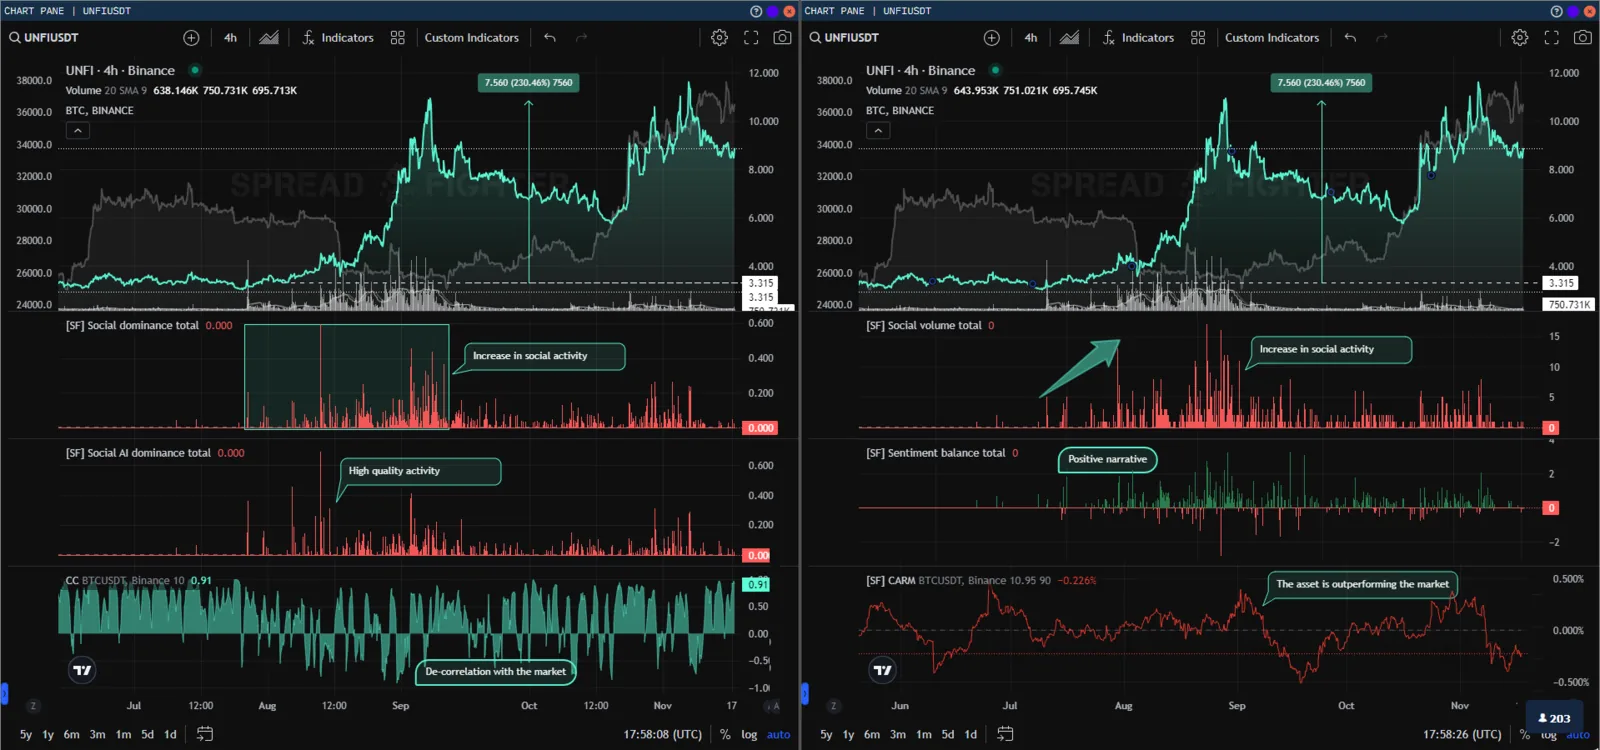
UniFi Protocol
To look for medium-term position trades, use tools that assess the transaction flow of large holders. In the case of UNFI, using the Whale balance and Whale CEX balance models, you can see a steady trend of large holders accumulating the supply.
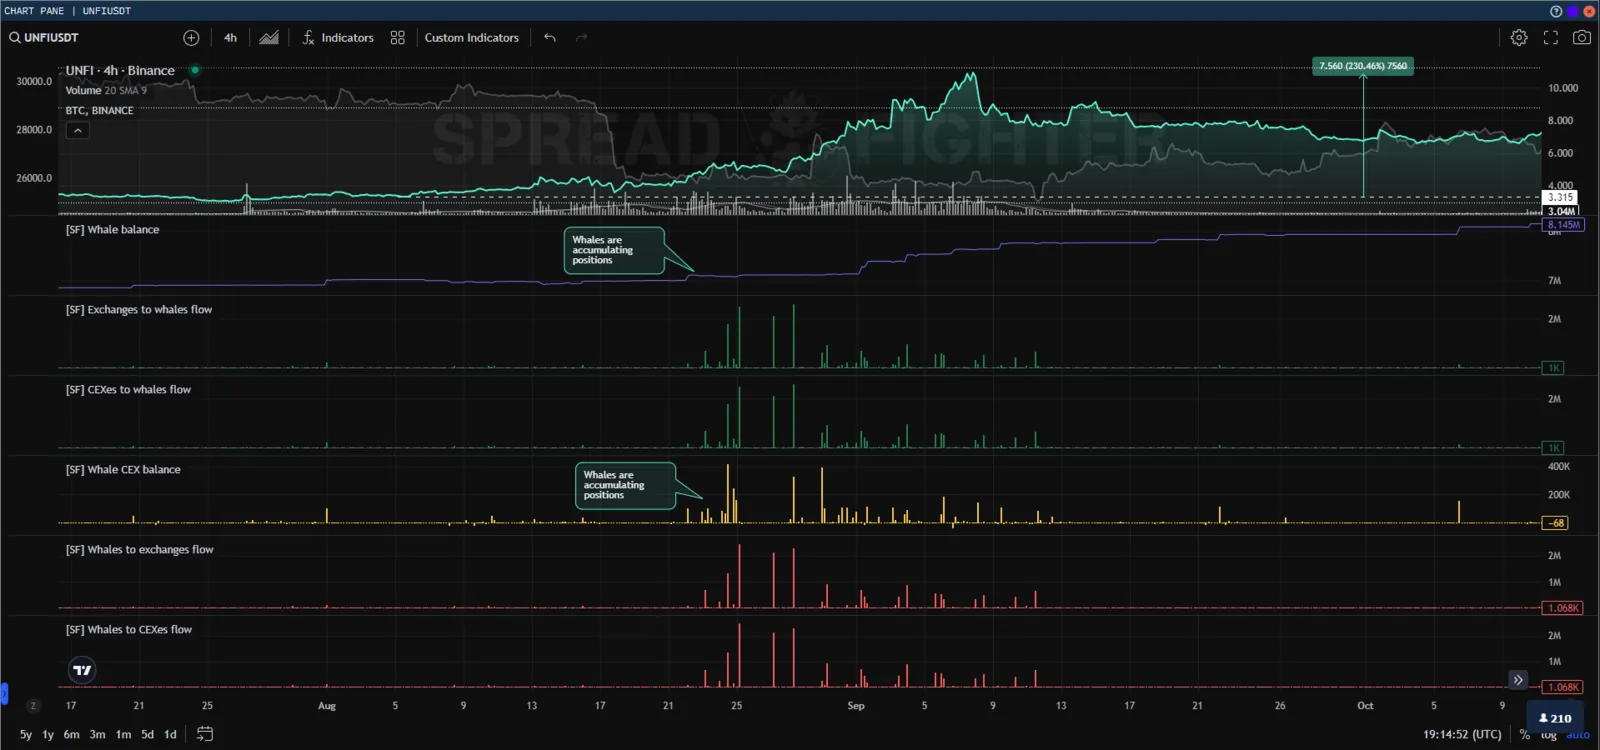
UniFi Protocol and whales
Combination with microstructure tools
Social sentiment models work very well together with microstructure tools: Social AI dominance assesses the volume of news, Sentiment balance the narrative, Net OI the reaction (or lack of one) in money from the taker and maker sides, and Manipulation monitor the presence or absence of toxic order flow.
ICON (ICX) is the base asset and native cryptocurrency of ICON Network, a decentralized blockchain network focused on interoperability.
Source: block-chain24.com
On 11-13 Nov 2023, social activity abnormal for the project begins on media resources. It is accompanied by:
- a jump in volatility and a rise in price;
- manipulation activity;
- the taker side opening longs worth $5M and shorts worth ~$2M. The average position entry price was $0.3126.
After ~1 hour, media activity fades, and so does the inflow of money from traders. After manipulation activity drops, the token price first returns to its original level, and then falls even further, by 21%, together with the broad market.
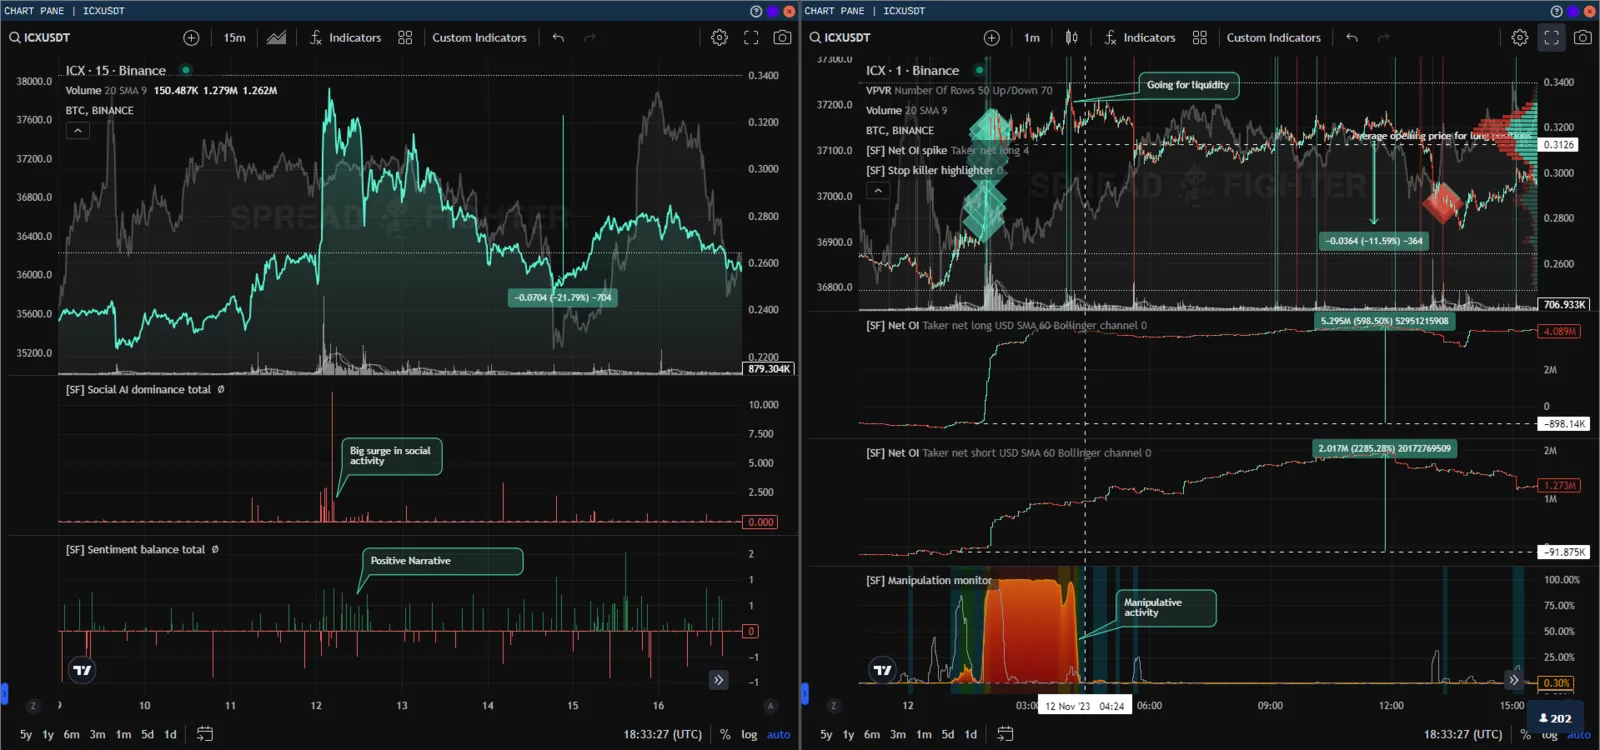
Icon
So market taker participants were left with a total unrealized loss of ~$1M. Market maker participants became their counterparties and got an equivalent unrealized profit.