Accumulation & distribution
The indicator detects the imbalance between buyers and sellers.
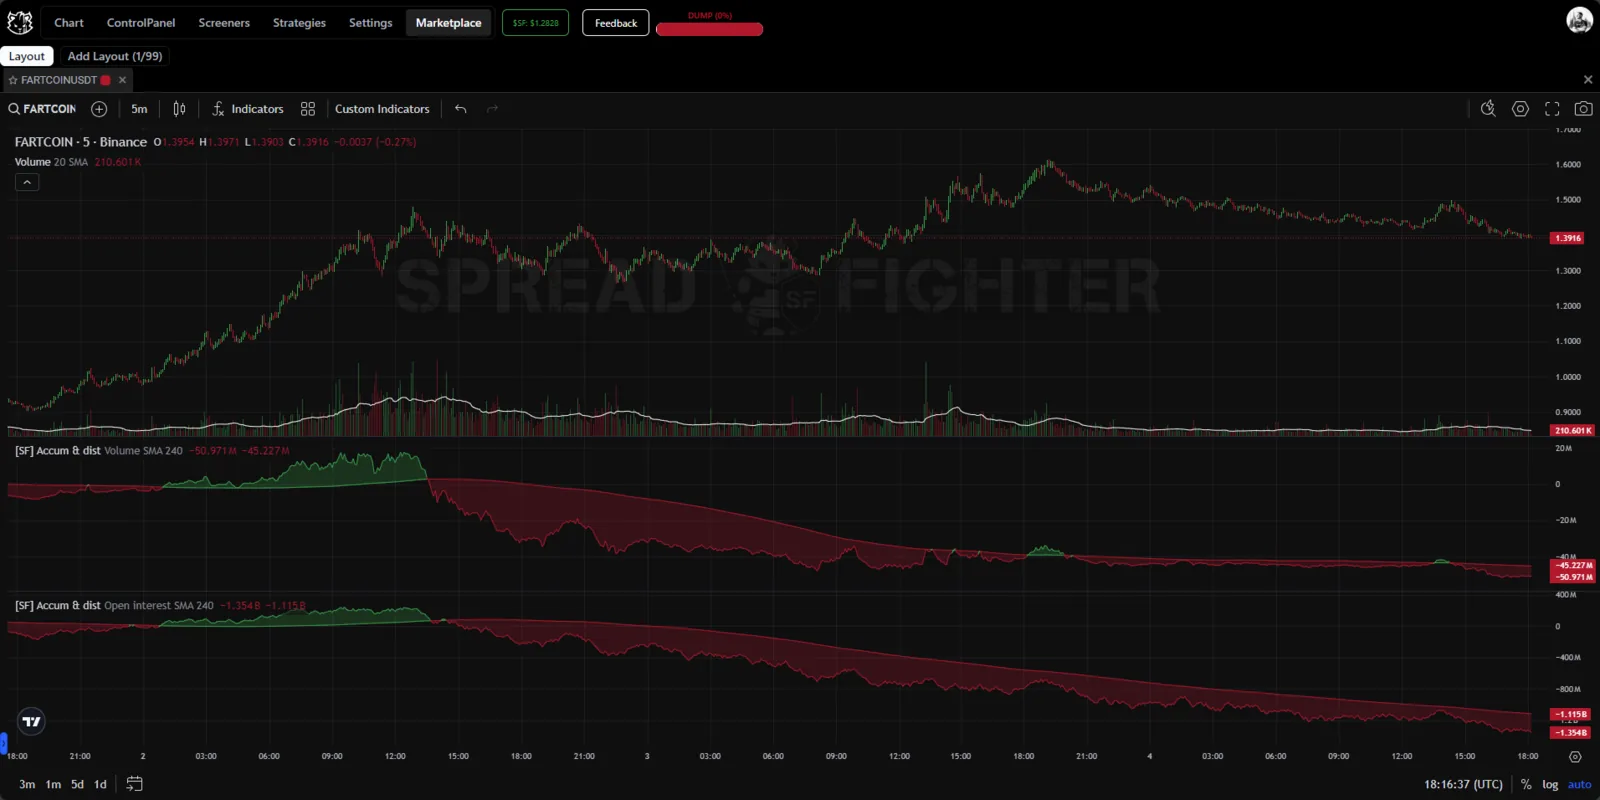
Indicator appearance.
Description
Accumulation & distribution is a classic technical analysis tool that shows which phase an asset is in: accumulation or distribution.
The SpreadFighter version differs in that the user can choose the data source for calculating the indicator.
For easier reading, a moving average of the indicator values is added.
Use cases
The Accumulation/Distribution (A/D) indicator is a variation of the On-Balance Volume (OBV) indicator. It shows the overall sentiment of large participants trading a given asset over the selected time interval. It is believed that in the Accumulation phase, large players build up the asset before a strong uptrend begins, and in the Distribution phase they sell it off.
The A/D chart largely follows the price chart, but you can look on it for divergence patterns that point to a likely trend change soon, or for convergence patterns that confirm the start of a trend.
The main divergence pattern is the divergence itself. This is a situation where the price extremes of the asset update while the A/D extremes do not update or change direction.
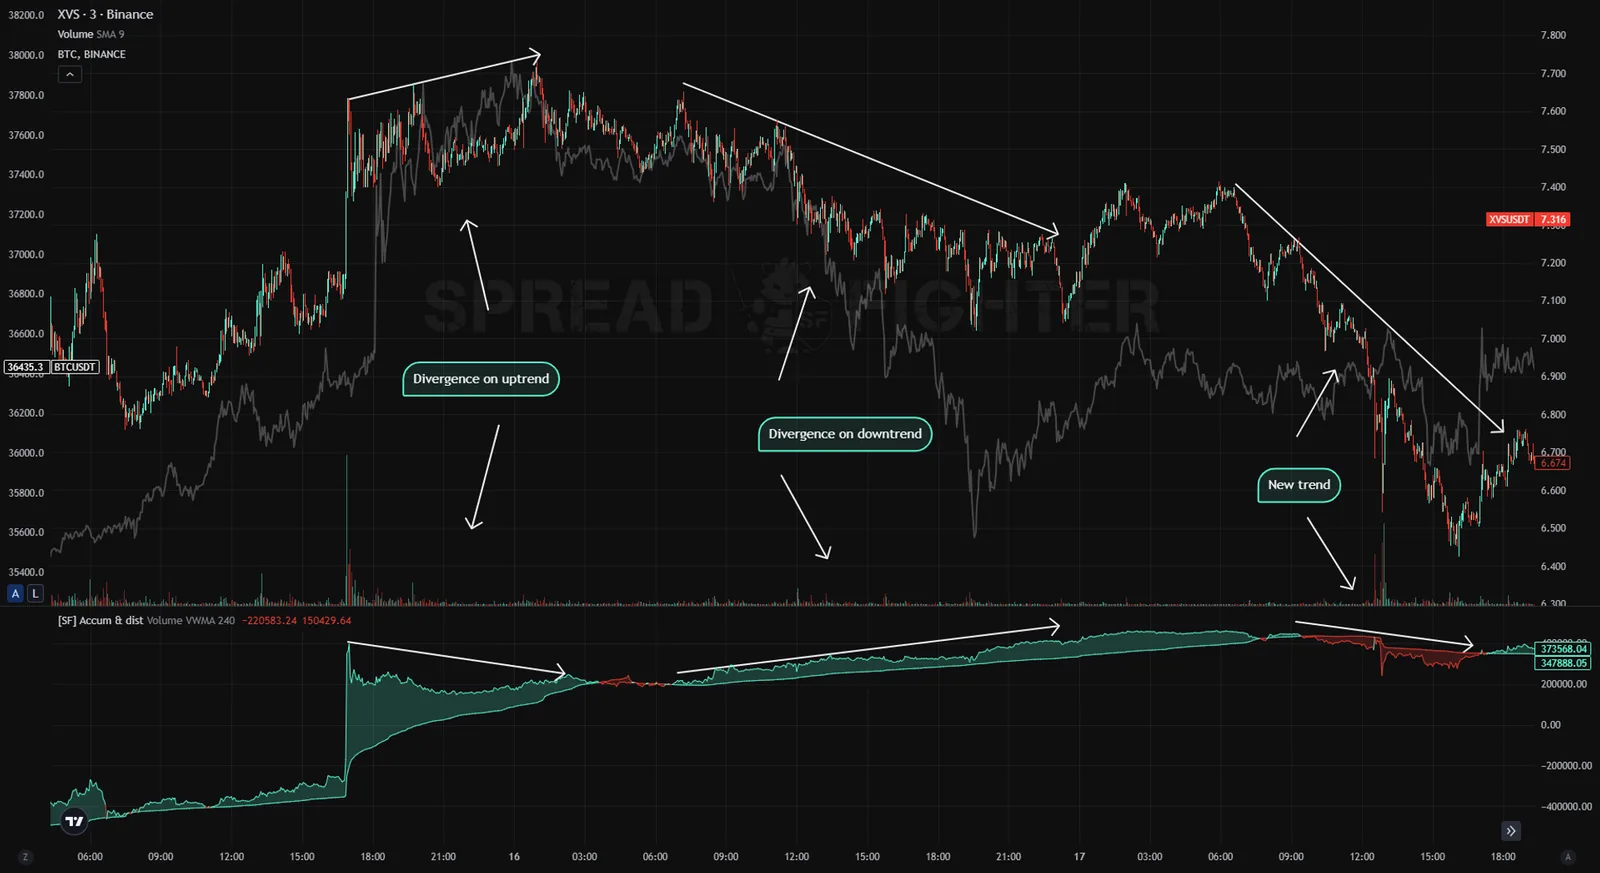
Divergence.
The "Convergence" pattern is a situation where the extremes of both the price and the A/D indicator update. This pattern confirms the development of the trend.
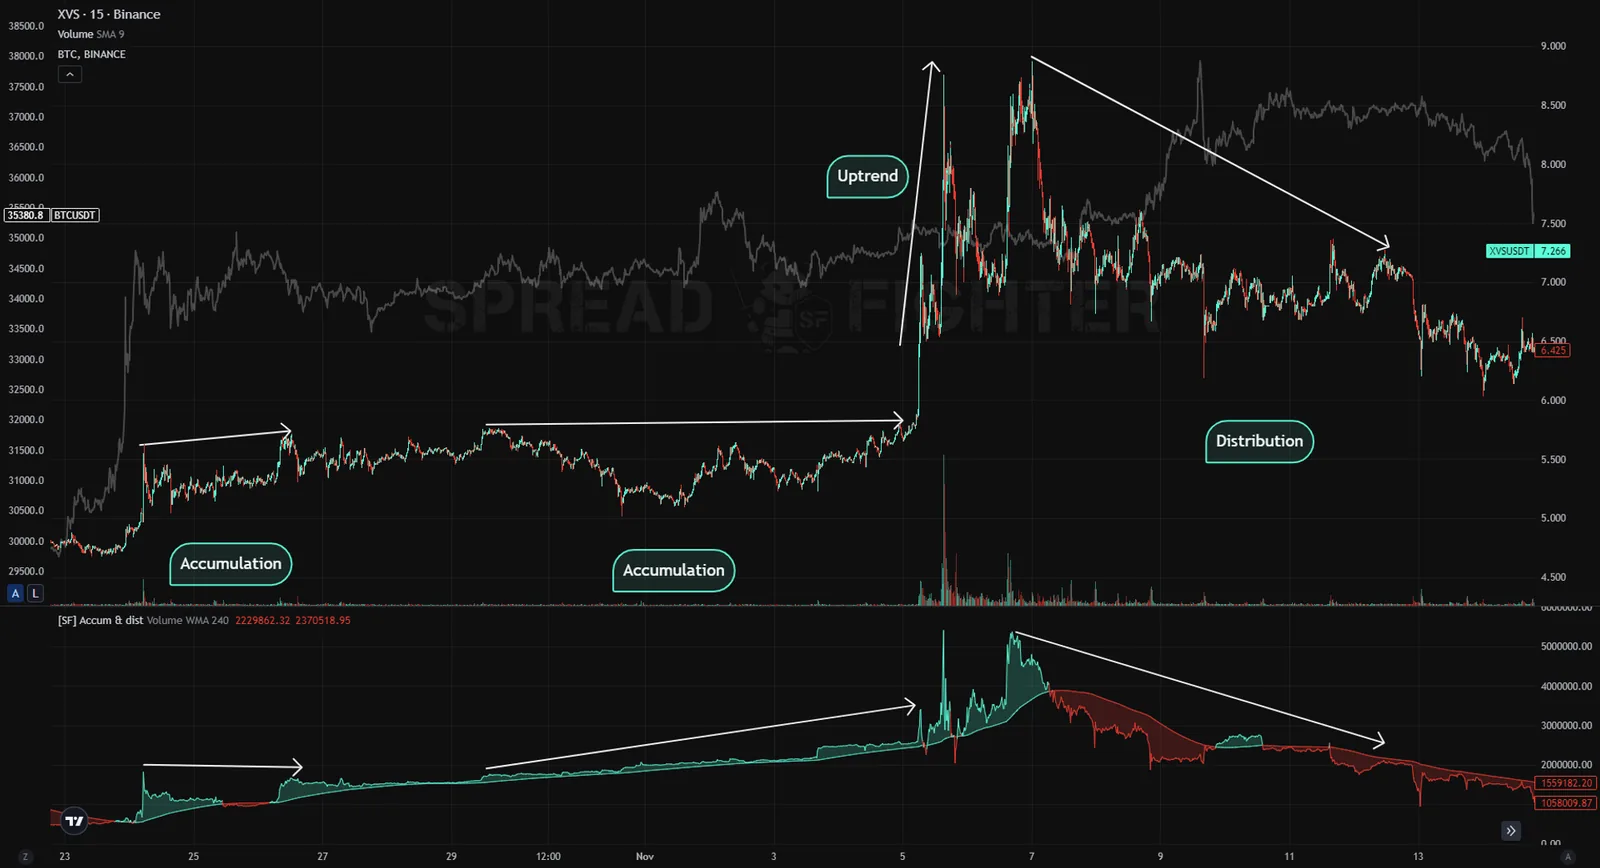
Trend development.
Level breakouts may appear on the A/D chart. When the asset price sits in a narrow balance or is squeezed toward the apex of a triangle while A/D updates its extremes, there is a high probability of a breakout from the balance structure, followed by a move of the price to a new level.
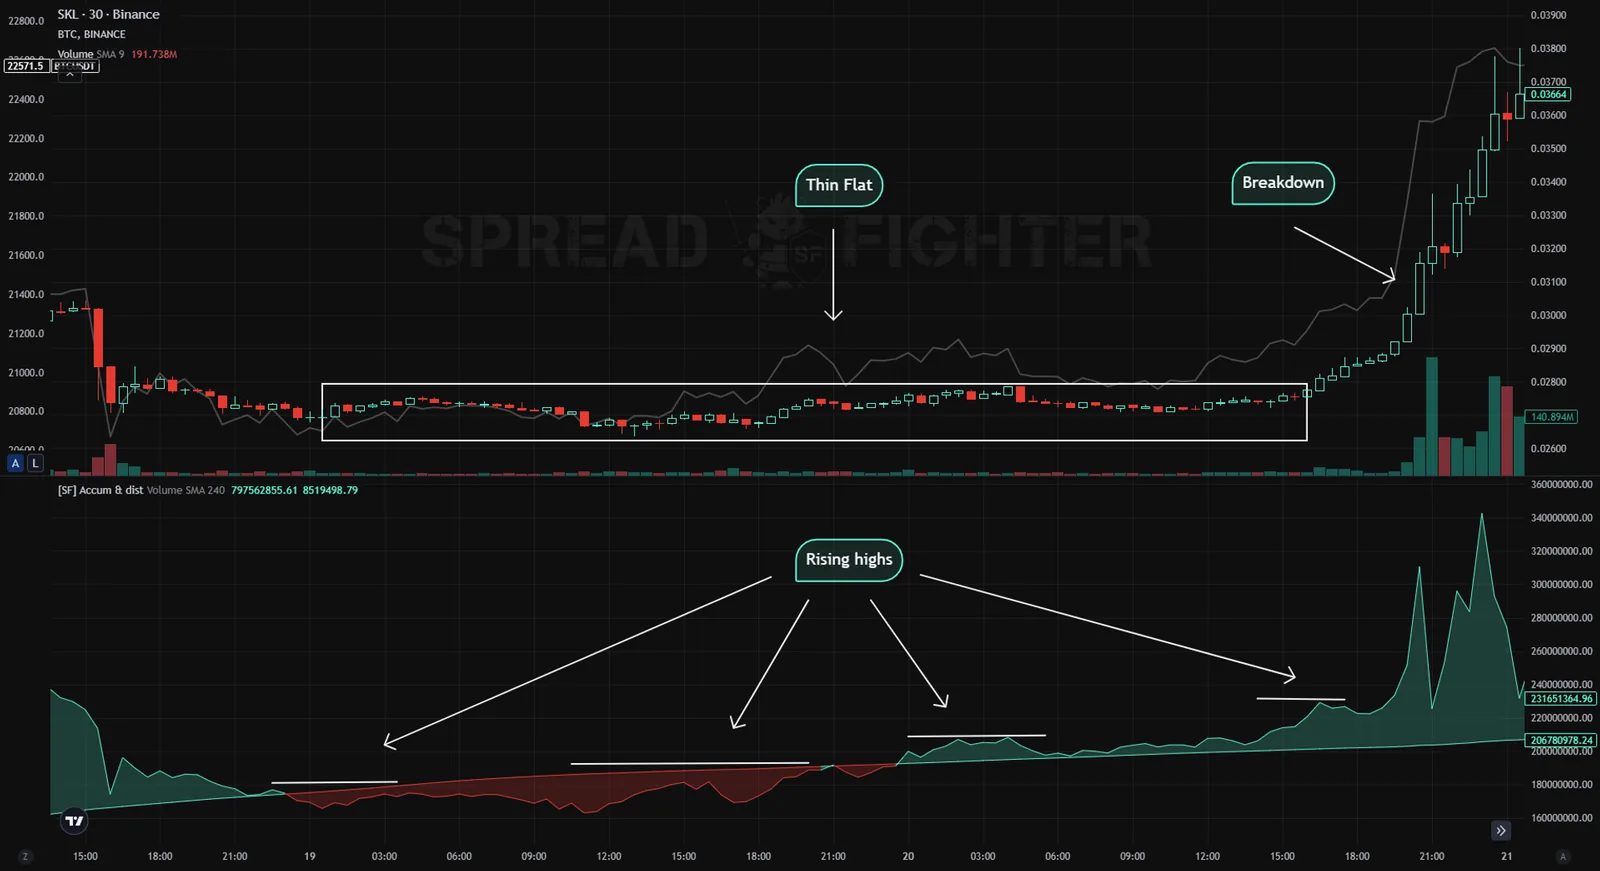
Breakout.
The A/D indicator has drawbacks, since it too often simply repeats the price chart. But in the SpreadFighter implementation, its display can be changed by using different data sources: Volume, CVD, OI. You can also change the type of moving average that is calculated. For example, an exponential moving average (EMA) calculated on volume (Volume) is more effective on small timeframes. A volume-weighted moving average (VWMA) is more effective on higher timeframes.
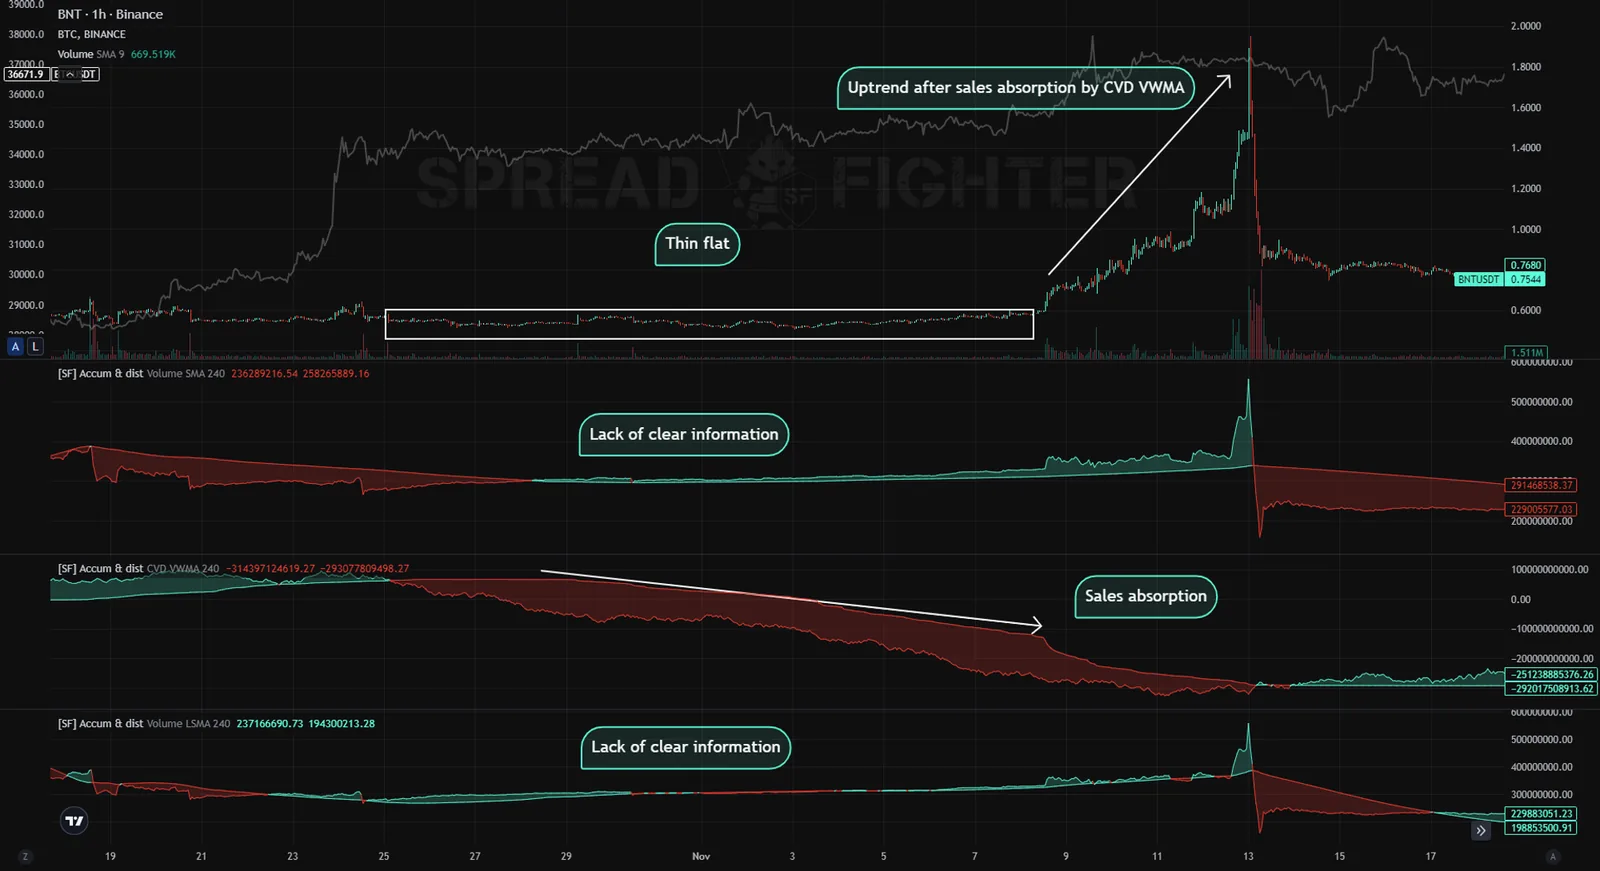
The advantage of the variety of A/D indicator displays in SpreadFighter.
So, by combining different display types of the A/D indicator, you can detect patterns that help you assess the current market situation correctly and join the actions of large players to make a profit.