Bollinger bands, RSI channel, Keltner channel
Advanced versions of the classic channel indicators.
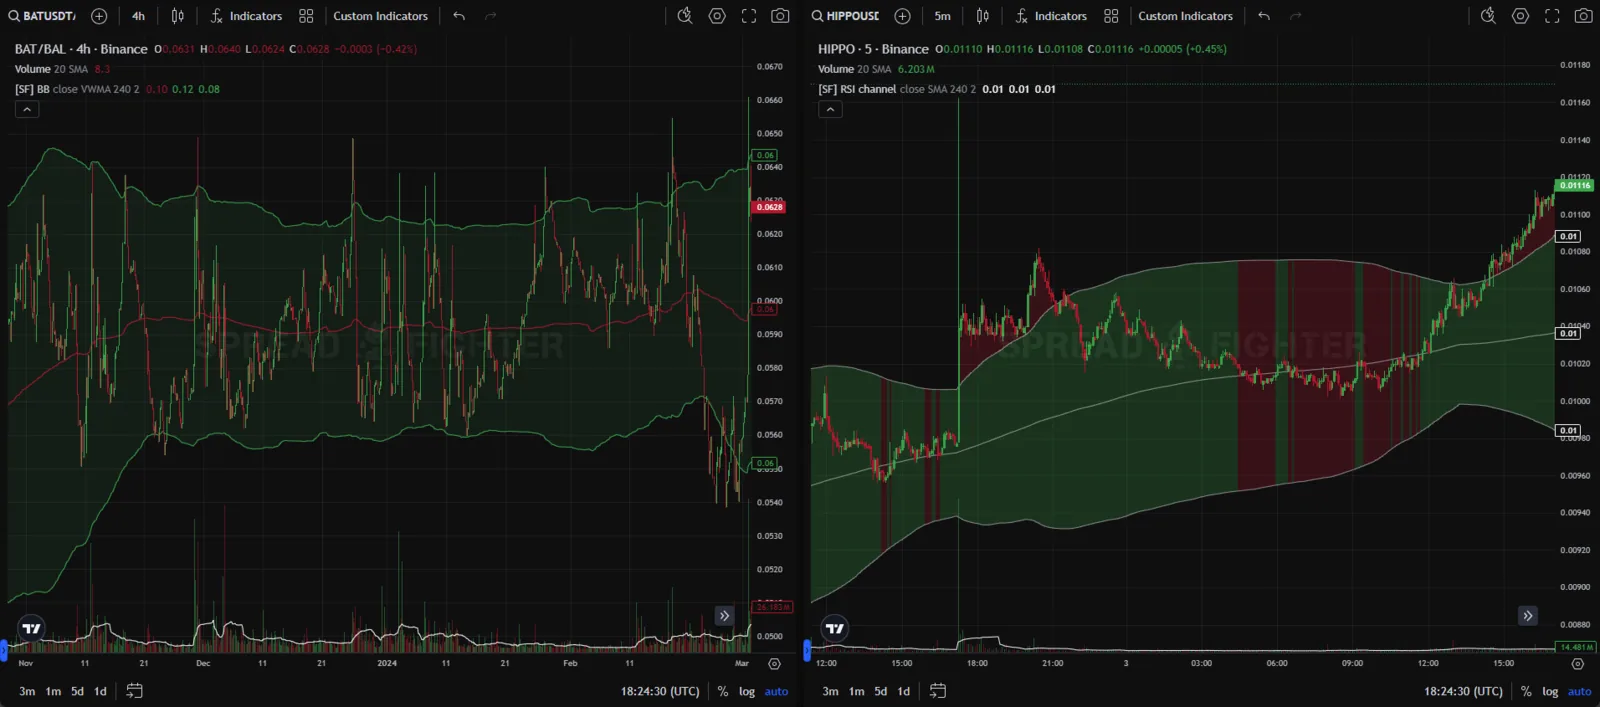
Indicator appearance.
Description
These are refined versions of classic technical analysis indicators. The user can now choose between different types of baselines, price sources and volatility calculation models.
Bollinger bands
Bollinger bands is a moving average with a channel built around it using standard deviations.
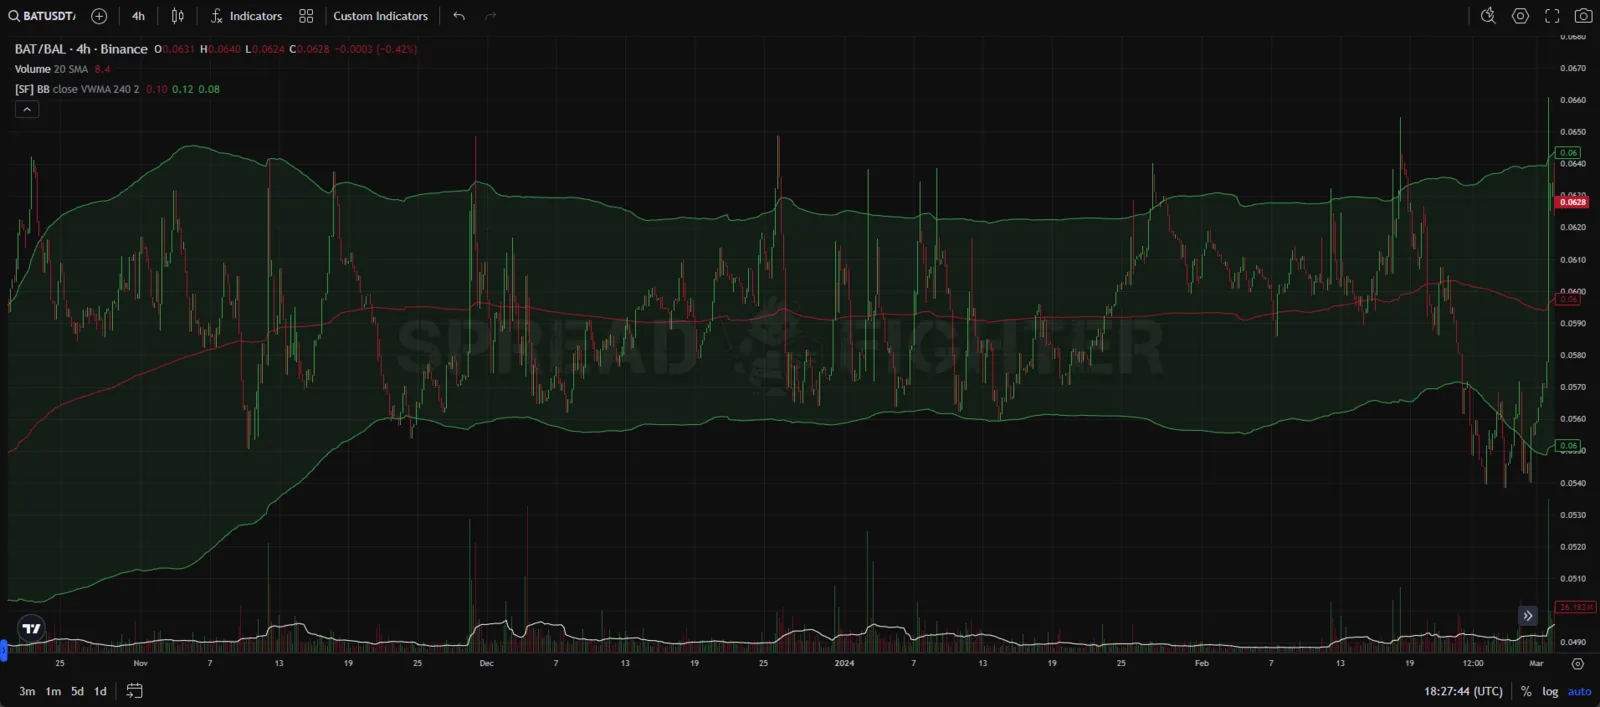
Bollinger bands.
RSI channel
RSI channel is a moving average with a channel built around it using standard deviations. The background color of the channel changes with the relative strength index of the asset price: red if the index is below 50, green if it is above 50. If the price breaks above the upper boundary of the channel, the background turns red. If the price breaks below the lower boundary, it turns green.
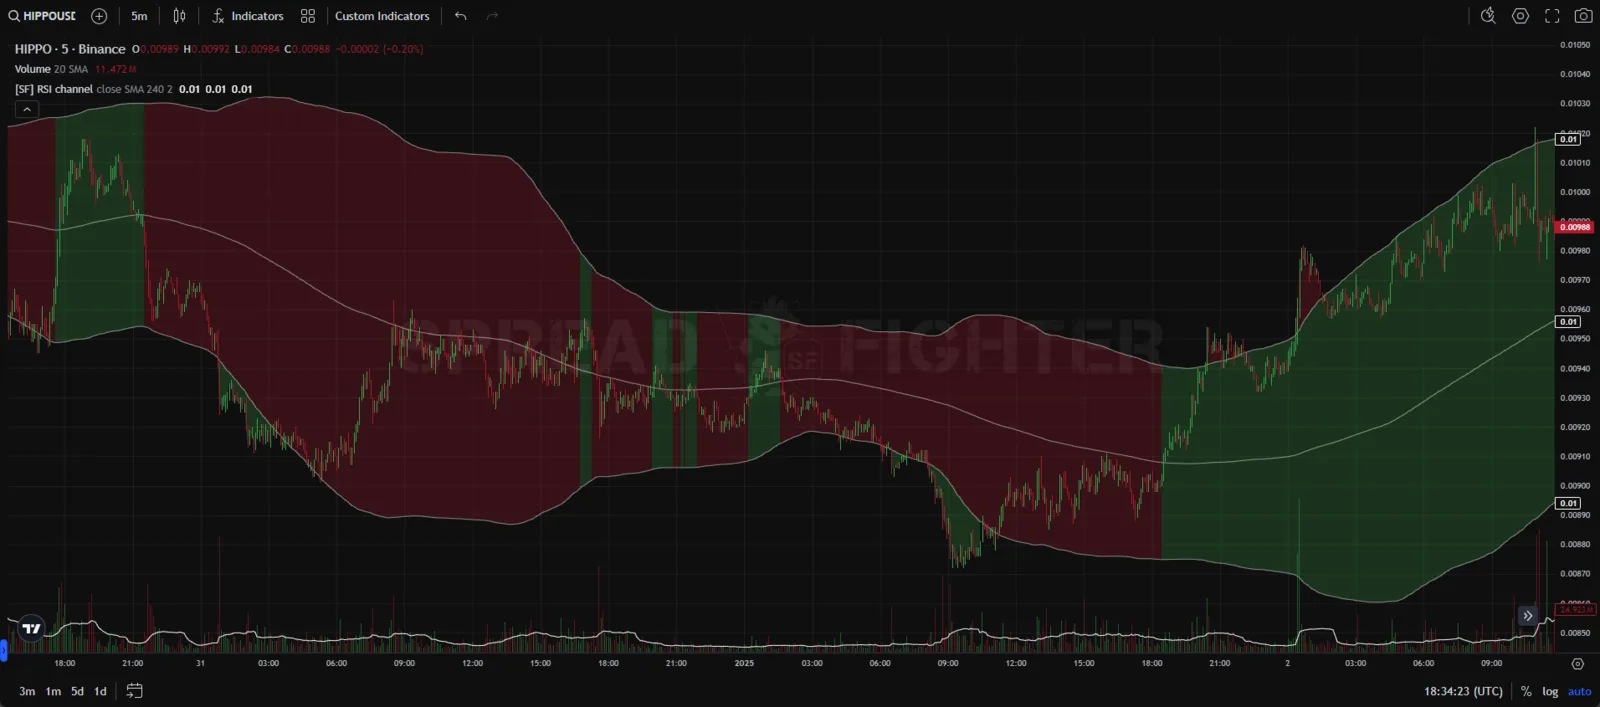
RSI channel.
Keltner channel
Keltner channel is a moving average with a channel built around it using the average true range.
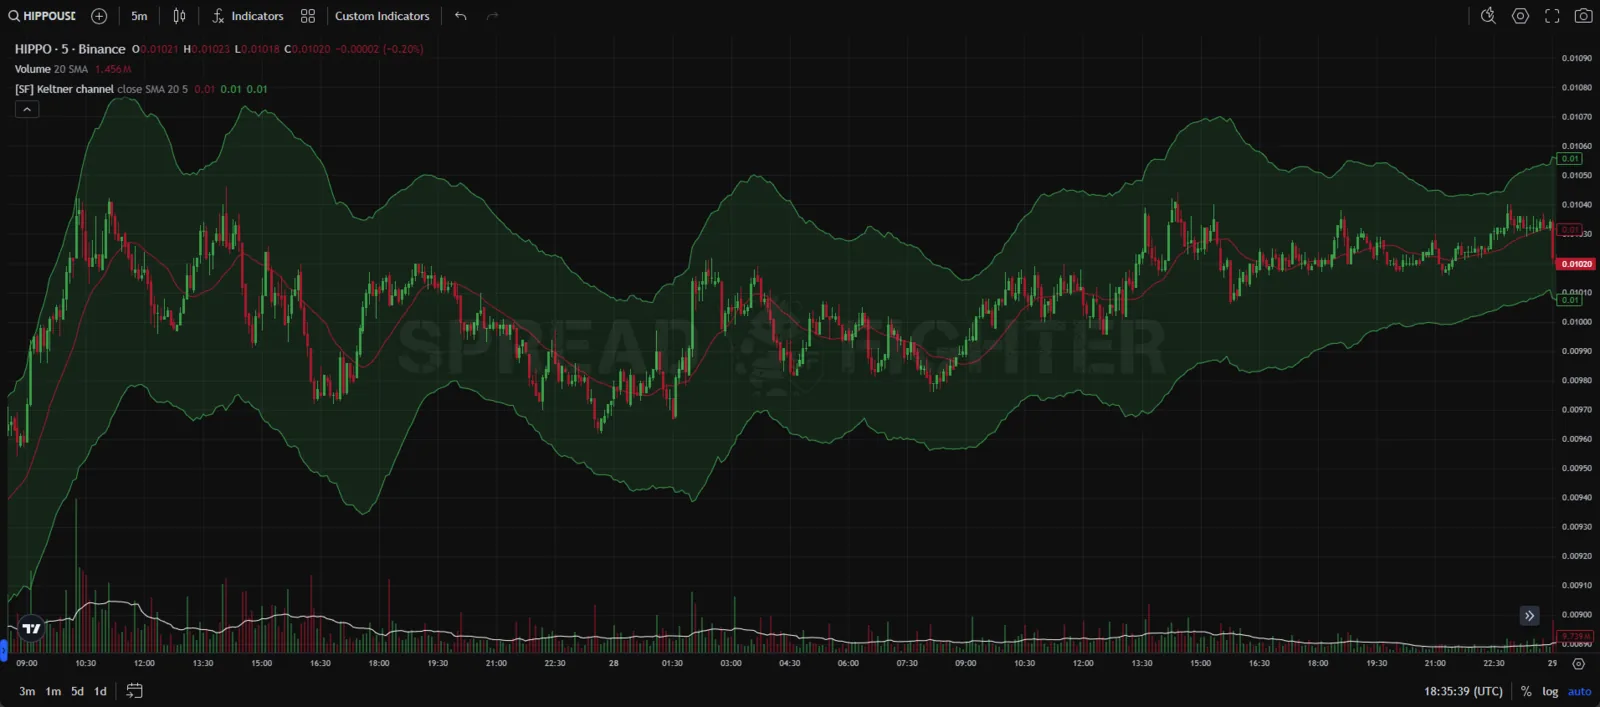
Keltner channel.
Use Cases
Bollinger bands
The idea of Bollinger Bands is to combine a trend indicator, a volatility indicator and an oscillator in one. The bands show on the chart the direction and range of price movement, taking into account the trend and the volatility typical of the current market phase. Graphically the indicator is three lines: a simple moving average in the middle, which shows the main direction of movement, and two lines bounding the price chart on both sides. These are the positive and negative standard deviation from the middle line, and they show the volatility of the traded asset.
The indicator is mainly used to determine the degree of volatility. When the bands widen, volatility increases. When they contract, volatility falls.
Quotes are expected to move inside the range between the upper and lower Bollinger Bands and only rarely leave it. The middle line sets the direction. Everything also revolves around it and periodically returns to it. The upper and lower lines form a kind of channel for price movement.
The most common patterns for using the indicator in trading:
- Buying/selling the asset against the trend (Swing trades). With Bollinger Bands you can trade counter-trend moves inside a trend: from one boundary of the channel to the other, from the middle line to the resistance line, or from the support line to the middle line of the channel. When looking for entry and exit points, assess the behavior of price candles near the corresponding channel lines and look for signs of a bounce (engulfing or rejection).
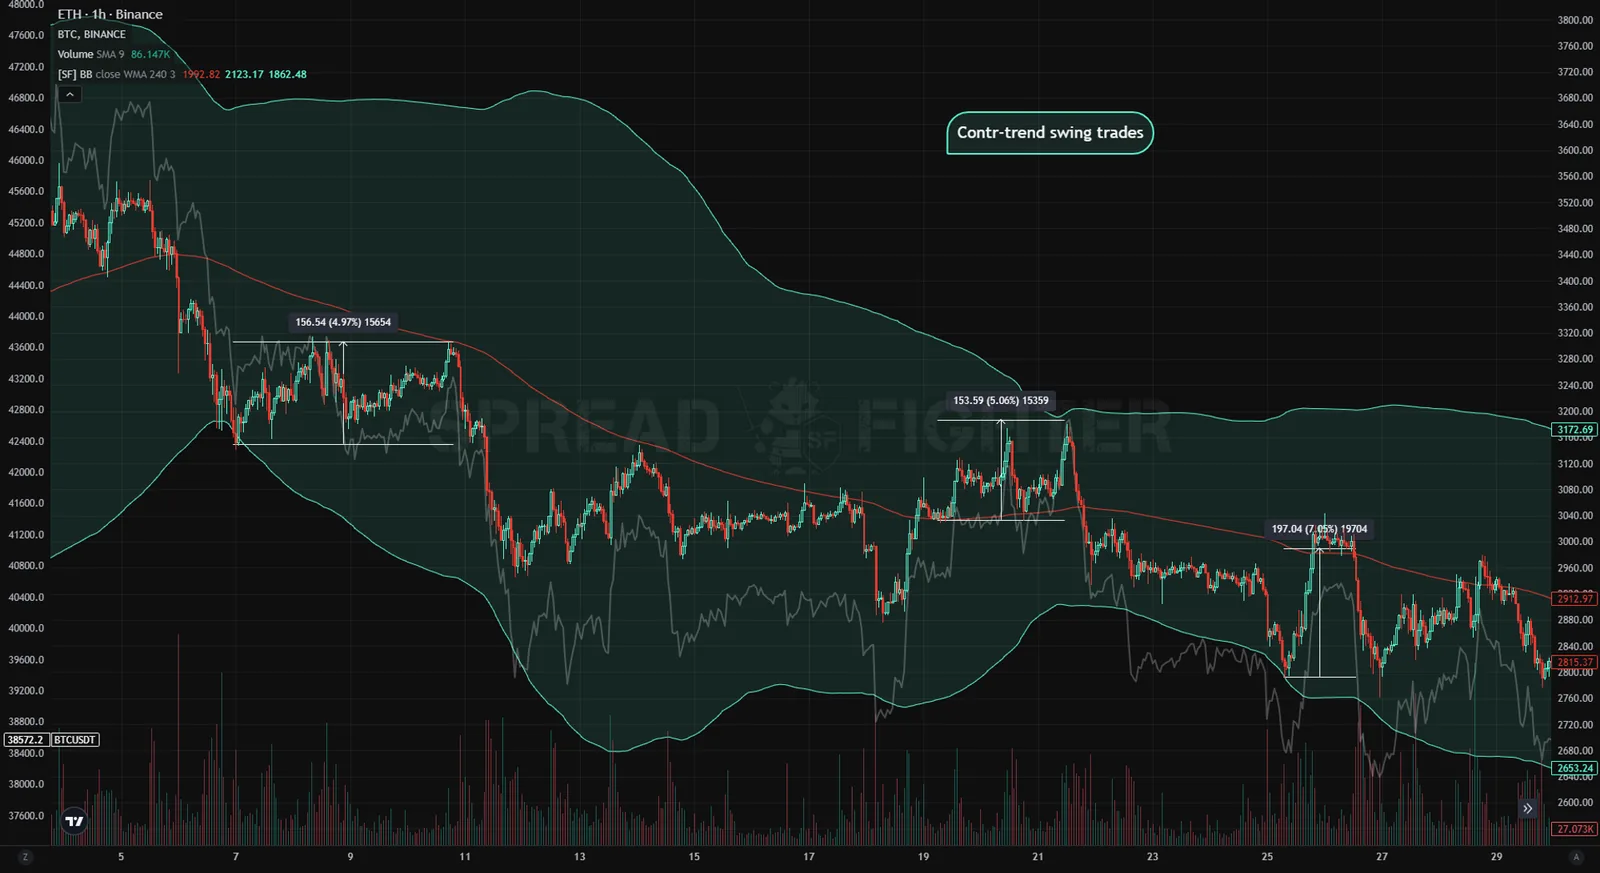
Counter-trend trades in a downtrend using Bollinger Bands.
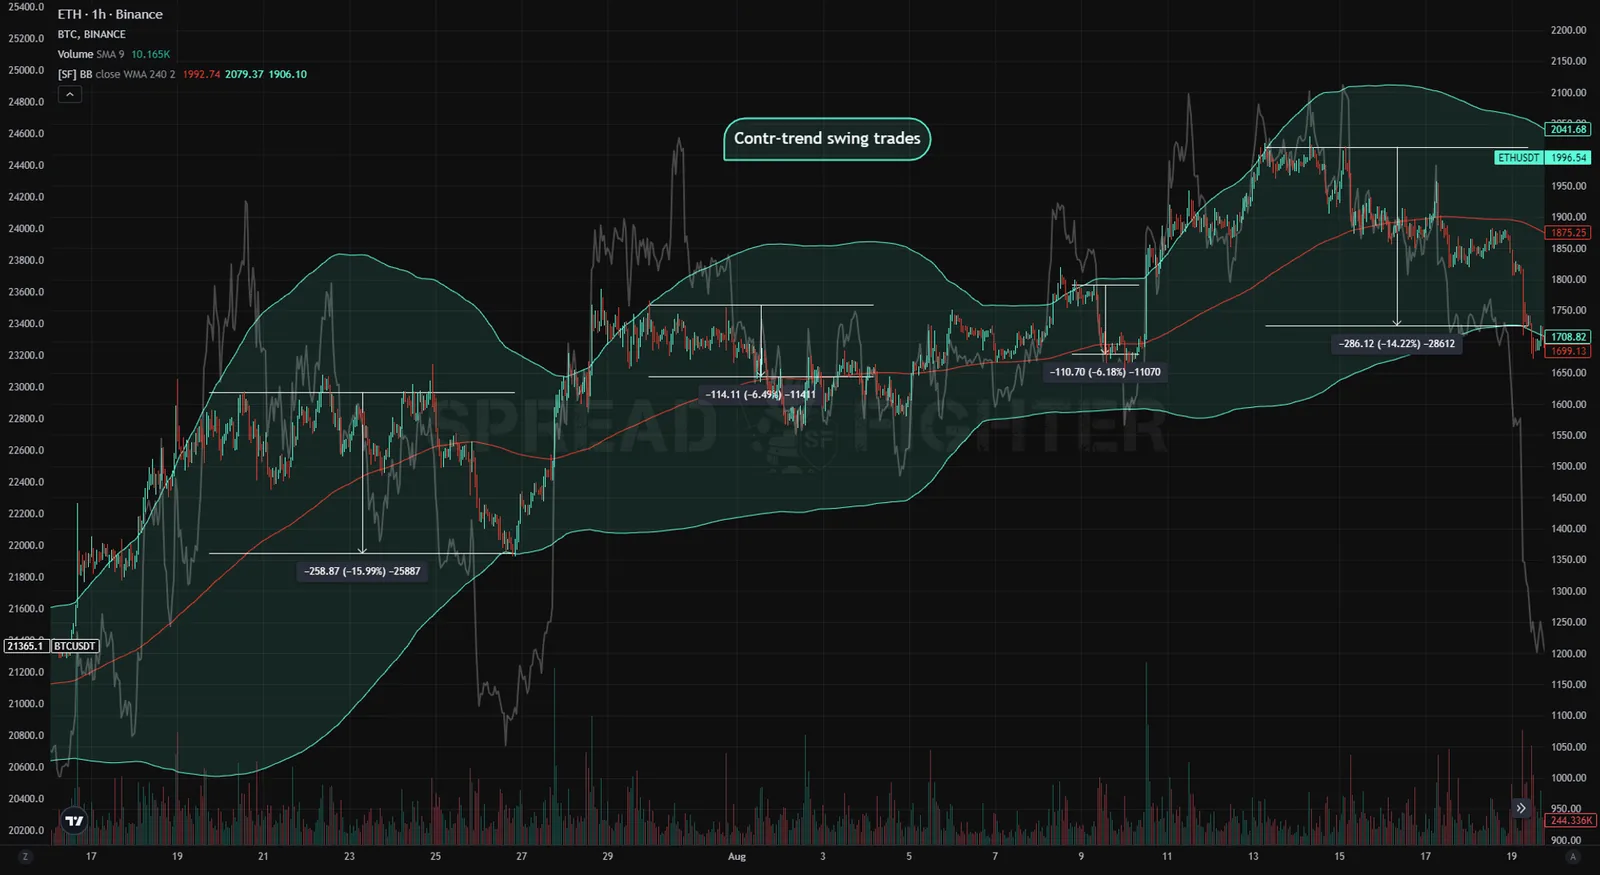
Counter-trend trades in an uptrend using Bollinger Bands.
- Buying/selling the asset with the trend after pullbacks (Riding the waves - Swing trades)
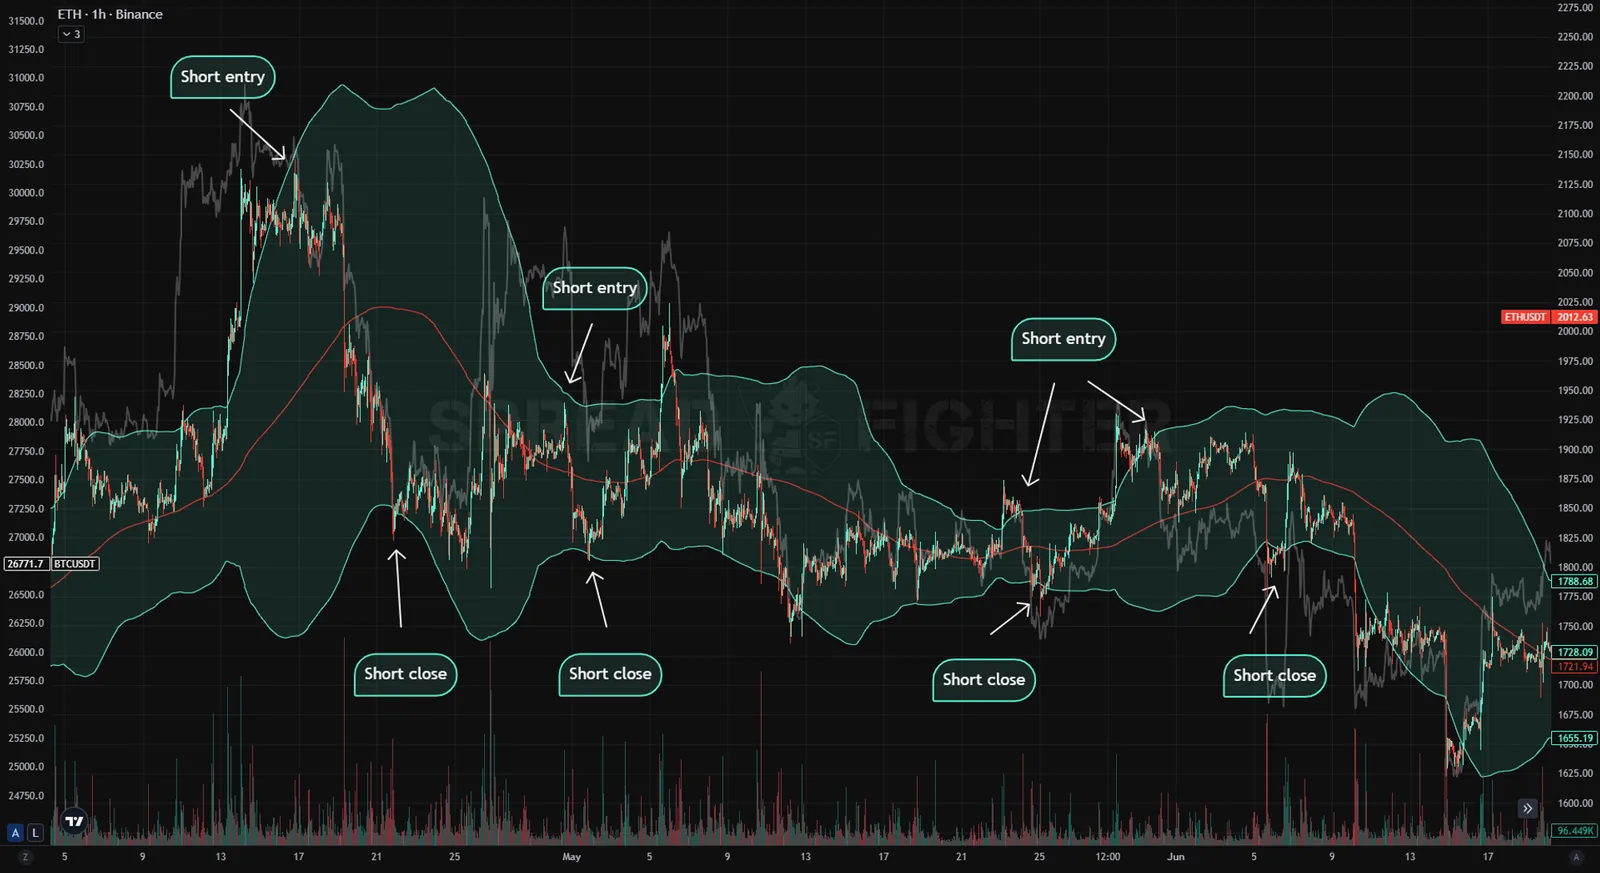
Entering and exiting a short position using Bollinger Bands in a downtrend.
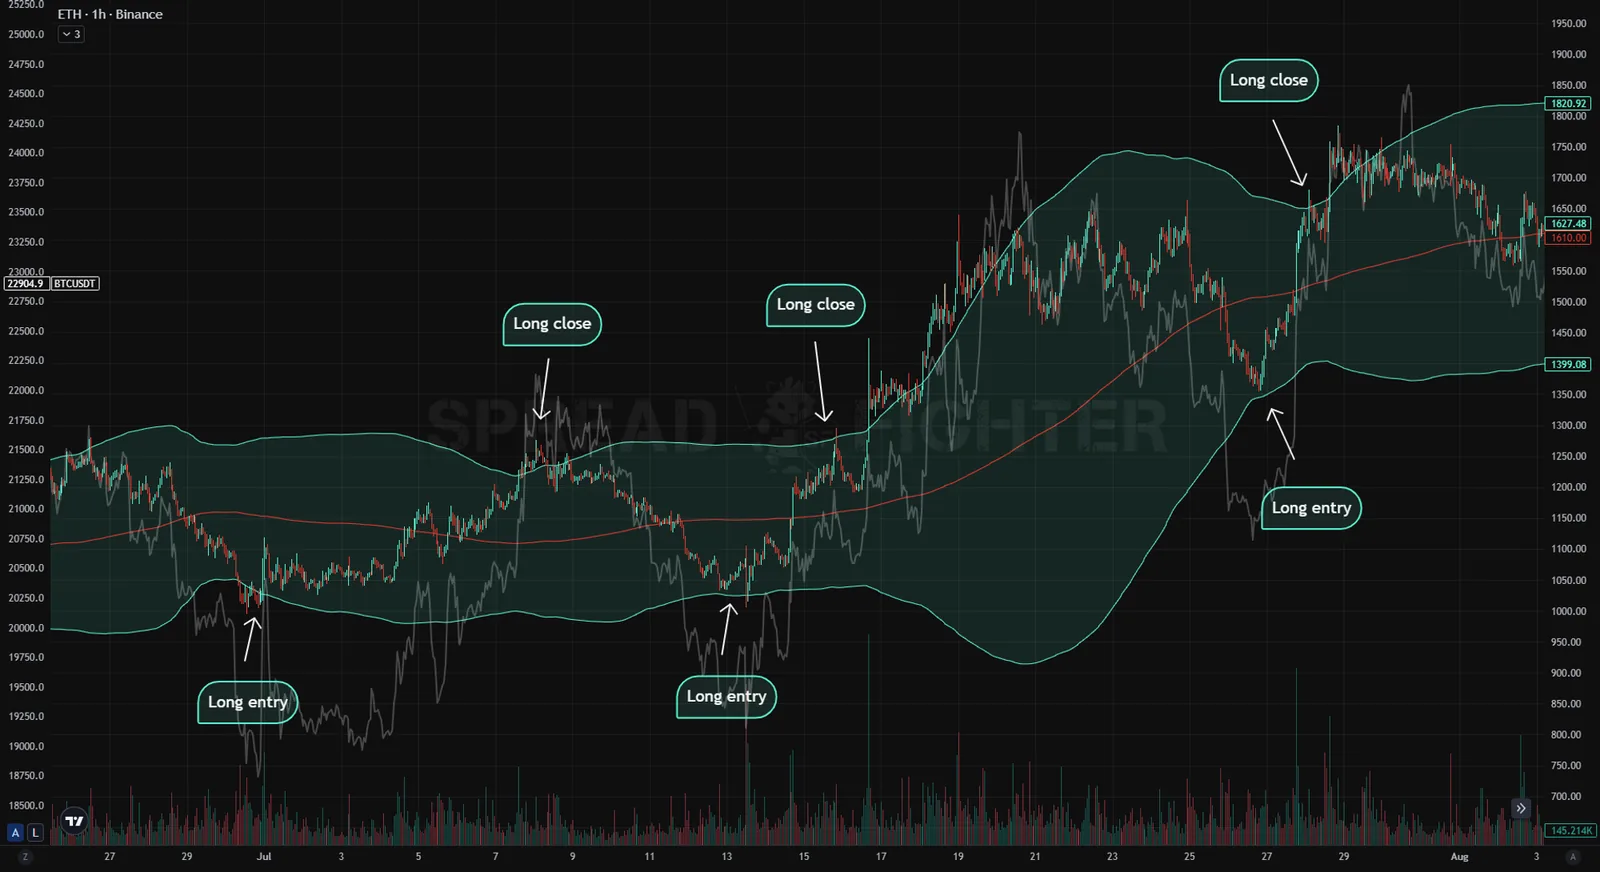
Entering and exiting a long position using Bollinger Bands in an uptrend.
- Waiting for a channel breakout after a significant contraction and the formation of a new trend. The trend formation must be confirmed by a later bounce from the middle line of the formed trend channel, or by a later trending move of price along the upper boundary of an ascending channel (along the lower boundary for a downtrend).
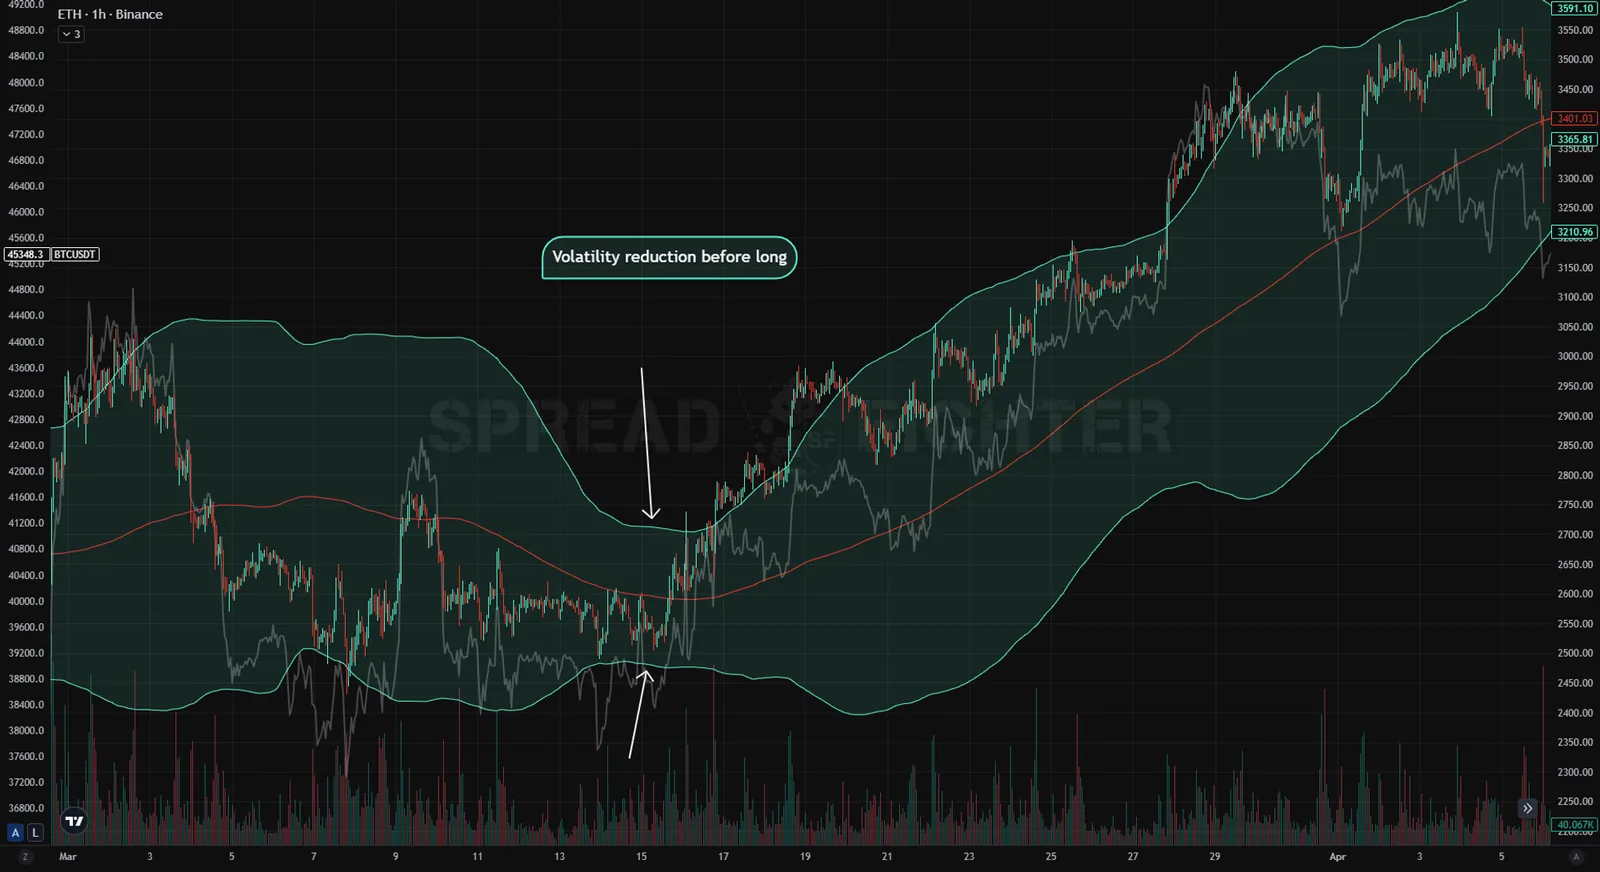
Volatility contraction before the start of an uptrend.
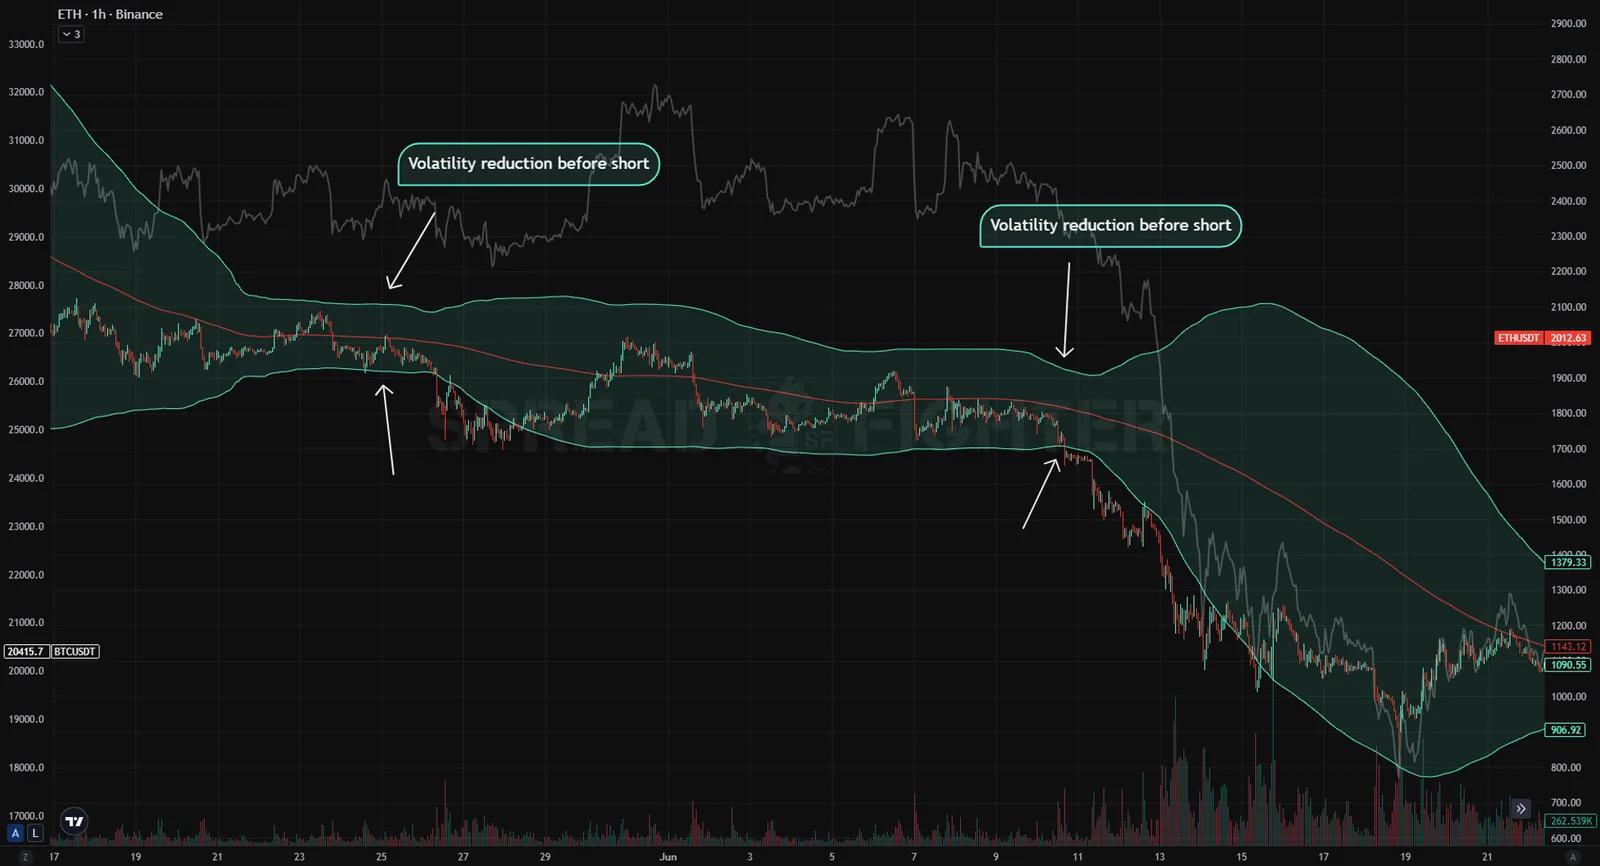
Volatility contraction before the start of a downtrend.
- Bollinger Bands are also commonly used to confirm the classic technical analysis patterns "Double bottom" and "Double top". If these patterns form near the boundaries of the channel made by the Bollinger Bands, the pattern is considered confirmed. The "Double bottom" pattern must form at the lower boundary of the channel, and the "Double top" pattern at the upper one.
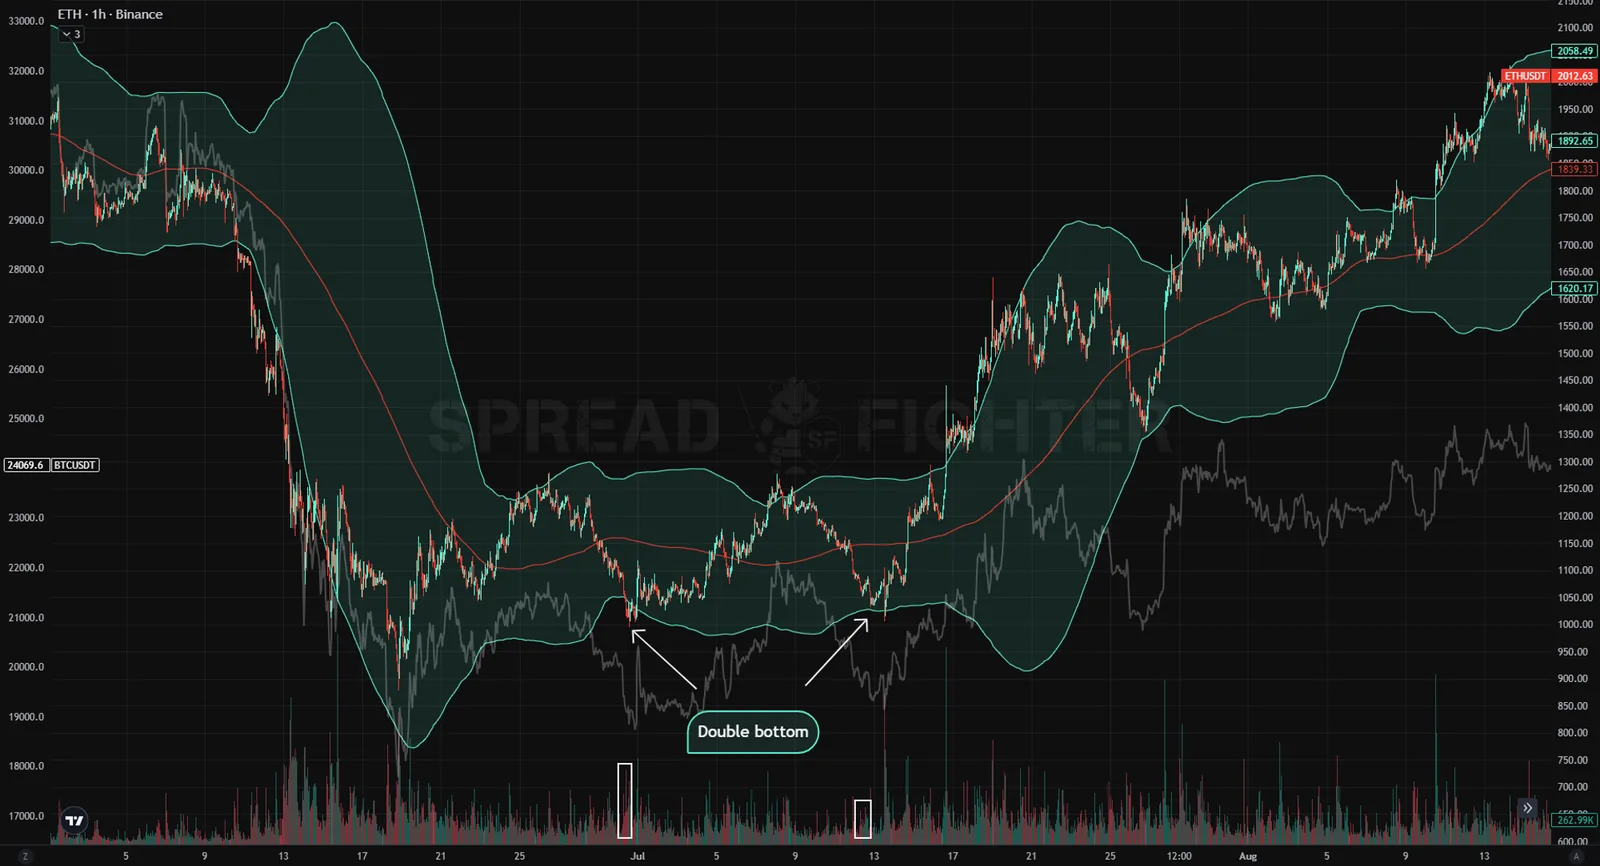
Formation of a "Double bottom" pattern with confirmation by Bollinger Bands.
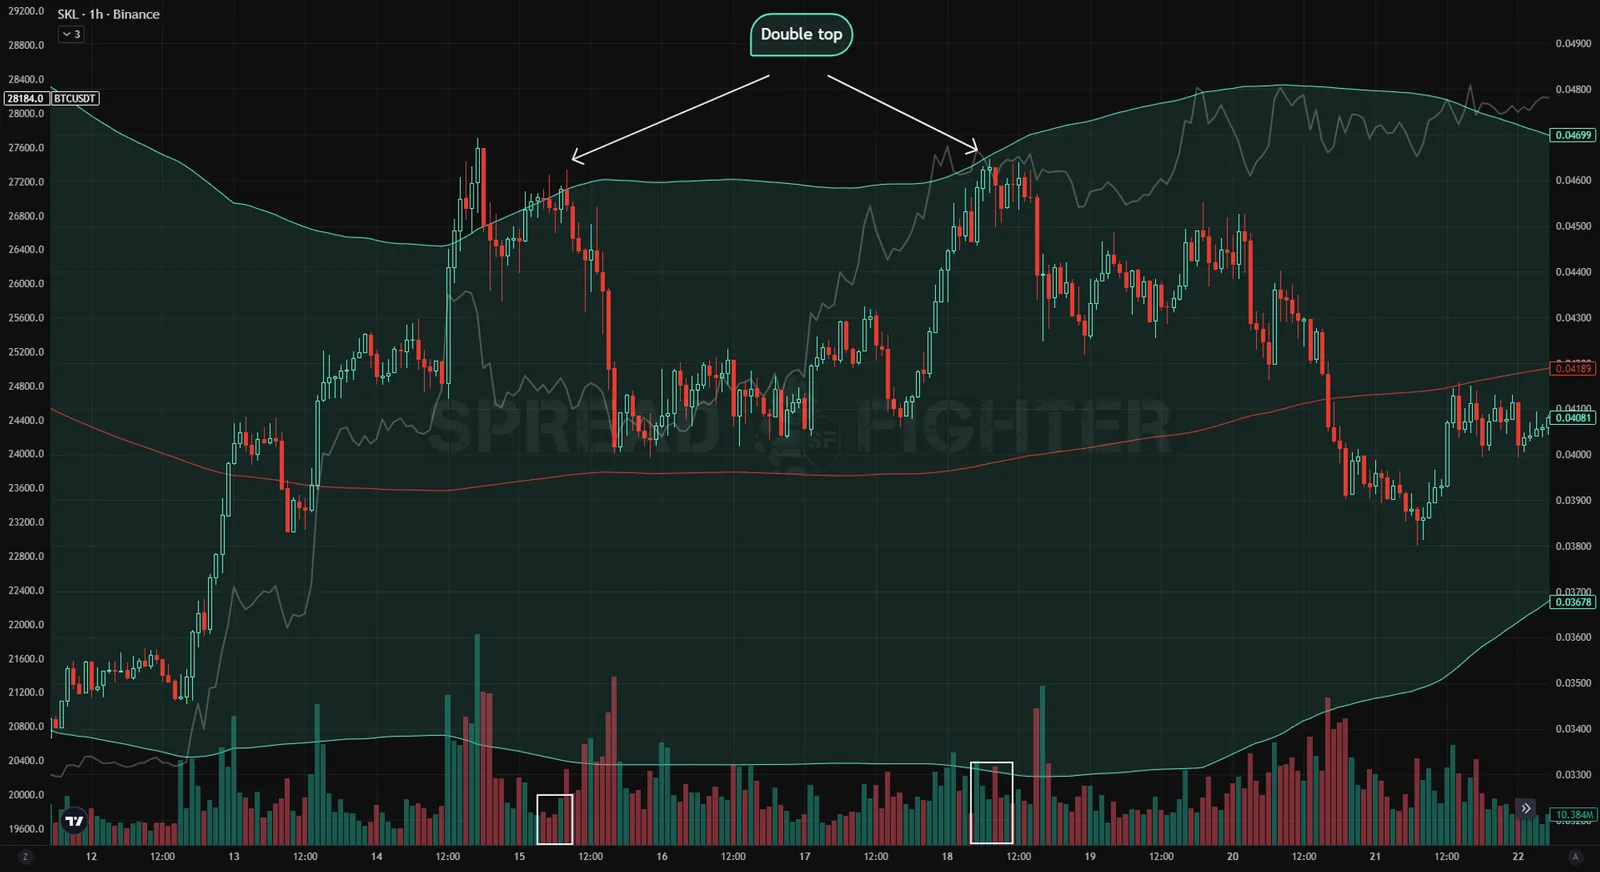
Formation of a "Double top" pattern with confirmation by Bollinger Bands.
Besides the common uses, there are many trading systems that combine Bollinger Bands with other indicators that do not correlate directly with BB: RSI, MACD, MFI, Parabolic SAR and so on.
Bollinger himself, in his book, suggested building the bands not for the price chart itself but for the RSI chart, and using the resulting signals.
RSI channel
RSI channel is another variation of indicators based on standard deviations from a moving average of the asset price, and it visualizes trend strength. This indicator can be used to look for the same technical analysis patterns as Bollinger Bands: swing trades in a trend, a price breakout after a volatility contraction, double top, double bottom and others.
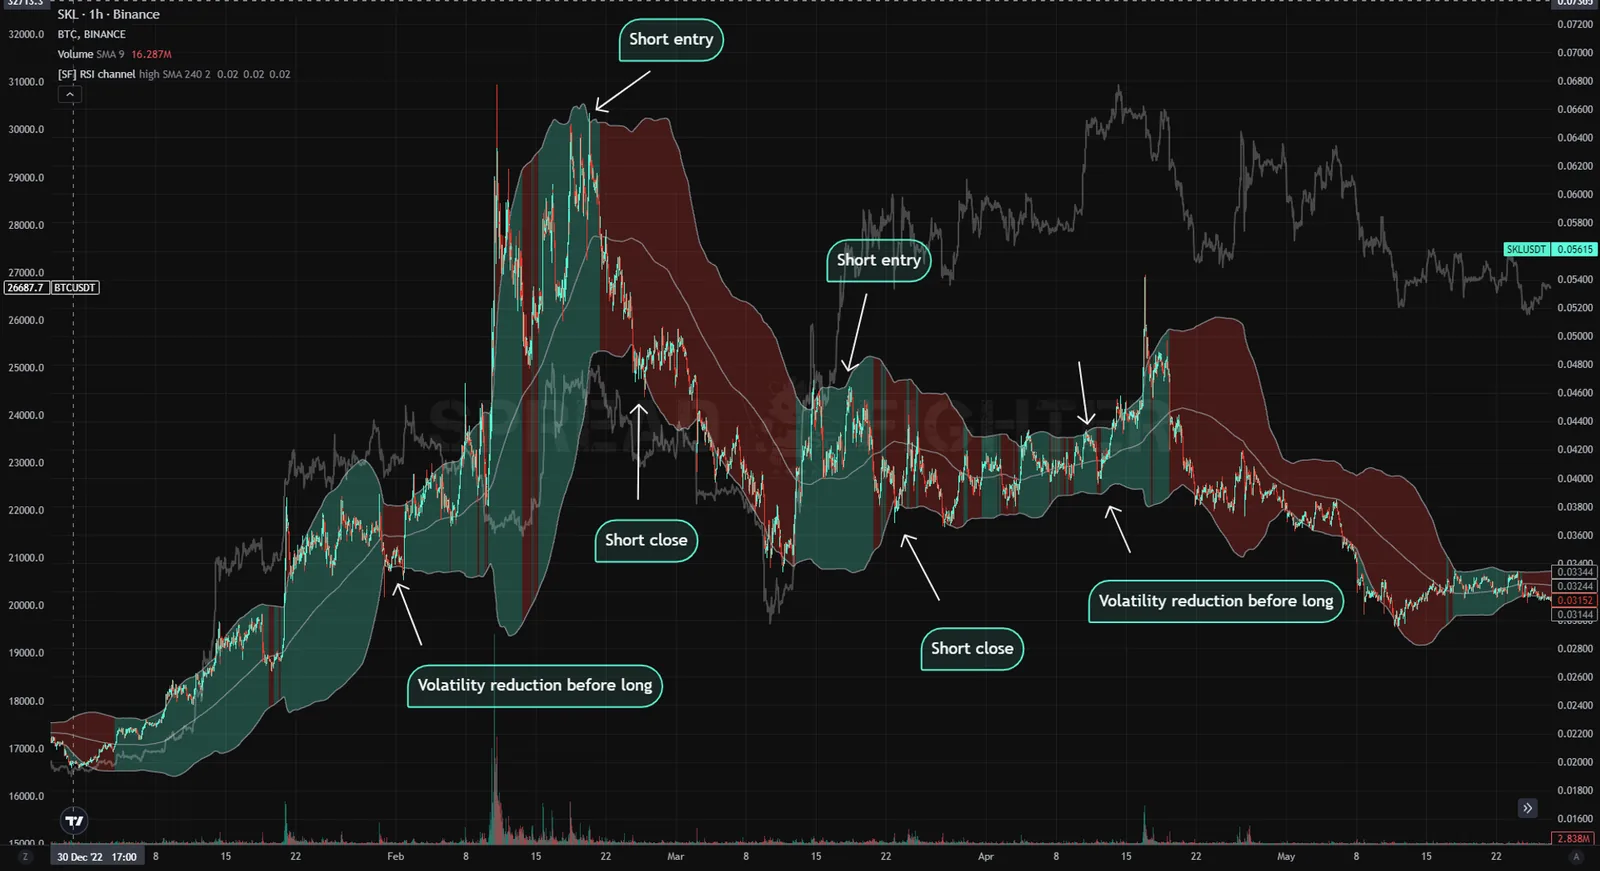
Swing trades in a trend.
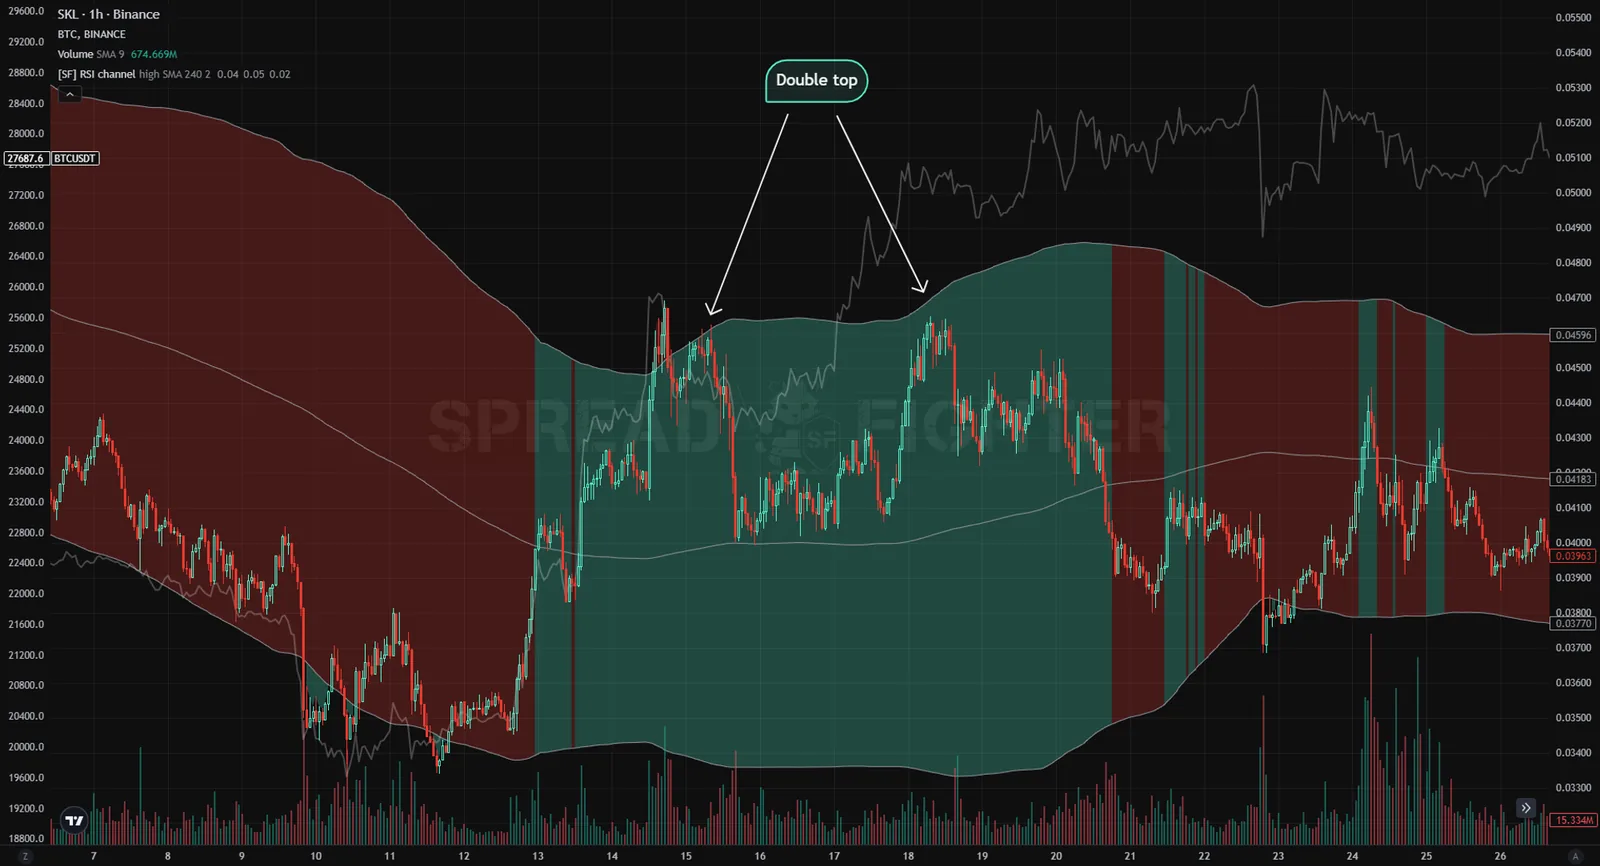
Double top.
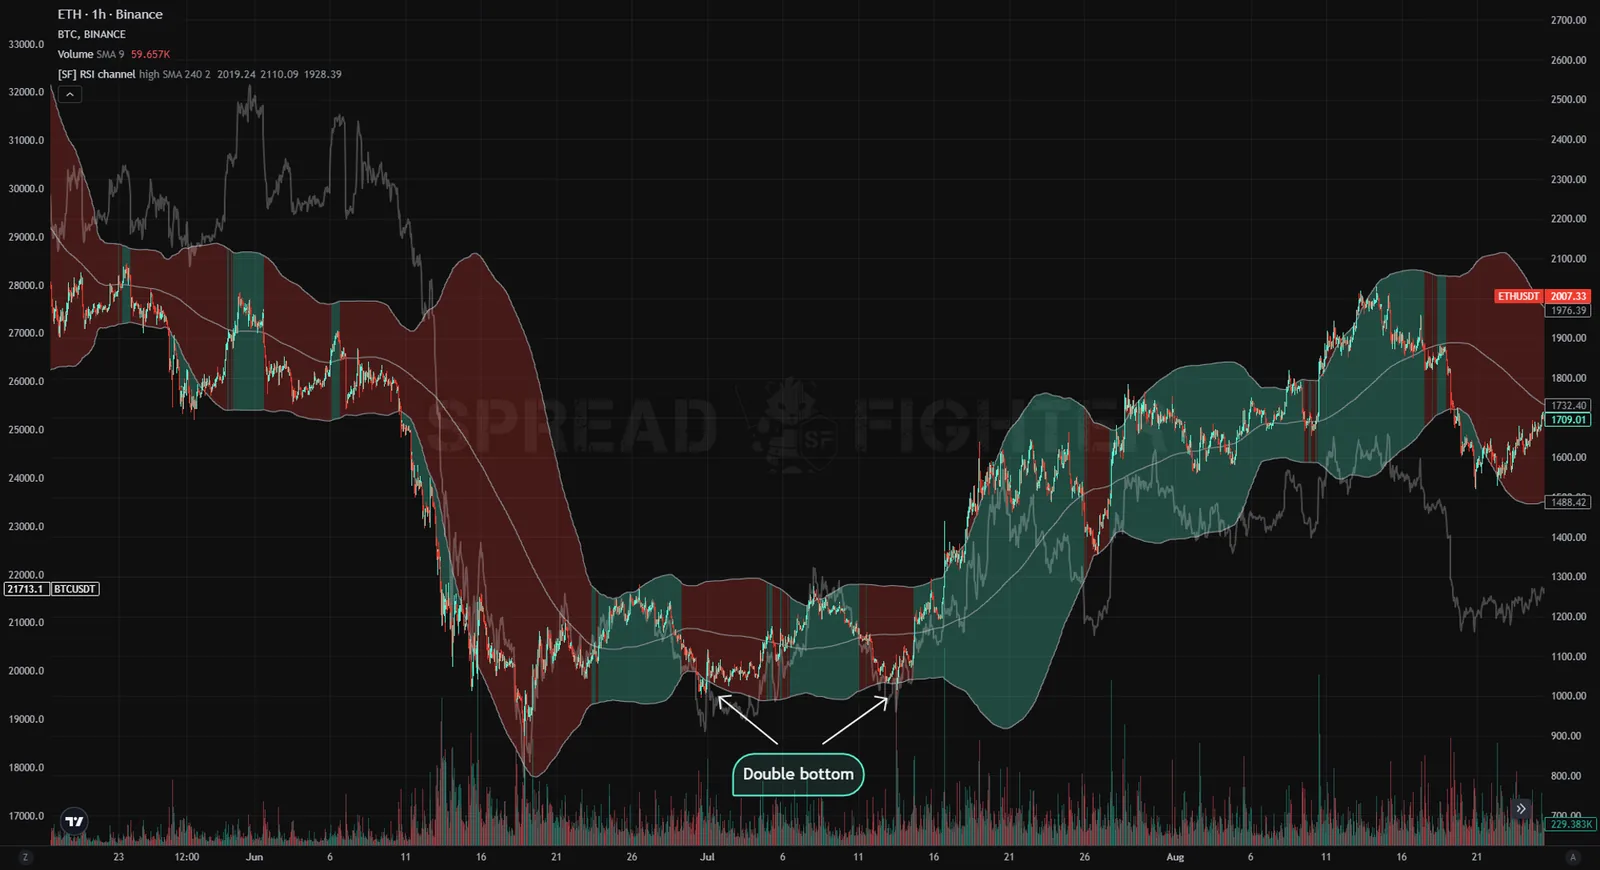
Double bottom.