Cascade levels
Clusters of technical levels in a narrow range
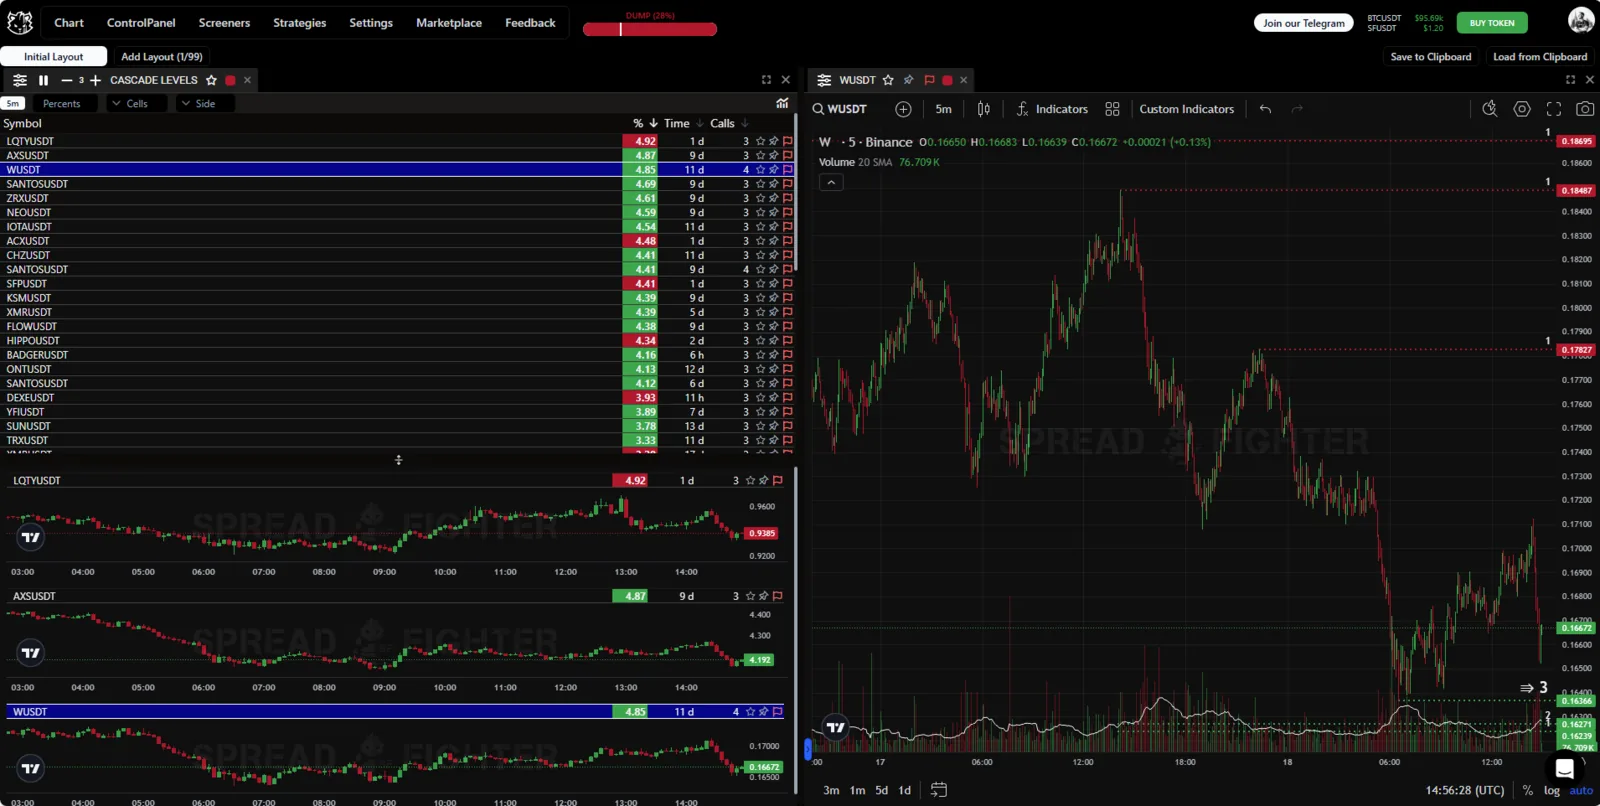
Widget appearance
Model description
Using a high-precision analytical algorithm, the model uses historical data and the current market situation to find the most significant and repeated levels where price reacted. After finding the levels, the model finds their clusters in a narrow range and notifies the user when price approaches them.
Widget location
To add the "Cascade levels" tool to the workspace, first click the "Widget menu" button in the platform header. Then click the button with the same name in the "Technical" section.
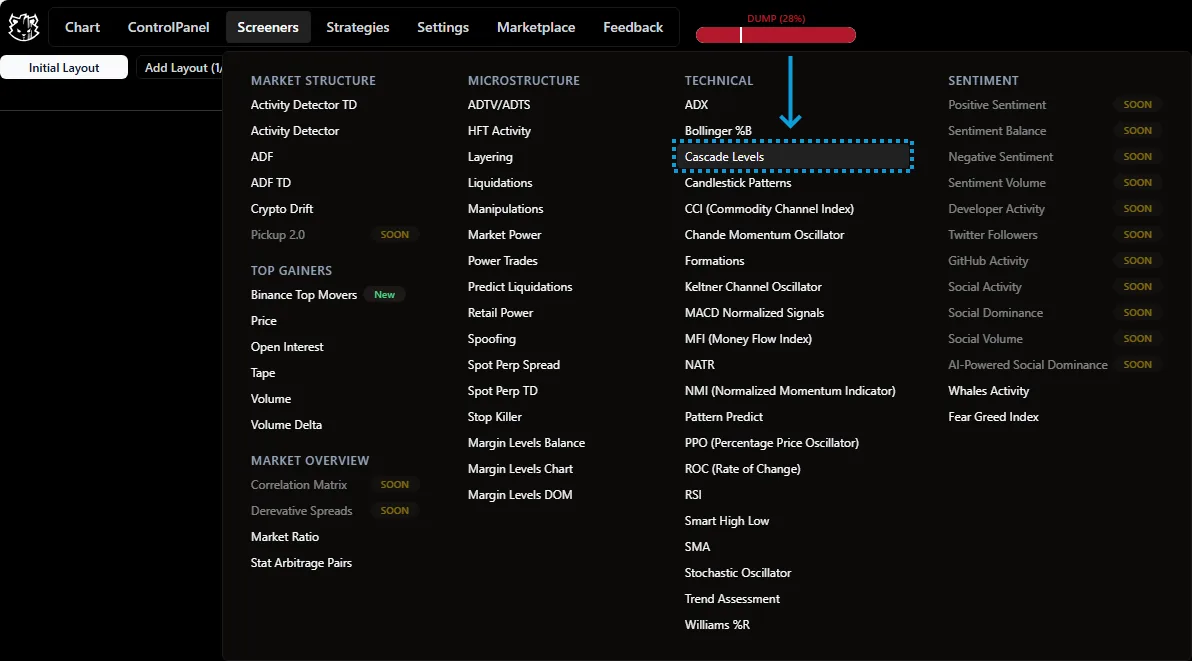
Widget location
Tool functionality
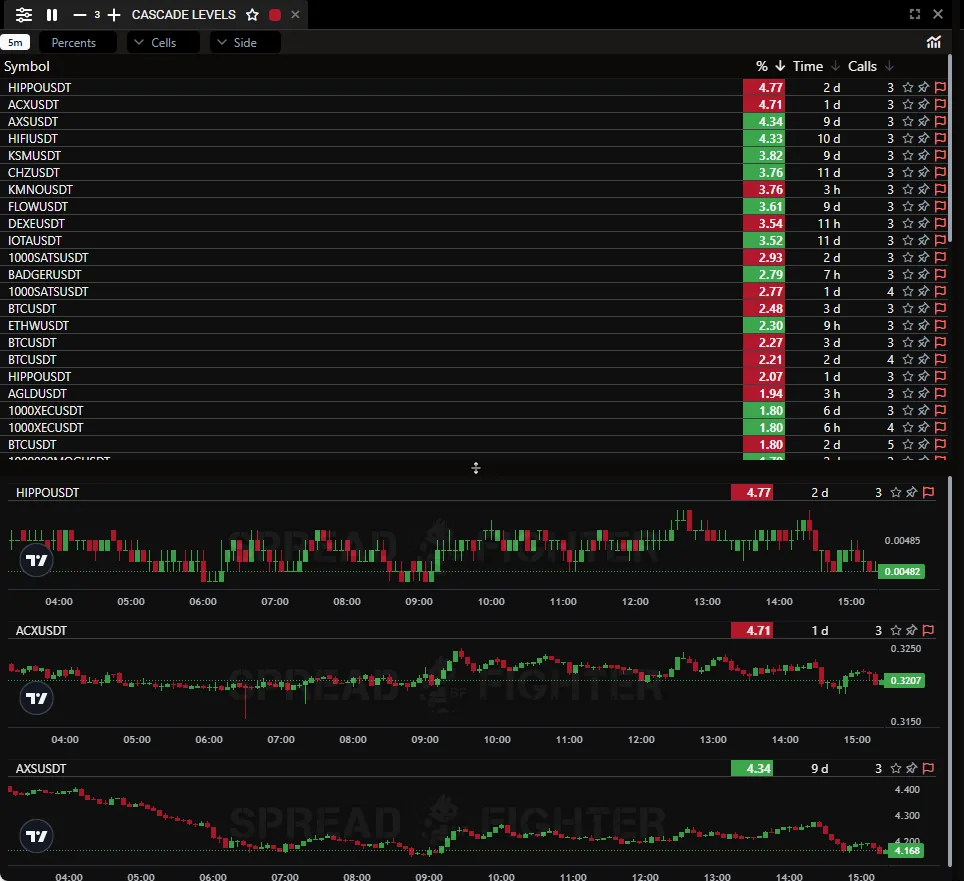
Cascade Levels is a model that finds and shows support and resistance levels for a specific asset in real time. The scanner notifies the user when an asset approaches a level. The data is shown as a table with several columns.
- TIME - time since the signal arrived.
- CALLS - the number of levels within 1% of the current price.
If the user has a chart widget open that is synced with Cascade levels, clicking the chart icon in the widget header draws the level on the chart. Along the right price scale of the chart, the number of times the asset's price has approached the drawn level is shown.
Marked levels shown on the chart.
How to use Cascade levels?
The widget lets users follow prices of various cryptocurrencies and find key support and resistance levels.
When the algorithm finds price support and resistance levels, it notifies the user instantly, so they can make timely, informed trading decisions.
With Cascade levels, the user can follow prices of many cryptocurrencies at once and get notifications about important changes. This keeps them aware of the market and helps them not to miss interesting trade setups.
An important advantage of the tool is that it can track clusters of levels. Reactions to such price zones come with higher volatility, because liquidity concentrates behind the cluster of levels.