Cycle spectrogram
The indicator shows which cycles are present in the price movement right now and which one is the strongest. It answers the question "after how many bars does the market usually turn", not "where will the price go".
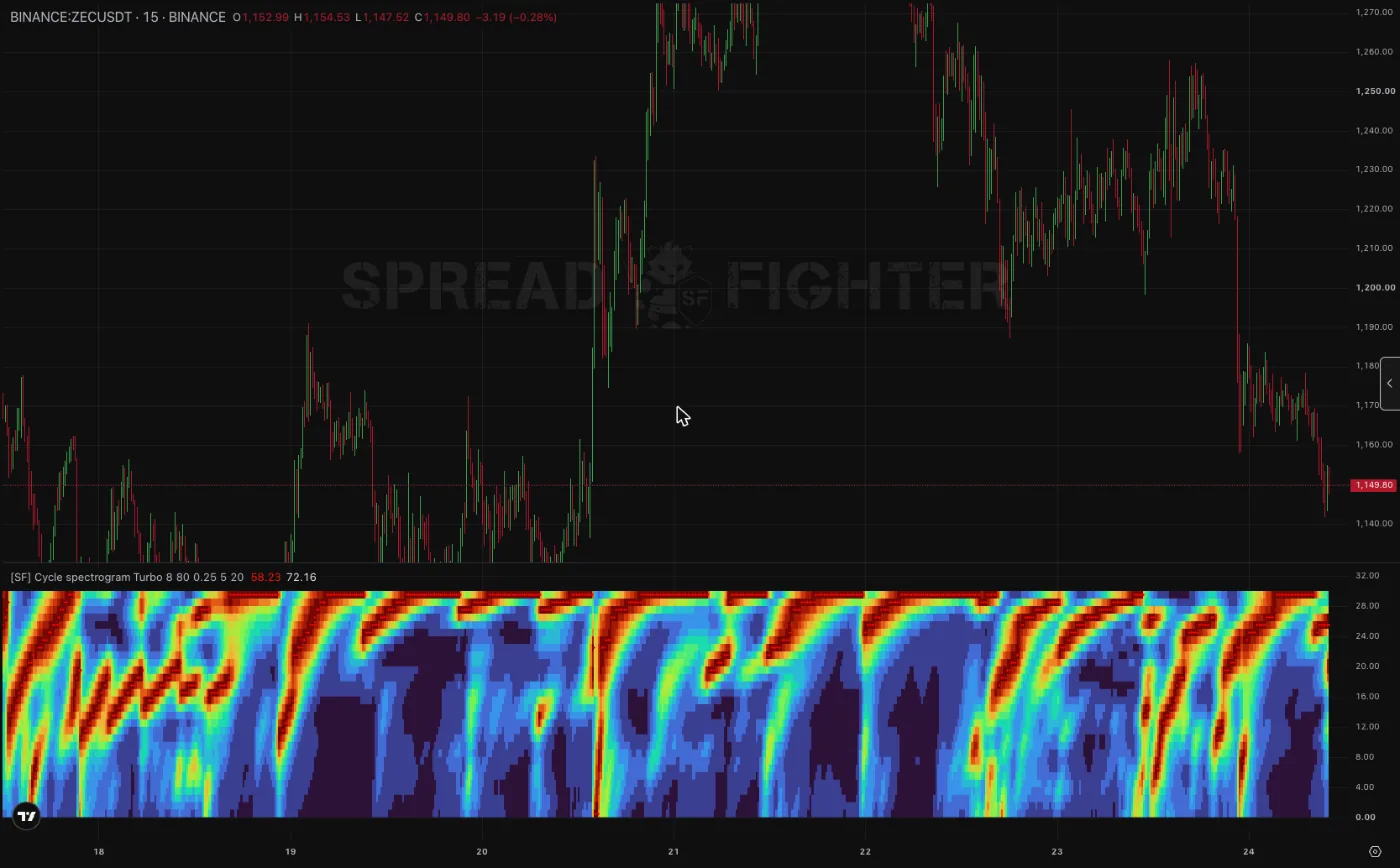
ZECUSDT, 15m, default settings. Red crosses show the strongest cycle. Bright vertical flashes coincide with sharp moves.
Description
The indicator is called [SF] Cycle spectrogram. It is in the Custom Indicators list, in the technical analysis section. It is available on the Pro plan and above.
The range of periods from minimum to maximum (8–80 bars by default) is divided into 30 bands. For each band, the indicator calculates how strongly the price is currently oscillating with that period. The result is drawn as a heat map under the chart:
- each column is one bar;
- each row is one band of periods: short cycles at the bottom, long ones at the top;
- color is the power of the cycle: dark means there is no cycle with this period, bright (red in the Turbo theme) means it is strong;
- a red cross marks the most powerful band on that bar. This is the dominant cycle.
The status line has two numbers, both in bars:
- red - the current dominant period;
- white - the average dominant period over the last 20 bars. It jumps less, and it is better to rely on it.
The scale on the right shows the band number (0–30), not the period. The bands follow a logarithmic scale, so short periods are sliced finer than long ones. With default settings:
| Band on the scale | Period, bars |
|---|---|
| 0–1 (bottom) | 8 |
| 7–8 | 14 |
| 14–15 | 24 |
| 21–22 | 42 |
| 29–30 (top) | 80 |
How it is calculated
Each band uses its own band-pass filter by John Ehlers ("Cycle Analytics for Traders"). It passes price oscillations near the given period and suppresses the rest:
where is the bar midpoint , , , , and is the band width (Bandwidth).
The band power is the square of the filter output , exponentially smoothed with the coefficient . Then on each bar the powers are divided by the largest of the 30, and the resulting share from 0 to 1 is converted to a color.
Normalization happens within each column. Brightness tells you which cycle is stronger on that bar, but not whether the oscillations are stronger now than an hour ago. The most powerful band is always bright, even in a calm market.
How to read
A bright horizontal band, crosses at the same height. The market is swinging with a stable period. This is the best state for the indicator: the distance between neighboring price peaks (or troughs) will be about the dominant period, and from peak to trough about half of it.
Crosses pressed to the top band. The strongest "cycle" is longer than the maximum period, so the chart is essentially a trend. Do not trust cycle estimates here. You can raise Maximum period and check whether a cycle is found in a wider range.
Crosses jump between different heights. There is no clear cycle, and the market is noisy. At such moments, it is better not to use the average period in the status line.
A bright vertical flash from bottom to top. A sharp single price jerk. The impulse excites all the filters at once, so on the next few bars the picture is not about cycles but about the jerk itself. After the flash, the energy usually "creeps" upward along a diagonal: the long-period filters release the impulse more slowly. Such a slanted trace is visible in the screenshot after every strong move.
How to use
- Choose the length of other indicators. The main practical use according to Ehlers. A fixed RSI(14) treats a market with a 10-bar cycle and a 60-bar cycle the same way. If the average dominant period is stable, set the oscillator length (RSI, Stochastic) to about half of the period, and the moving average length to about the full period.
- Wait for a reversal by time. In a stable cycle, after a local peak the next trough is expected in about half the dominant period. This is a timing estimate, not a direction estimate: look for confirmation in price and in other models.
- Tell a cycle from a trend. Crosses at the top and a dark lower half mean a trend: catching reversals with oscillators is dangerous here. A bright stable band in the middle means a range with a rhythm: oscillators work better here.
- Choose the timeframe. If on the current timeframe the dominant cycle stays at the upper edge all the time, move to a larger timeframe: the cycle will fall inside the range.
Settings
| Setting | Default | What it does |
|---|---|---|
| Theme | Turbo | Color scheme: Turbo, Viridis, Inferno, Magma, Plasma, Cividis. Viridis and Cividis read well with color vision deficiencies. |
| Minimum period | 8 | The shortest cycle, in bars. Below 6–8 bars the filters mostly catch noise. |
| Maximum period | 80 | The longest cycle, in bars. The larger it is, the more history the indicator needs (see "Limitations"). |
| Bandwidth | 0.25 | The width of each filter. Smaller - the bands are sharper and separate close periods better, but ring more after jerks. Larger - the picture is smoother, but neighboring bands merge. |
| Power smoothing | 5 | Power smoothing. Larger - the picture is calmer and lags more. |
| Average period length | 20 | How many bars to average the dominant period over for the second number in the status line. |
Limitations
- This is not a direction signal. The indicator tells you about rhythm, not about up or down. We did not run a separate backtest of trading rules on it.
- Lag. The filters are recursive and the power is smoothed: a change of cycle shows up with a delay of several bars, more on long periods.
- Warm-up at the start. Long-period filters need hundreds of bars of history to forget their initial state. The leftmost part of the loaded history may differ from what you will see after earlier bars load.
- A cycle exists only inside the range. If the real cycle is longer than Maximum period or shorter than Minimum period, the indicator shows the nearest edge.
- The scale on the right is the band number. To find the period in bars, look at the status line or the table above.