MFI
The intensity with which money flows into or out of an asset.
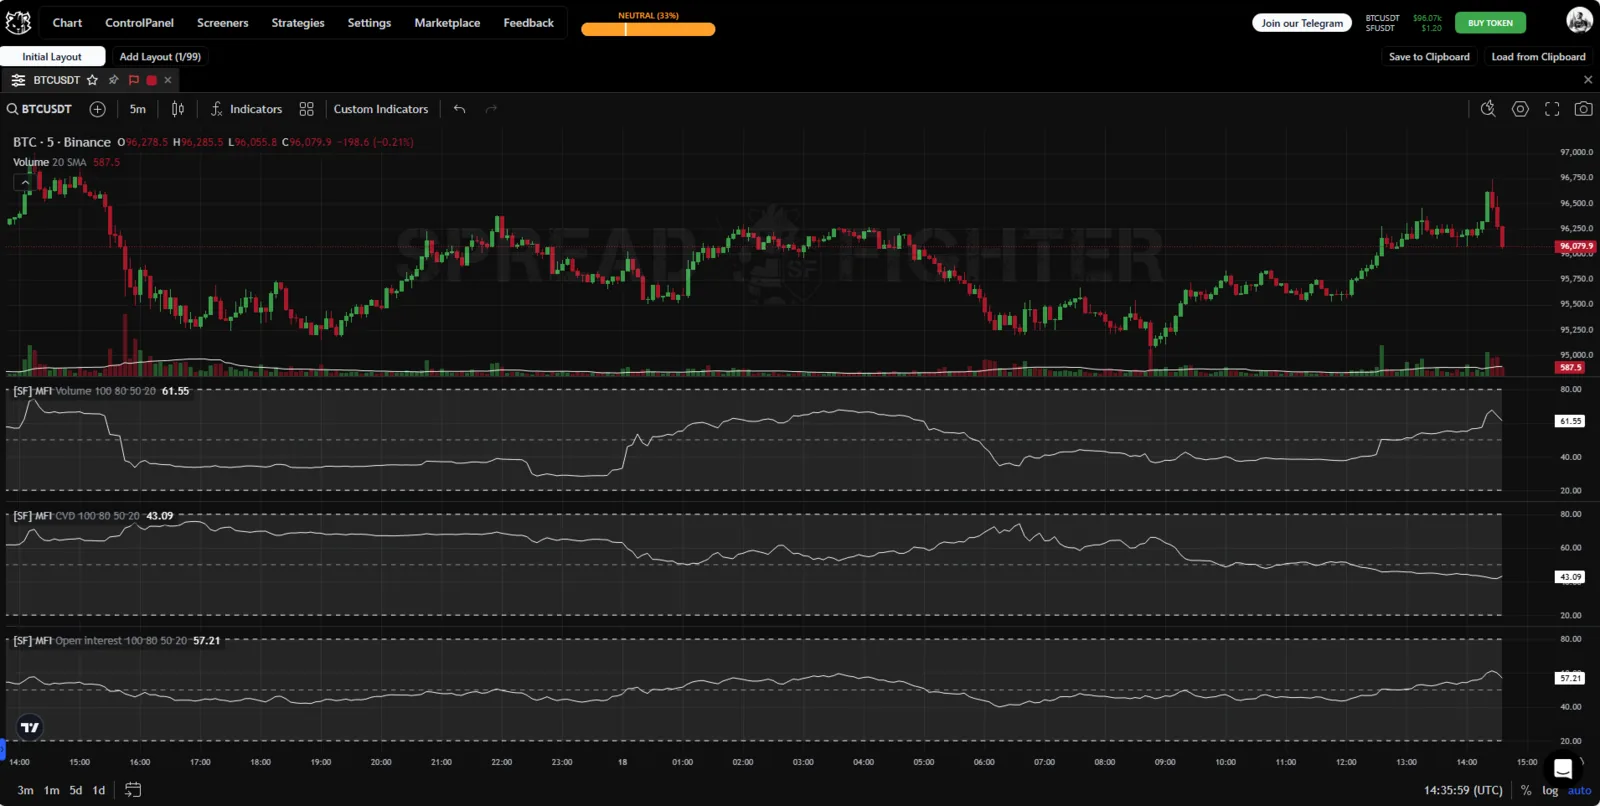
Indicator appearance.
Description
MFI is a classic tool for measuring the speed of price movement. The SpreadFighter version differs in that the user can choose the data source for the indicator calculation. The MFI calculation algorithm is given below.
Calculating the typical price:
where:
- is the typical price,
- is the candle high,
- is the candle low,
- is the closing price.
Calculating the money flow:
where:
- is the money flow,
- is the data source (volume by default).
Determining positive and negative money flow:
If :
If :
where:
- is the positive money flow,
- is the negative money flow,
- is the number of periods.
Calculating the money flow ratio:
where:
- is the money flow ratio.
Use Cases
With MFI you can use the same classic signals that are typical for most oscillators. These are divergence, overbought levels, oversold levels, and crossing of the median line. You can also watch for chart patterns forming on the indicator. A comfortable trading timeframe is chosen individually, but MFI is mostly used on charts of 1 hour and higher. Depending on the liquidity of the asset and the time interval under consideration, you can adjust the thresholds for oversold (Oversold) and overbought (Overbought).
- Reaching oversold levels says the market may reverse soon, but it is not a buy signal. In a strong trend the market can stay overbought or oversold for quite a long time. The buy signal is the price leaving this zone upward, which shows that positive money flow is gaining strength.
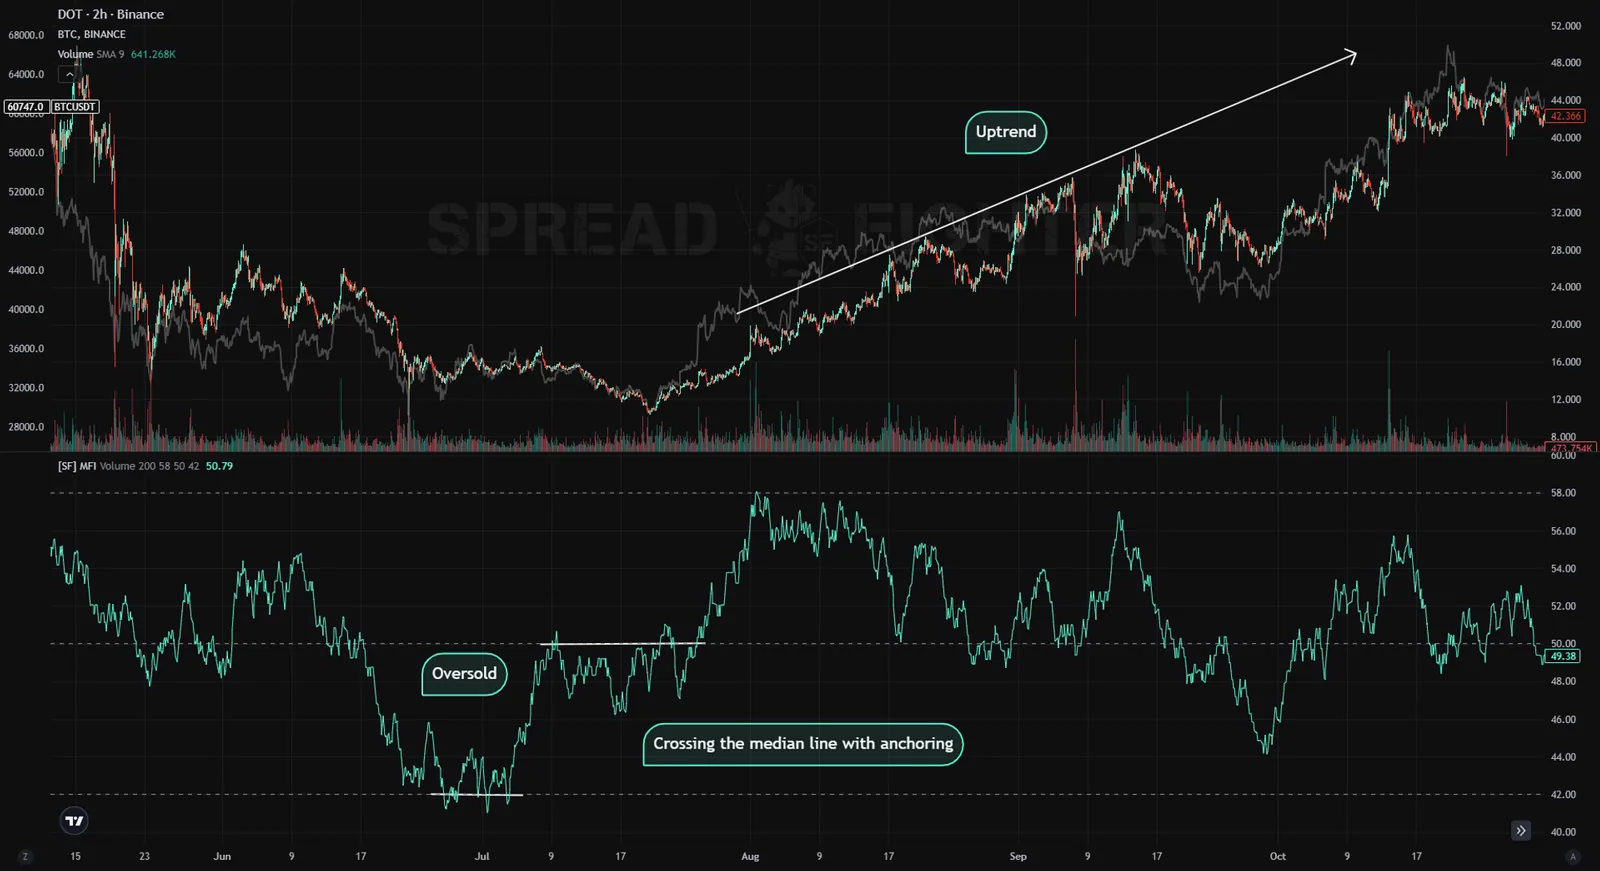
An uptrend forms after the MFI indicator reaches the oversold level.
- In the same way, use the price leaving the overbought zone, which signals that it is time to sell.
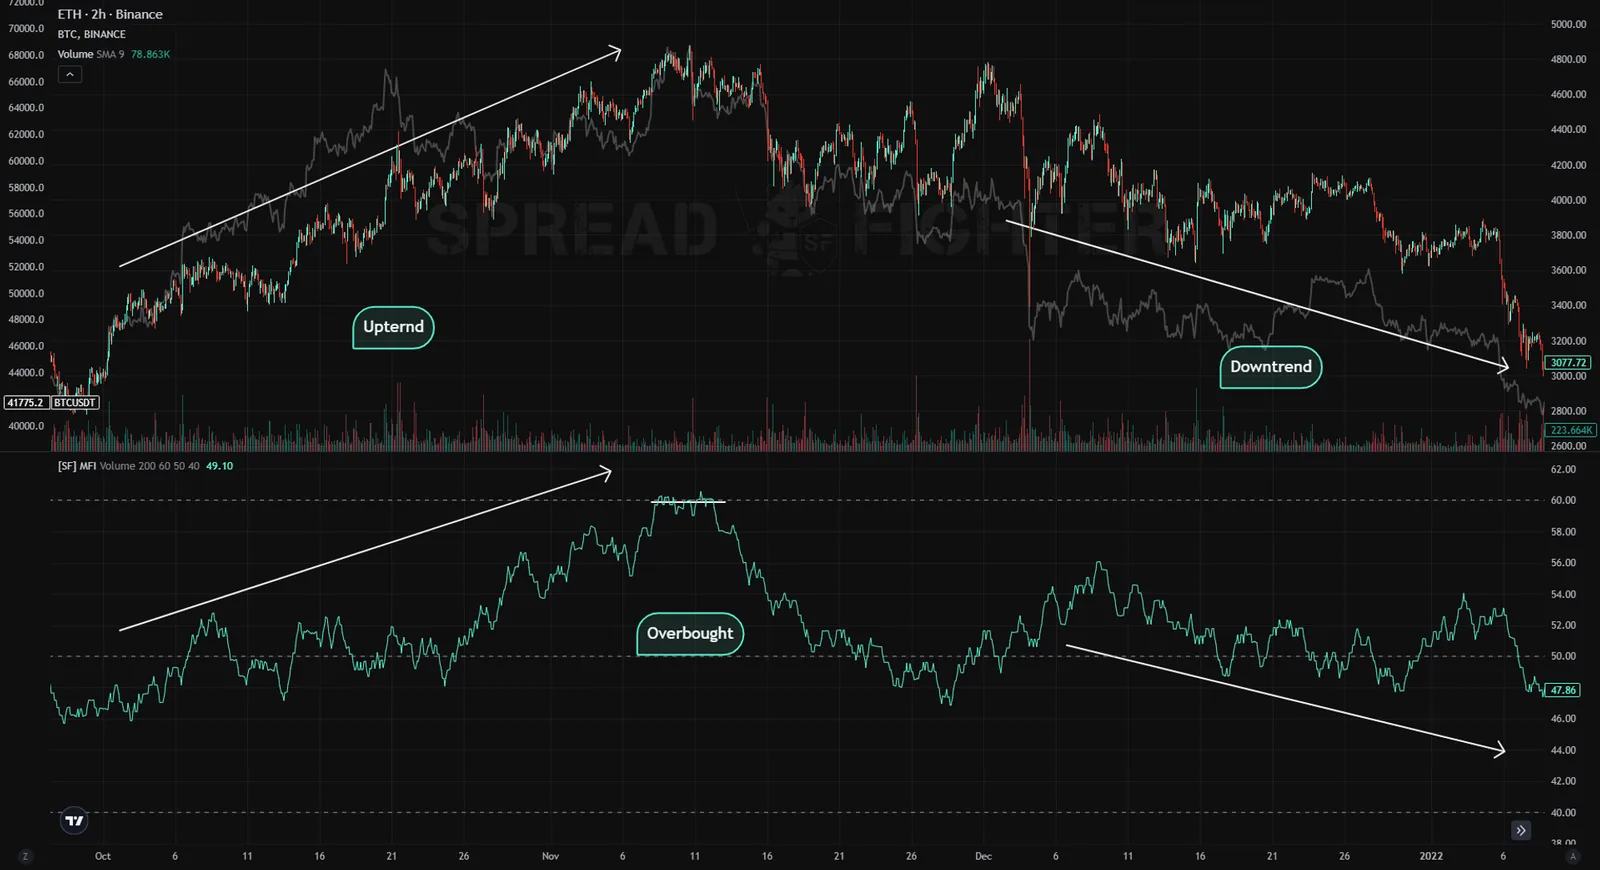
A downtrend forms after the MFI indicator reaches the overbought level.
- Divergence is the process of extremes drifting apart on the asset price chart and on the chart of an indicator that describes the parameters of trading in the asset. Divergence between price and the MFI indicator shows that the dominant side is starting to take profits and is preparing for a price reversal.
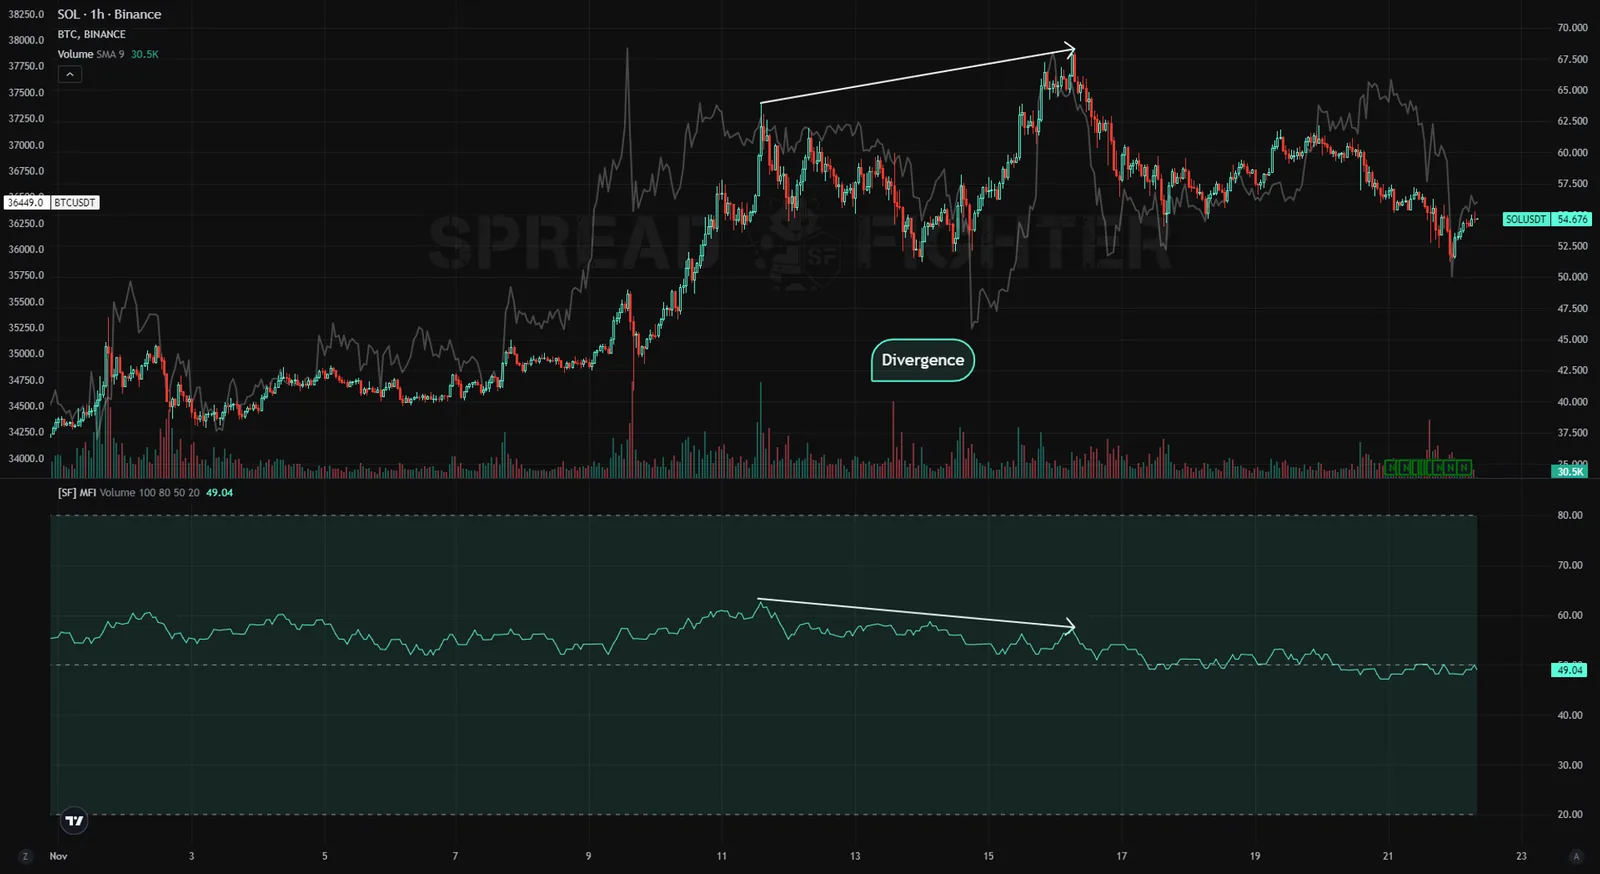
Divergence in an uptrend leads to the formation of a downtrend.
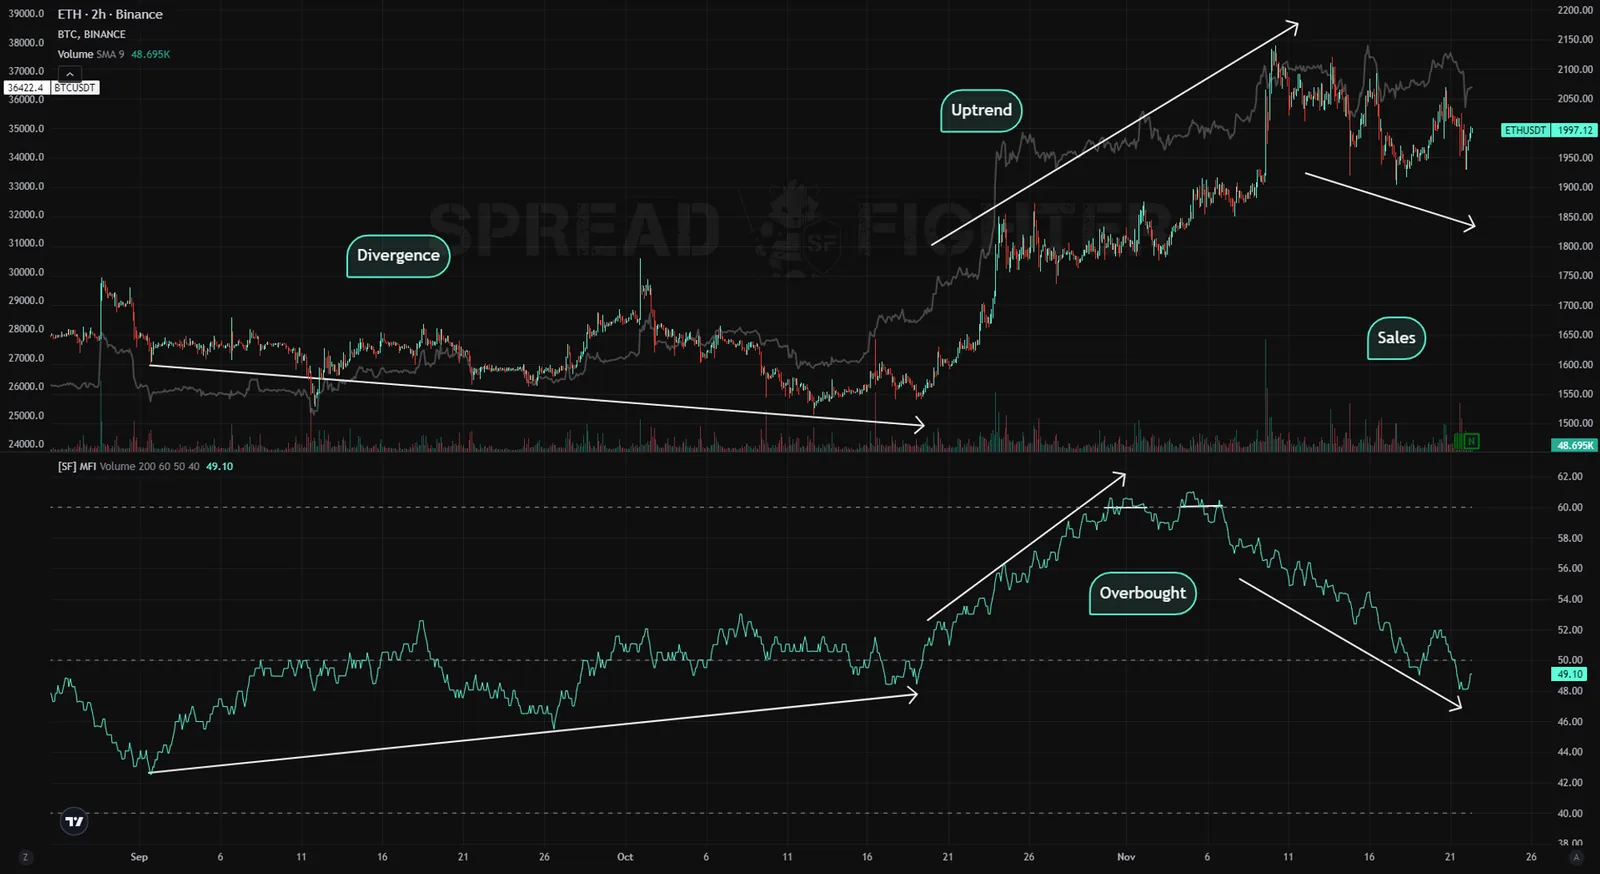
Divergence in a downtrend leads to the formation of an uptrend with an Overbought pattern forming and subsequent distribution of the asset (Distribution).
- The MFI indicator crossing the median line from bottom to top shows growing buyer pressure and is a signal to buy the asset. A cross from top to bottom says sellers are gaining strength, and sell positions now take priority.
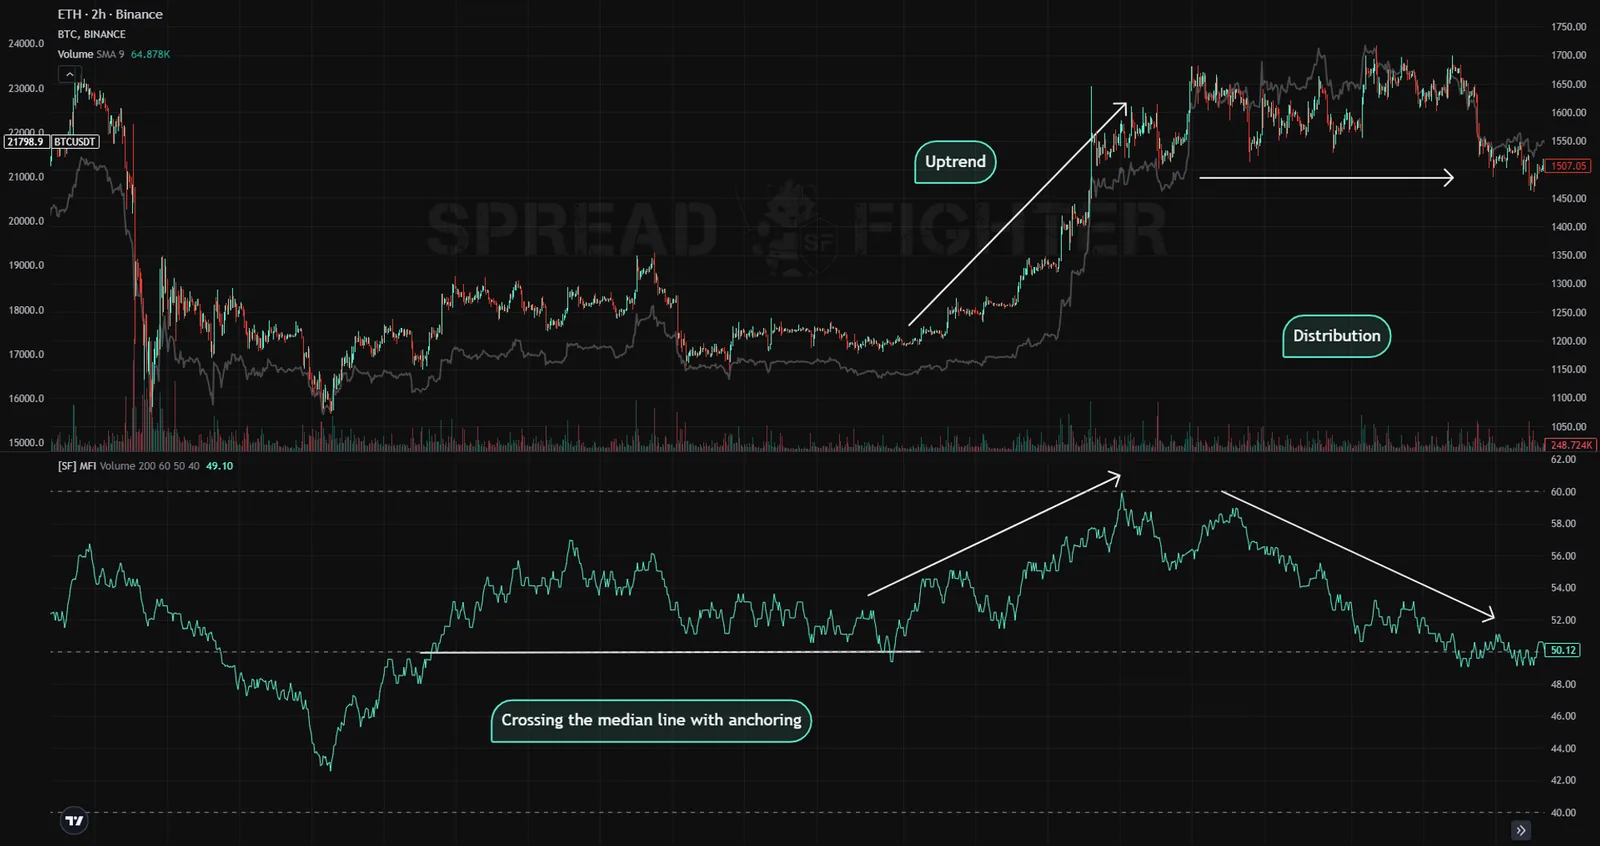
Crossing the median line from top to bottom with consolidation leads to the formation of a downtrend.
Sometimes a trading method is used in which you watch resistance/support levels, trends and technical analysis patterns, such as a "double top" or "head and shoulders", on the MFI chart. Signals that appear at the same time on the indicator chart and on the price chart can be considered especially reliable. This way of trading is quite specific, because a lot depends on the trader's subjective view and interpretation of what is happening.
Besides using the MFI indicator on its own, you can get a good trading system by combining it with trend or channel indicators. These can be, for example, Bollinger Bands, moving averages and other indicators.