Moving average
A classic technical analysis indicator
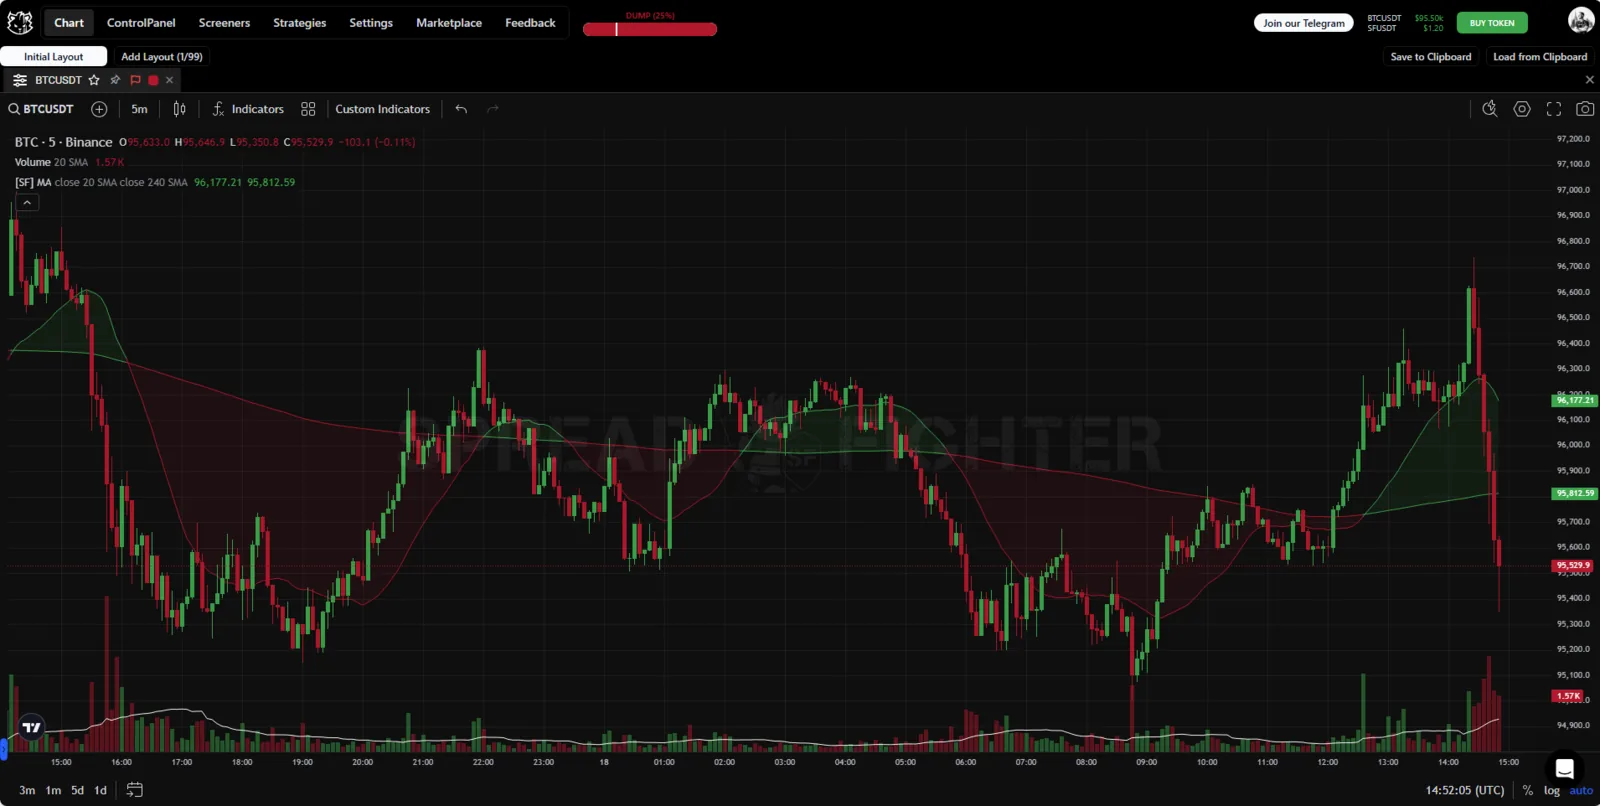
Indicator appearance.
Description
The main difference of the custom version of the indicator is that it shows two moving averages by default, a "fast" one and a "slow" one. The space between them is filled green or red depending on the current trend. The user can choose different smoothing options (SMA, EMA, VWMA, etc.) and the data source for building the moving average.
Use cases
The moving average (Moving Average) is the simplest indicator for determining the trend direction. Put simply, this technical analysis indicator adds up all prices over the previous periods and divides them by the number of periods.
Different methods are used to calculate the moving average:
- Simple (arithmetic mean, SMA)
- Exponential (EMA)
- Weighted (WMA)
- Volume-weighted (VWMA)
- Open-interest-weighted moving average (OIWMA)
- Linear regression (LSMA)
This averaging produces a line of average prices that either rises (uptrend), falls (downtrend) or oscillates in place (balance phase). The moving average smooths prices and removes sharp swings.
The length of the moving average and the calculation methods must be chosen empirically for different instruments and timeframes.
The main use cases of moving averages:
- Determining the trend direction
- Determining support and resistance points
- Crossovers of the moving average and price
- Crossovers of the fast and slow moving averages
- Determining the trend direction is one of the key functions of moving averages. Moving averages are lagging indicators, which means they do not predict a trend reversal but confirm the existing trend. As you can see on the chart, the asset price is in an uptrend when the price is above the slow moving average and the slow moving average itself points up. Conversely, a price below a downward-pointing slow moving average confirms a downtrend.
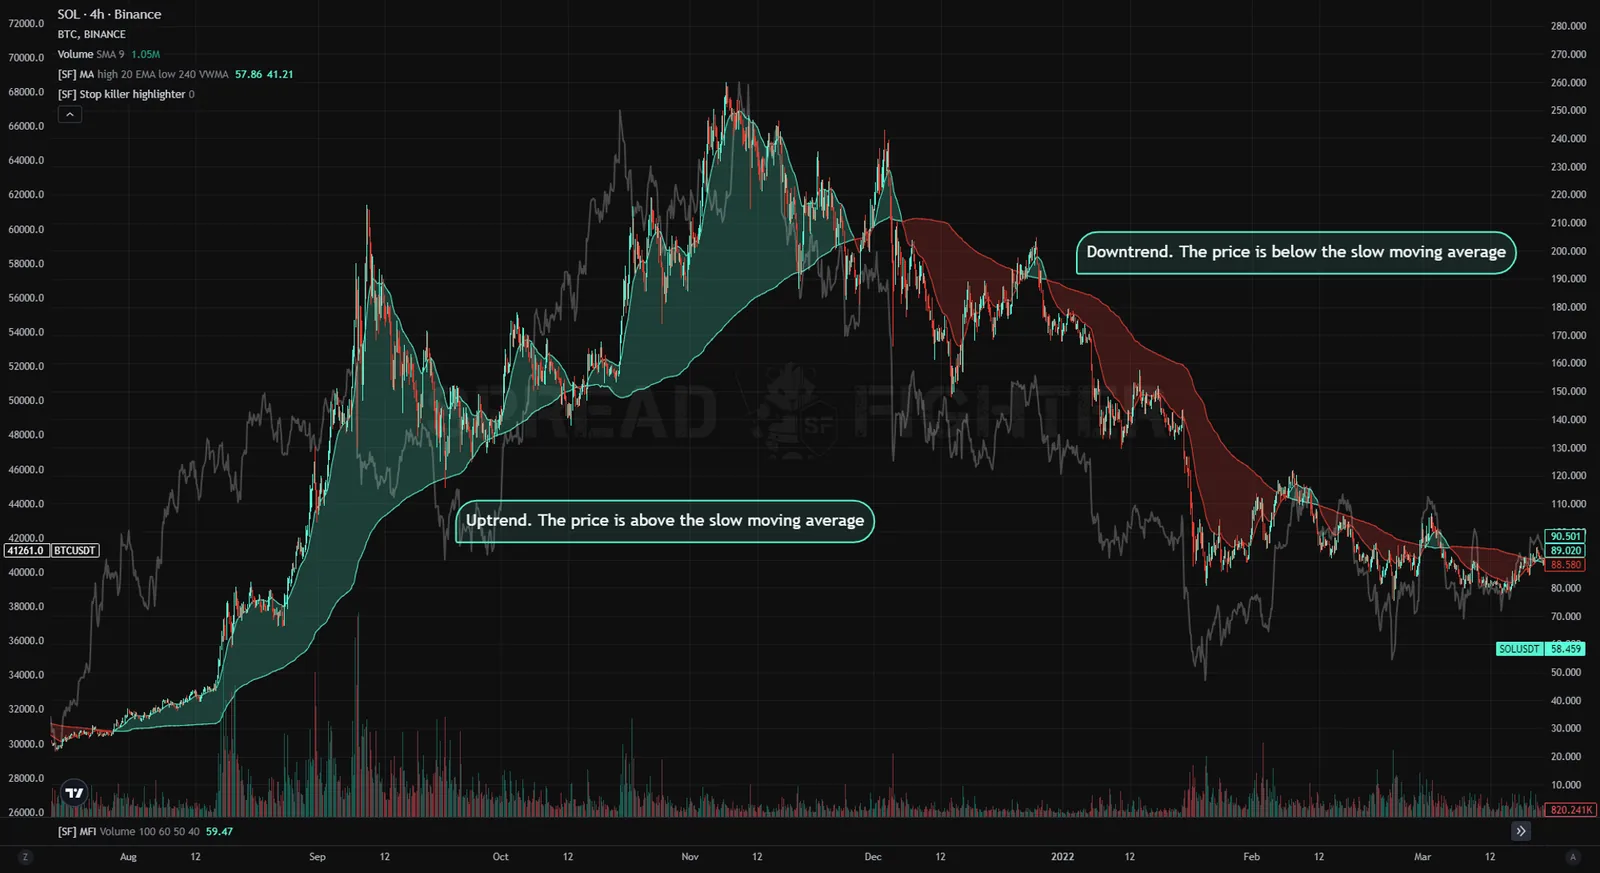
Determining the trend direction with the slow moving average.
- Another common use of moving averages is to identify potential price support. A price decline often slows down where the moving average runs. Key long moving averages can also produce a bounce, but this needs confirmation from other technical indicators, for example RSI in the oversold zone.
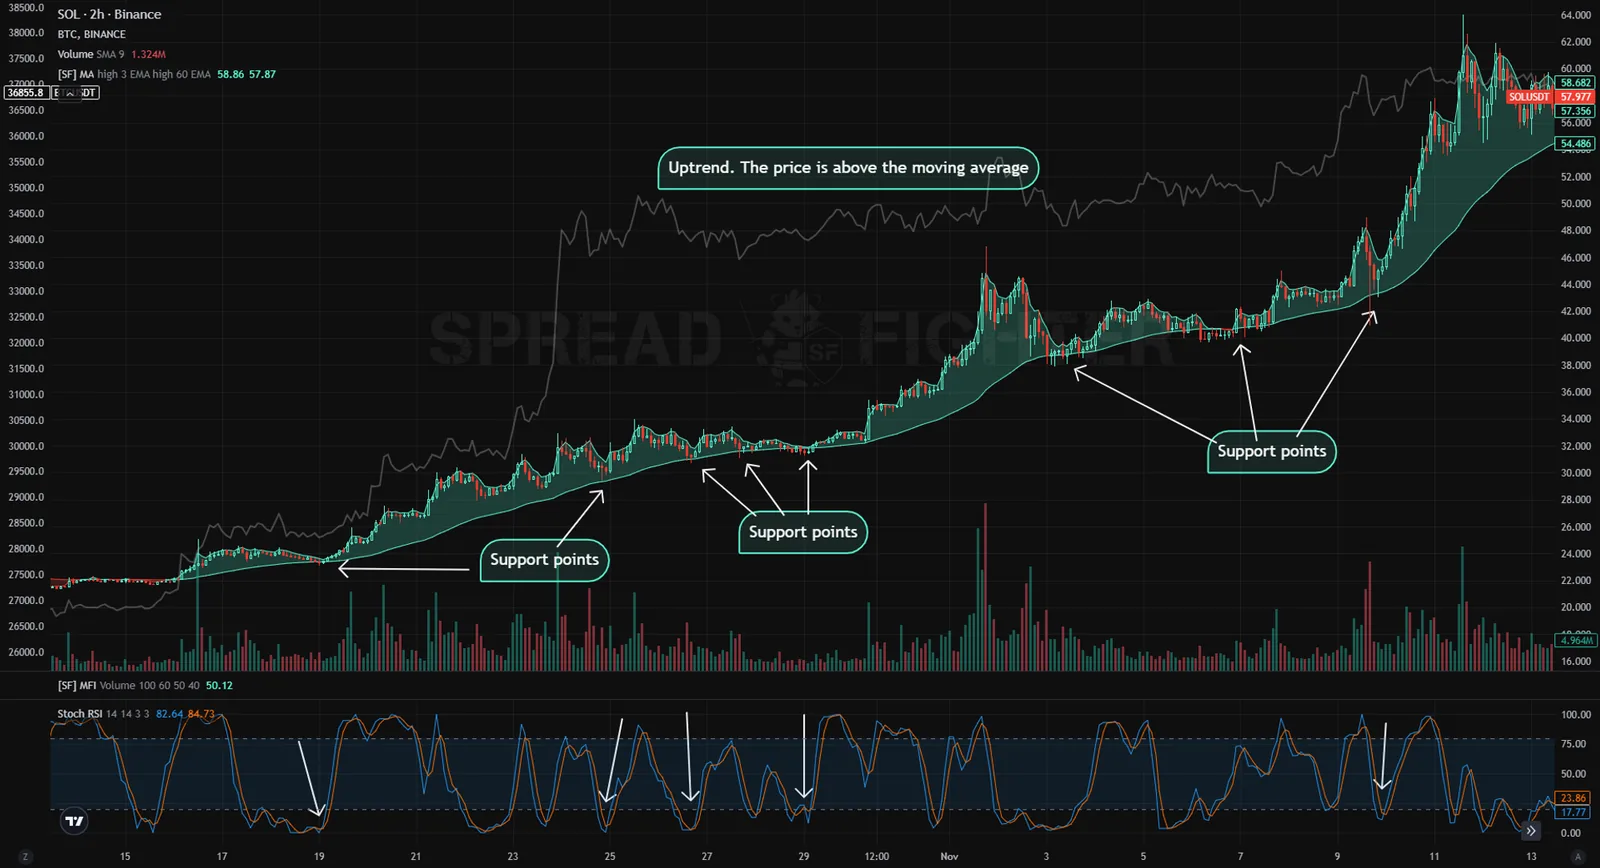
Support points on the slow moving average with RSI confirmation.
- When the asset price is below the slow moving average, it can be quite hard for it to settle above it. The MA then becomes resistance and traders use it as a sign to take profit. In this case moving averages can also be seen as entry points for a short position, since the price often bounces down from this level and keeps falling.
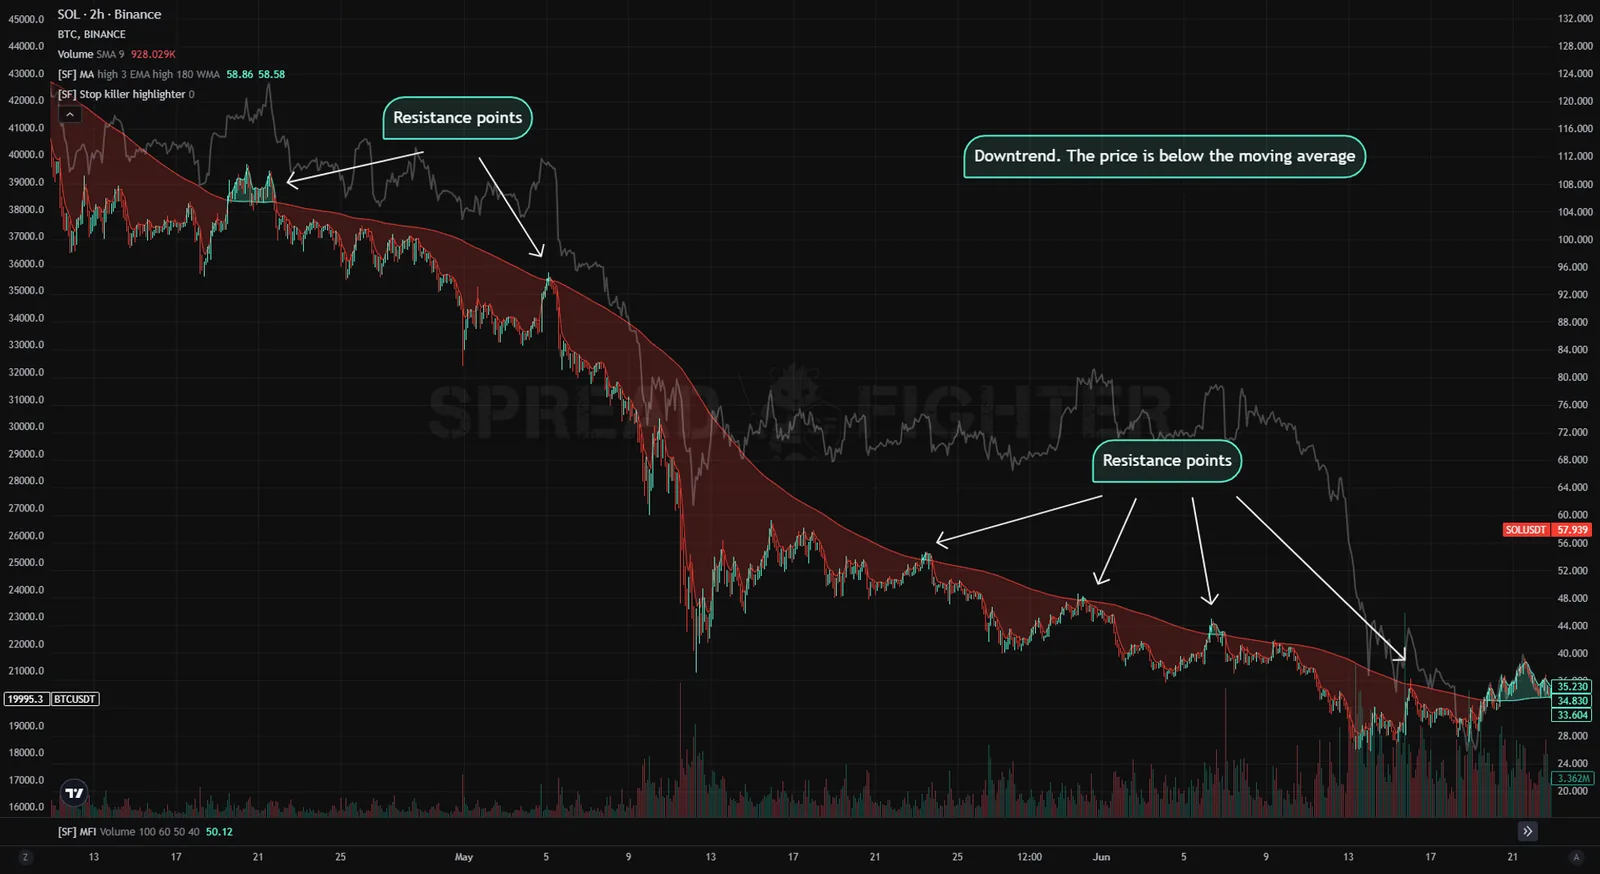
Resistance points on the slow moving average can be used to enter a short position
- The main principle of analyzing this trend indicator is to look at the position of the price chart relative to the average line (MA). While the price is above the average, the current situation is better than expected, which means bullish sentiment prevails in the market. Conversely, if the price falls below the moving average line, it signals that market expectations were not met and bears dominate the market. So a crossover of the MA and the price can become a signal to trade: a price crossing from below to above gives a buy signal, and from above to below gives a sell signal.
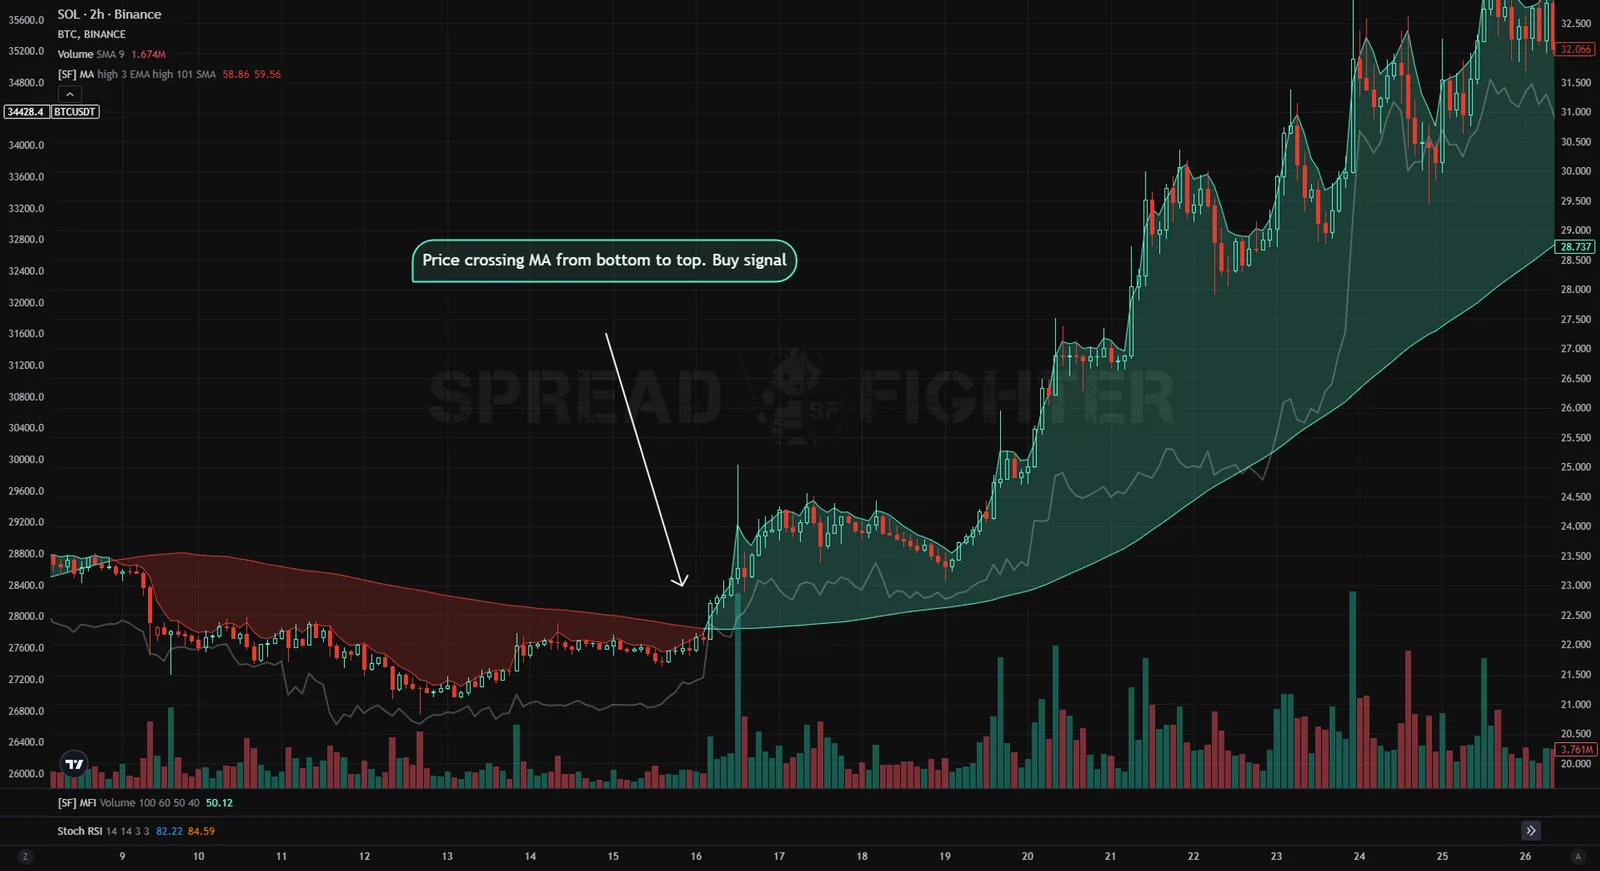
The price crosses the slow moving average from below to above - a buy signal.
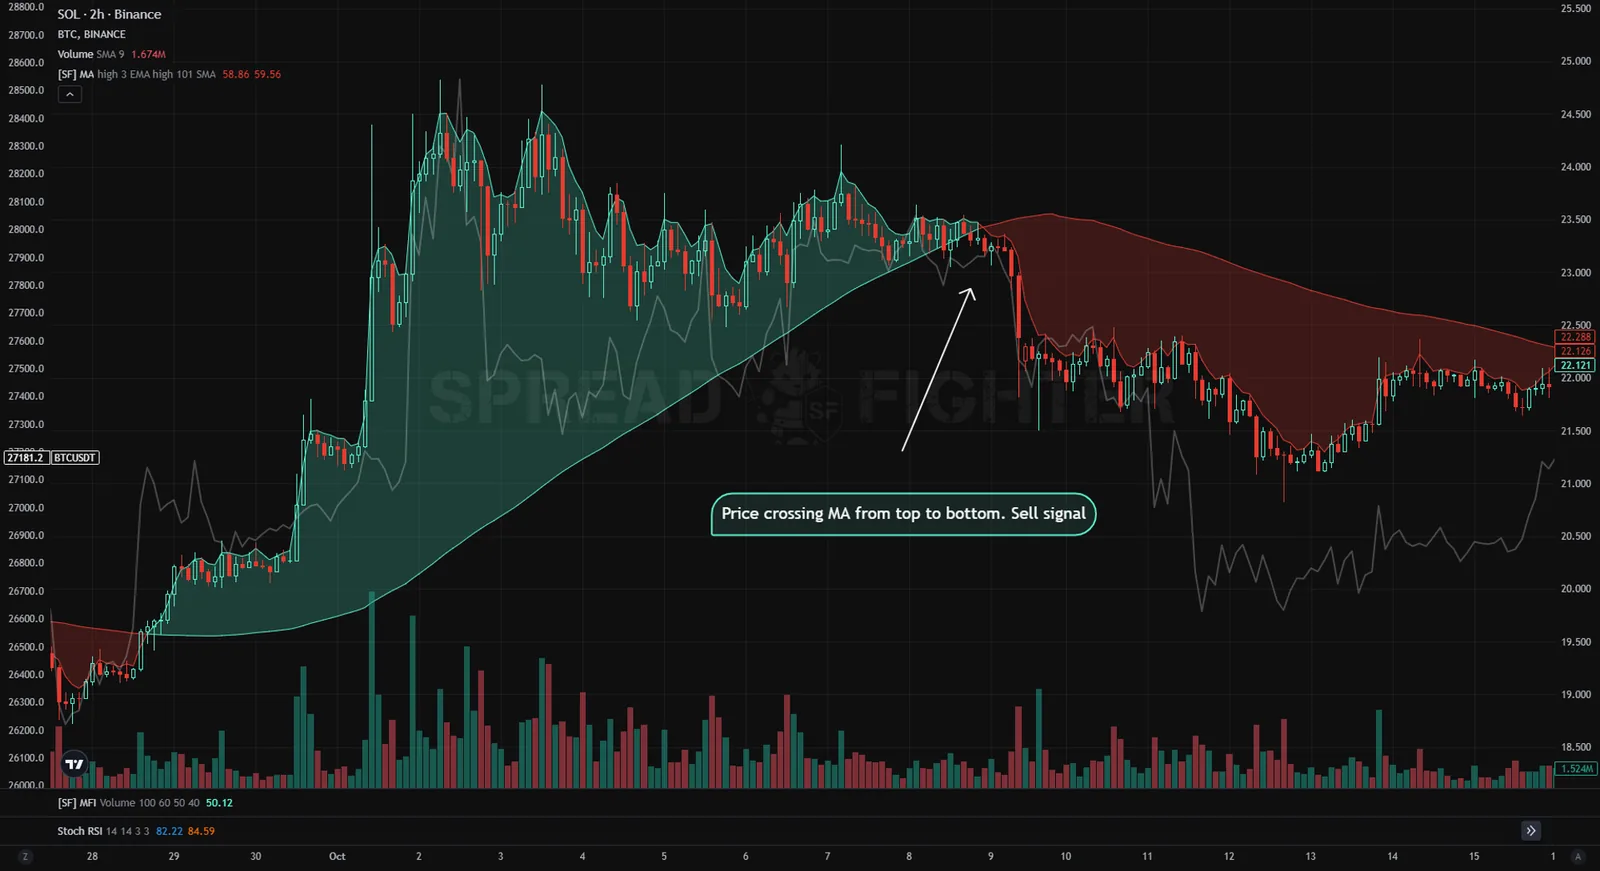
The price crosses the slow moving average from above to below - a sell signal.
- If the market shows strong volatility, a crossover of two or more moving averages with different periods is better suited for analysis. The principle of getting a trade signal from a crossover of two averages is the same as for a crossover of a moving average and the price chart, except that here the second moving average takes the place of the price chart. So a buy signal is the slow moving average being crossed from below to above by the fast one, and a sell signal is a crossover from above to below.
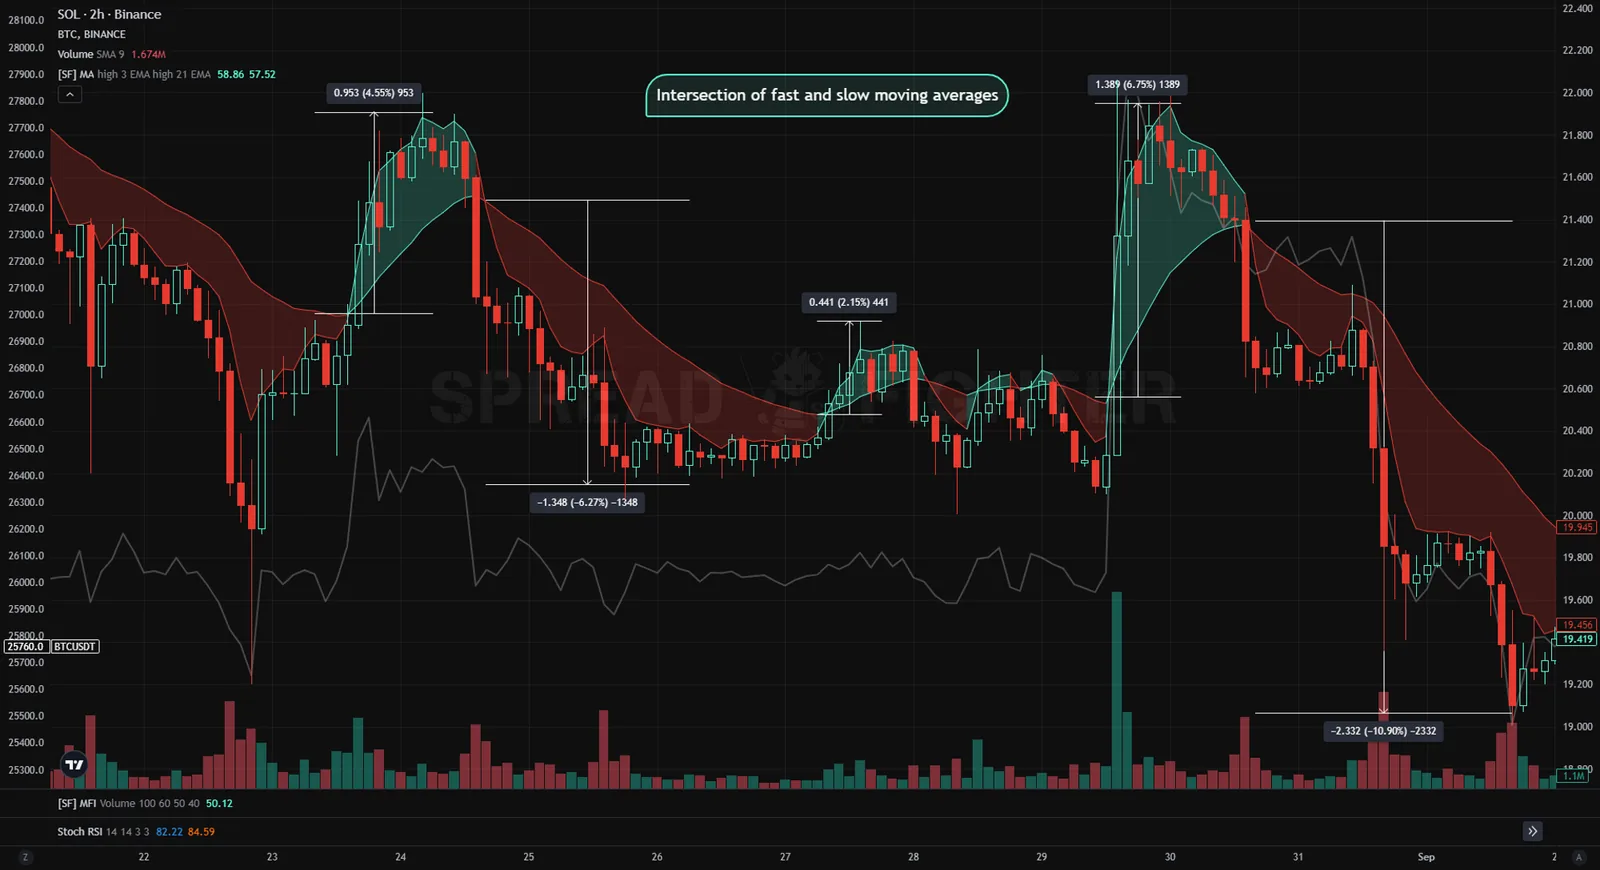
Using the crossover of the fast and slow moving averages to enter long and short positions.
Note also that when the market opens with a gap up or down, moving averages can give false buy or sell signals, since they are lagging indicators.
We do not recommend using moving averages in a price balance phase, as this lagging indicator will give many false signals.