RSI, MFI, Bollinger %B, CCI, NATR, NMI, ROC scanners
Monitor the broad market through classic technical analysis metrics.
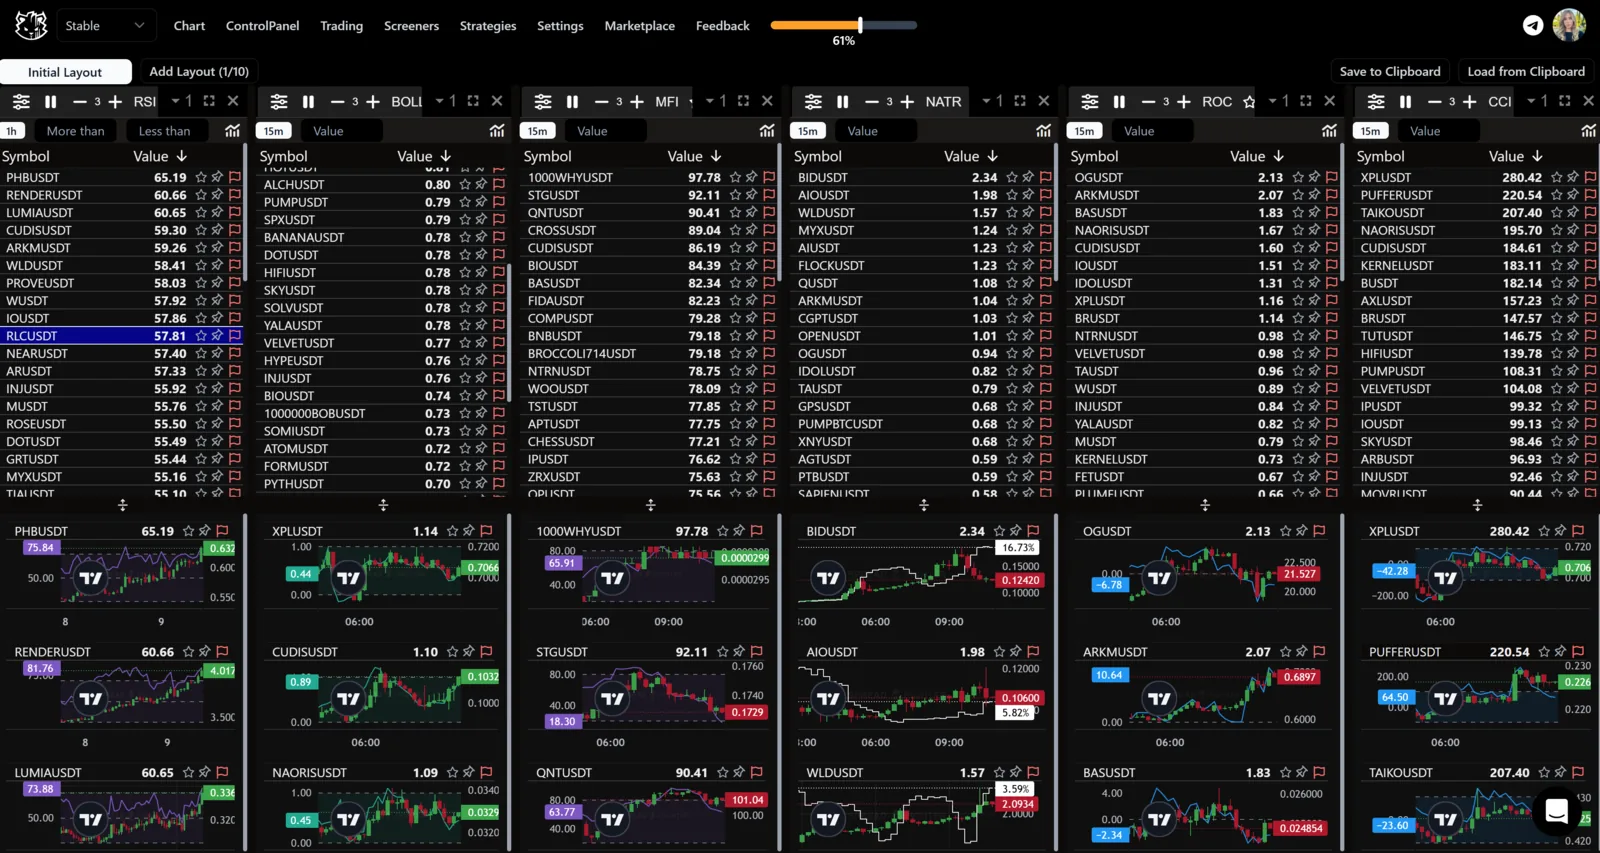
Widgets appearance.
Description
Scanners based on key technical analysis indicators (RSI, MFI, Bollinger %B, CCI, NATR, NMI, ROC) let you track assets that reach extreme values on their metrics: overbought and oversold levels, high volatility, or strong trend moves. Scanners in the Technical category calculate a technical analysis indicator for the whole broad market and rank assets by the value of that metric.
The scanners calculate data on one-minute intervals. For correct results, match the indicator settings to the selected timeframe. On the Chart, set the timeframe to 1 minute.
For example, if the scanner timeframe is 15 minutes, the length parameter of the indicator you choose must also be 15 (you can change it in the indicator settings).
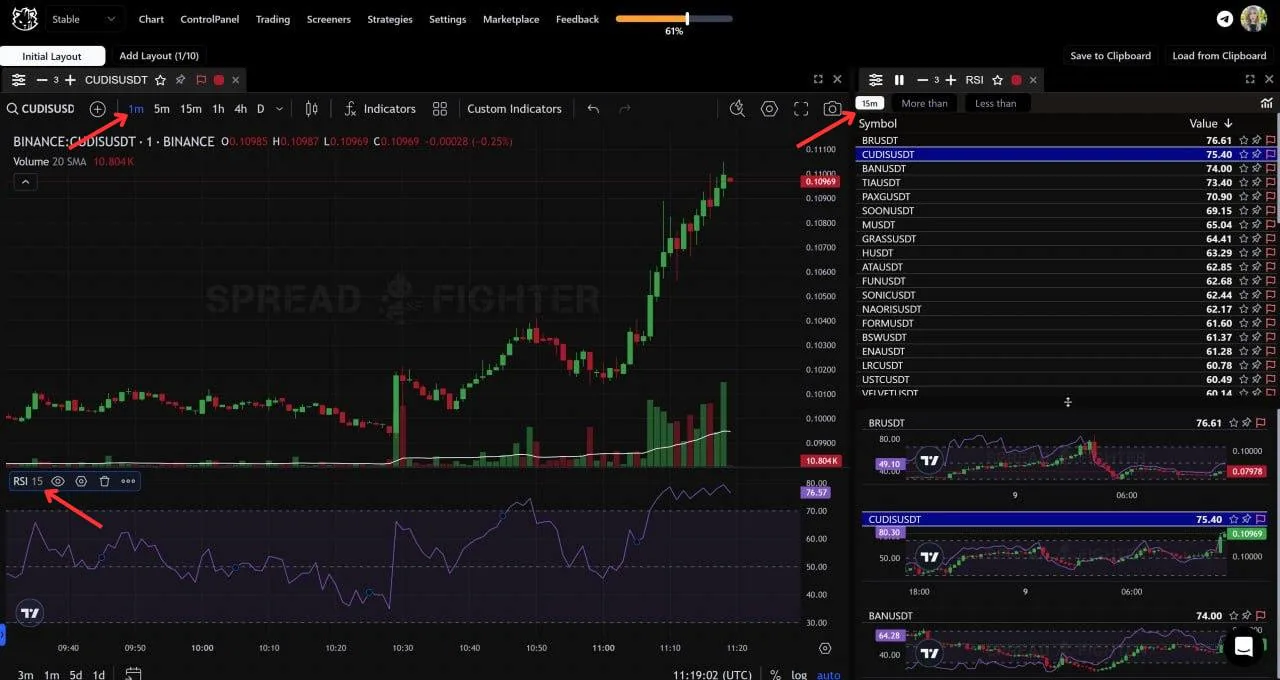
Length 15, timeframe 15.
With a 30-minute timeframe, the indicator length = 30.
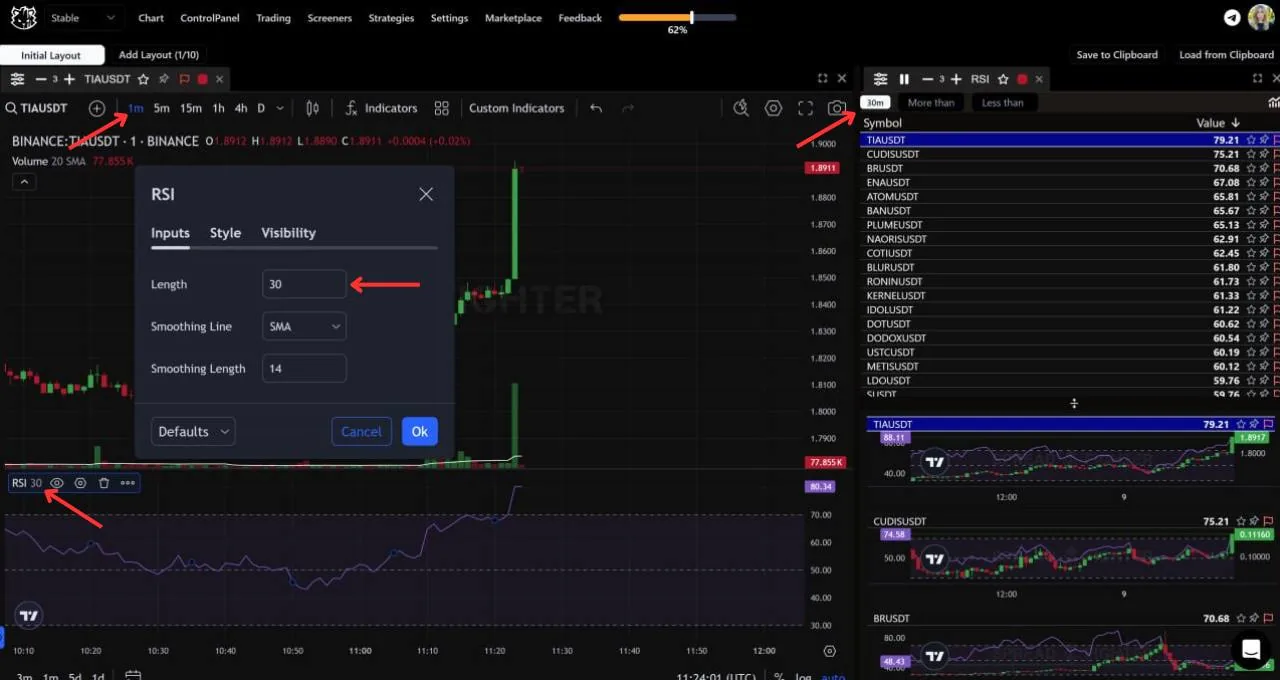
Length 30, timeframe 30.
With a 1h timeframe, the indicator length = 60.
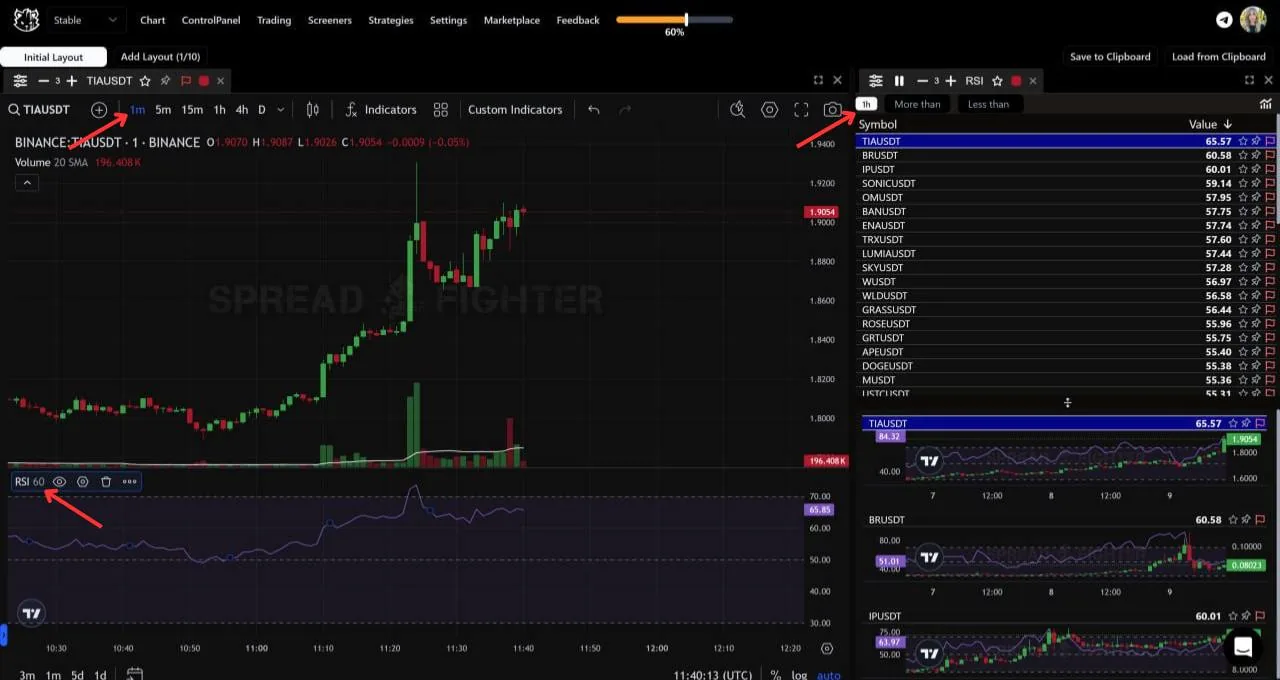
Length 60, timeframe 60.
With a 4-hour timeframe, the indicator length = 240;
with a daily chart, the indicator length = 1440.
Note that calculations on the one-minute timeframe can differ slightly (within a few points) because of rounding and how data is aggregated over intervals.
The RSI, MFI, Bollinger %B, CCI, NATR, NMI, and ROC scanners work on the same logic.
Location
The technical analysis widgets are in the category of the same name.
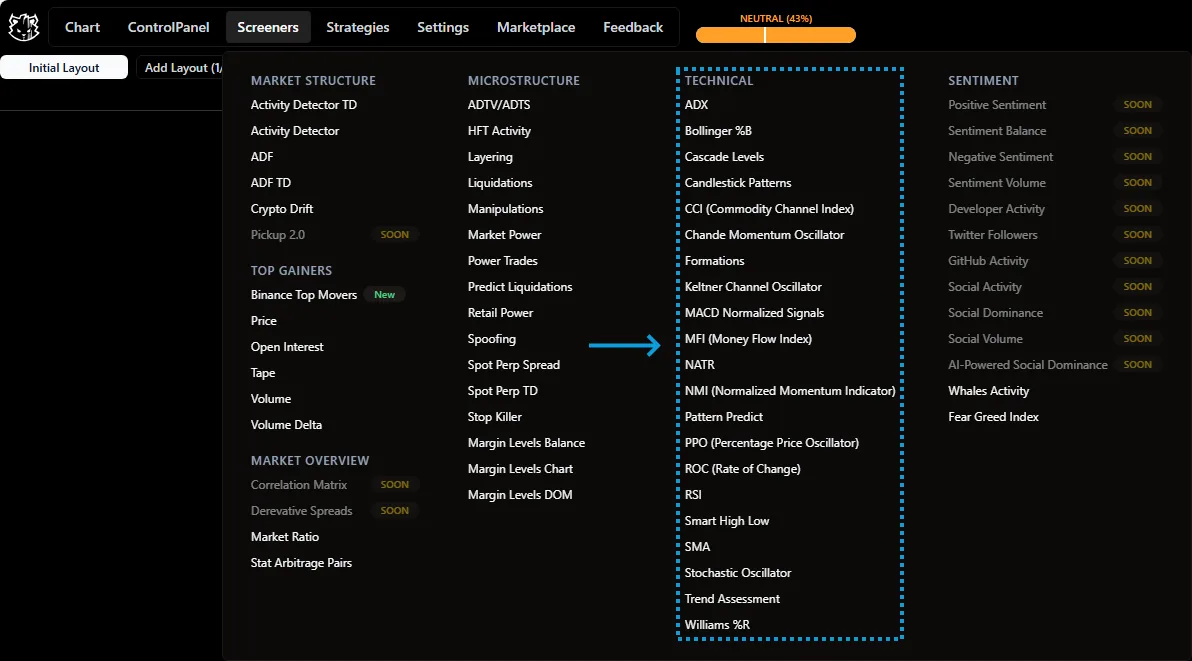
Scanners location.
Functionality
Technical analysis scanners share a unified layout with a single column, value. The column receives data that matches the specific model. The user can filter and sort incoming signals by the value metric.
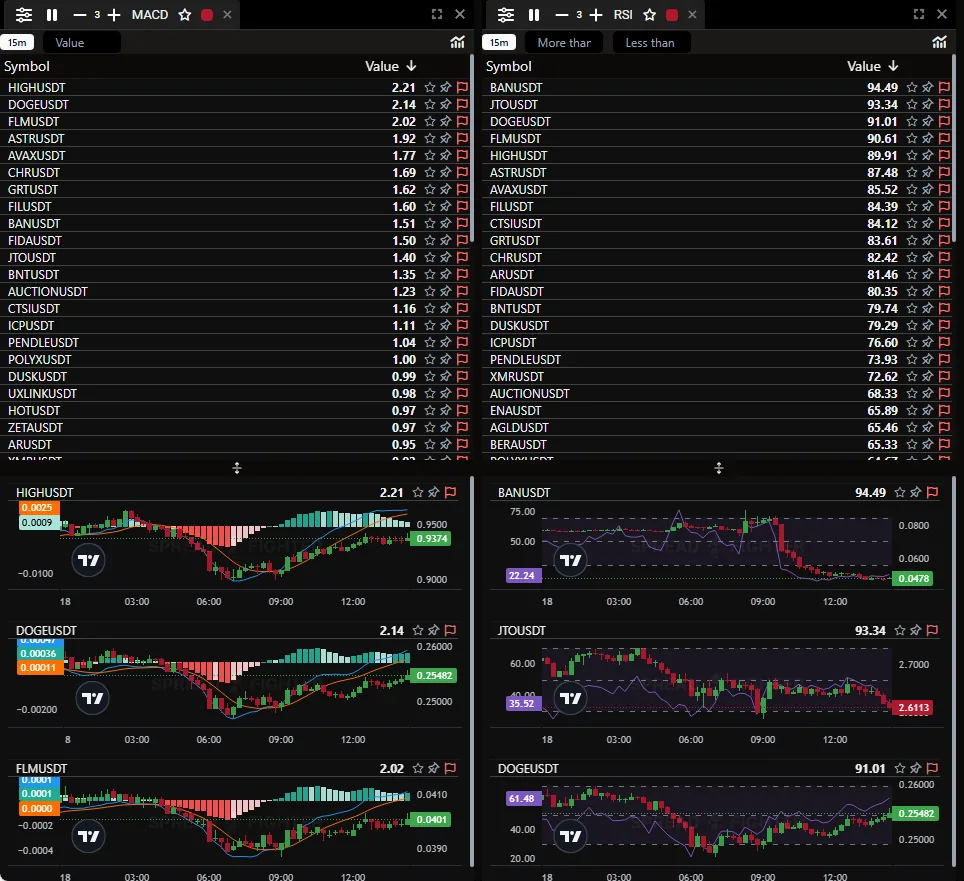
Technicals widgets.
Click the histogram icon to move the scanner indicator onto the chart.
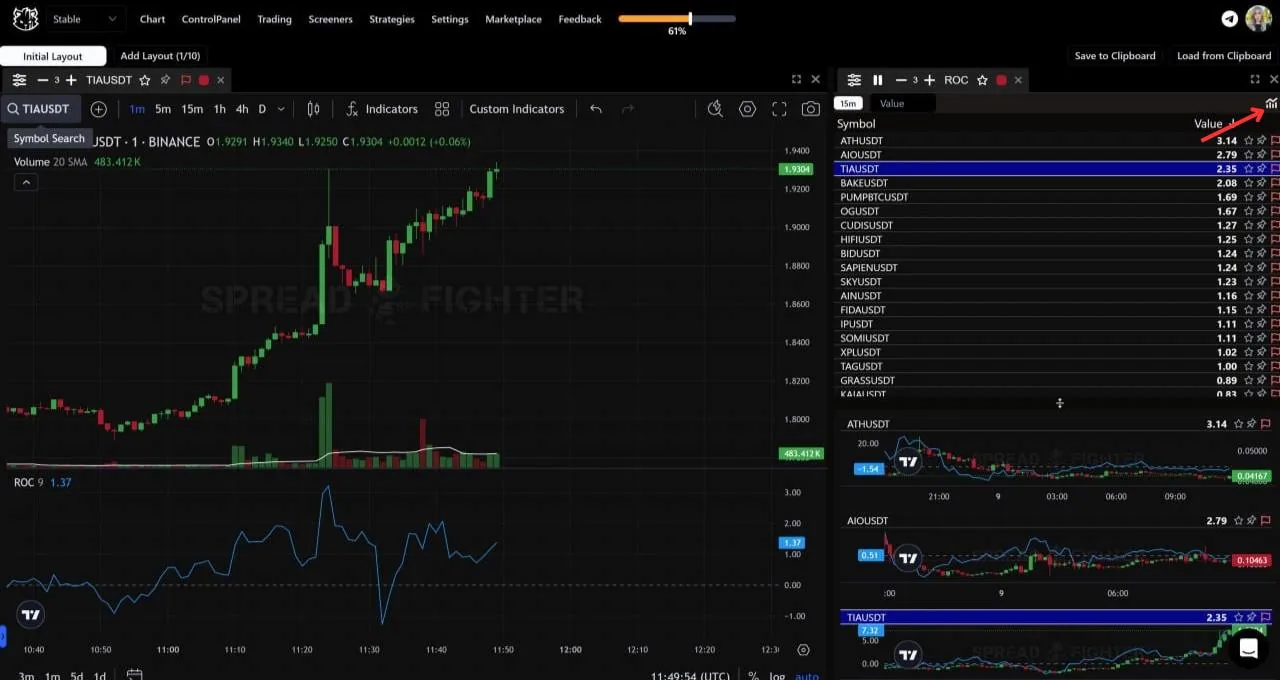
Adding the indicator to the chart.