Smart High&Low
A smart scanner of price highs and lows for crypto assets.
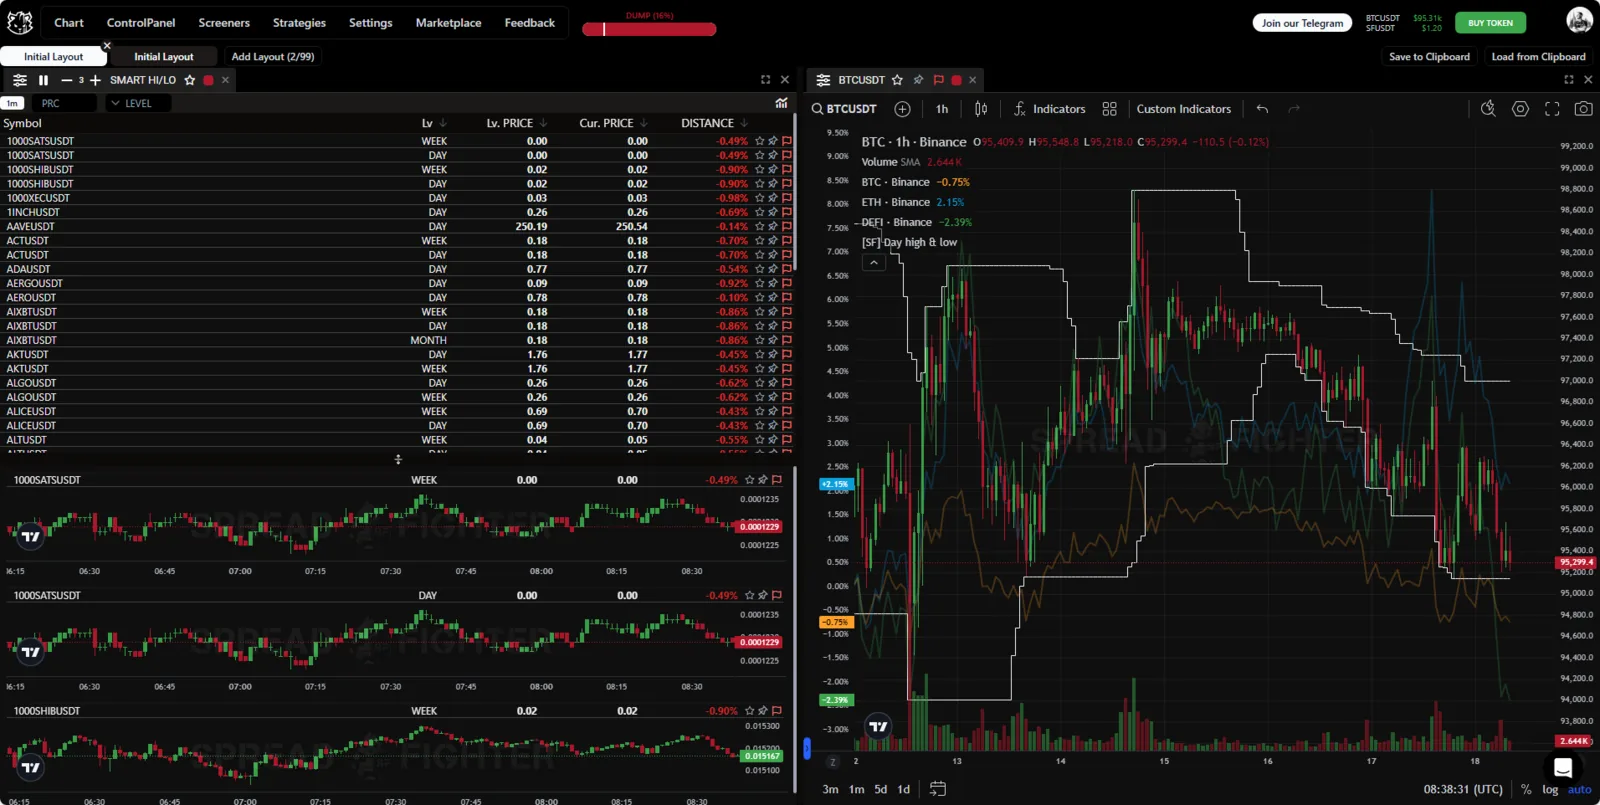
Widget appearance.
Model description
Smart High&Low levels in trading are points on the price chart that show the highest and lowest price reached over a given period.
The model tracks all traded coins and notifies the user when an extreme is approached or updated.
Widget location
To add the "Smart High&Low" tool to the workspace, first click the "Widget menu" button in the platform header. Then click the button with the same name in the "Technical" section.
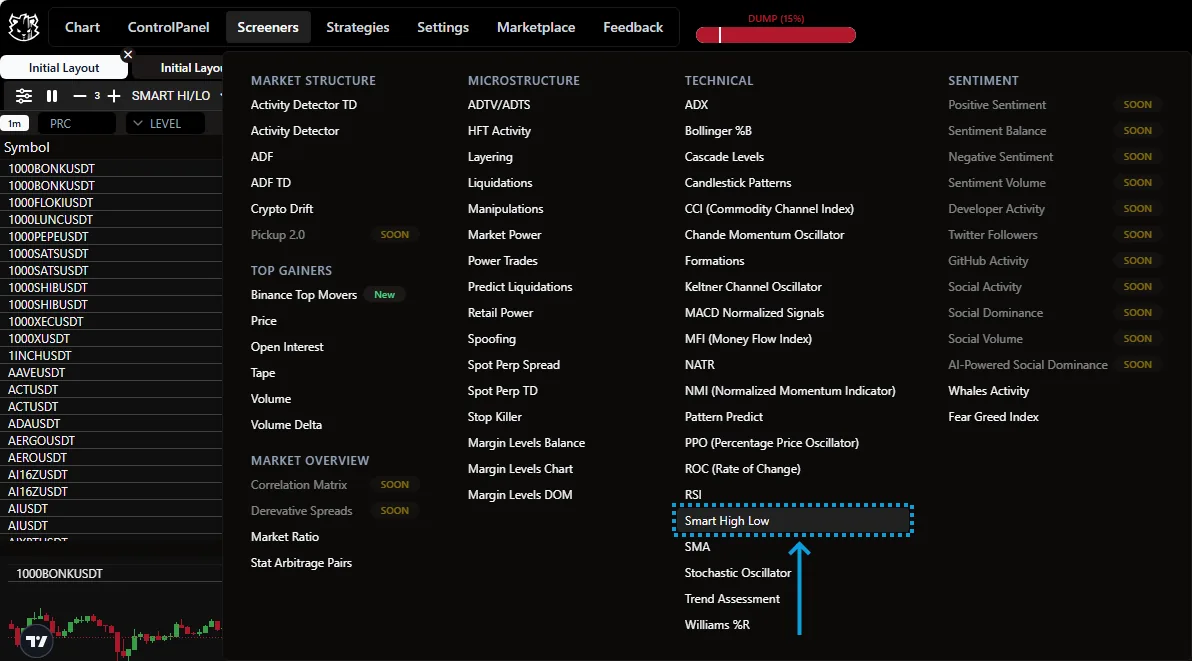
Widget location.
Functionality
Widget
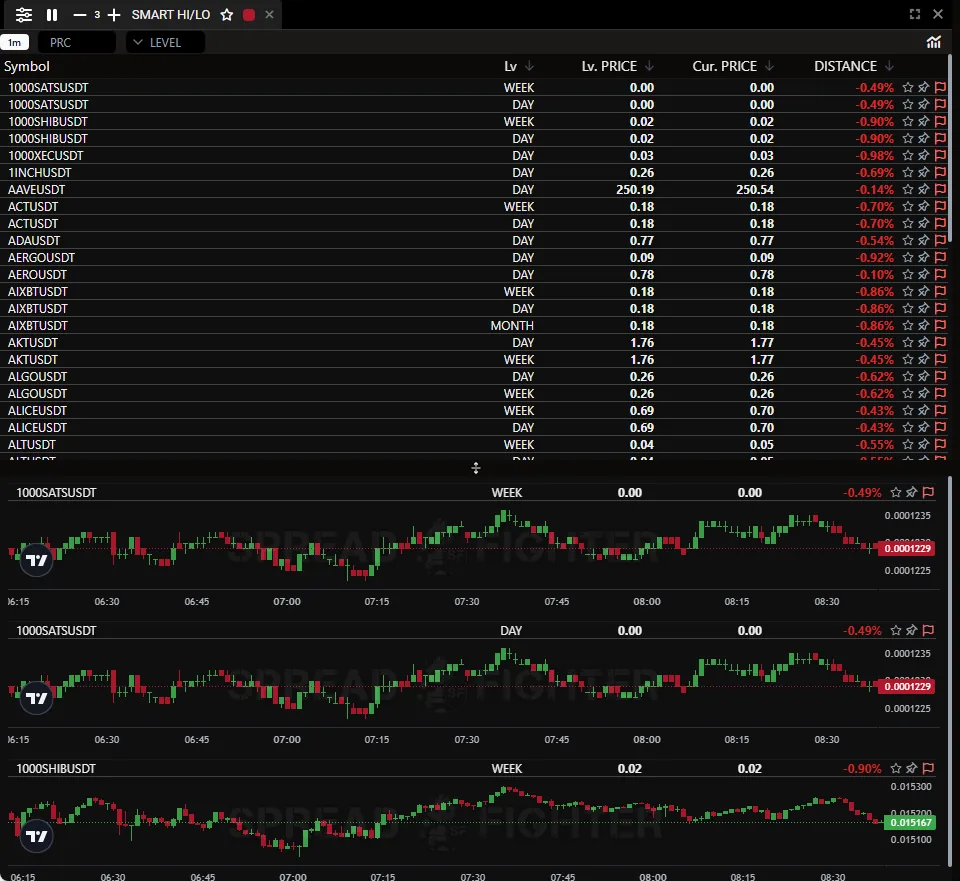
Widget.
Smart High&Low is a scanner that finds price highs and lows and notifies users when price approaches these levels. The data comes as a table.
The table shows these values:
- Lv - level type (intraday, daily, weekly, etc.)
- Lv Price - the absolute value of the price level.
- Cur. Price - the current close price.
- Distance - the distance to the level in percent
The user can filter the incoming data by price level type and by distance to the level.
The model visualization uses 2 colors:
- Green marks lows.
- Red marks highs.
Indicator
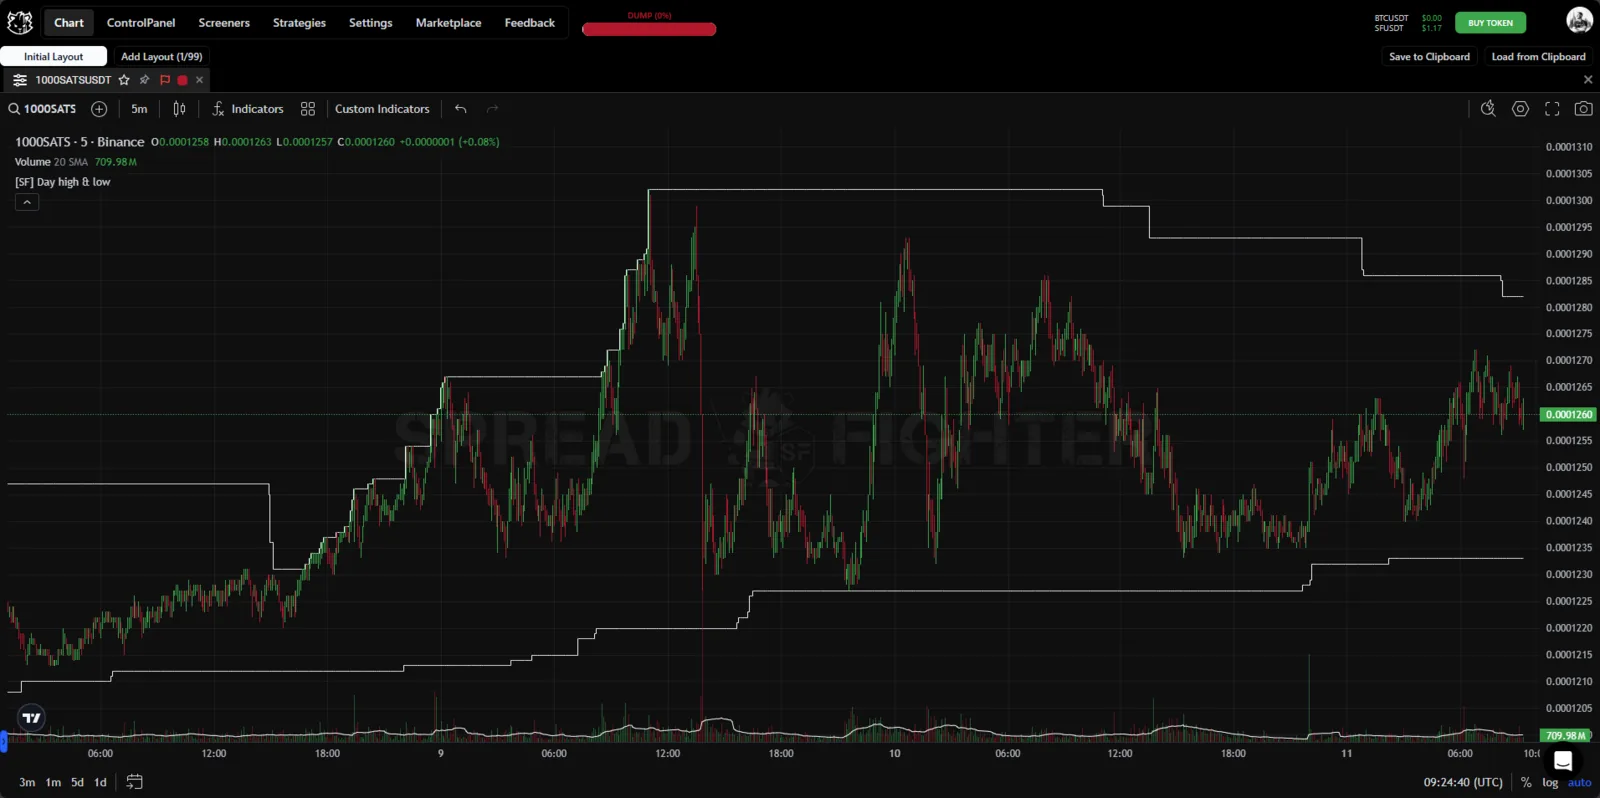
Indicator appearance
Day high & low works only on intraday timeframes and calculates the asset's maximum and minimum price over the last 24 hours.
Use cases
Smart High&Low is a useful helper for traders who trade breakouts/bounces from levels, because it lets you:
- cut the time spent searching for trade setups;
- get early signals that an important extreme is being approached or broken;
- find the most favorable points to open and close trades.
The widget works best together with the Dog tool.