Technicals category scanners
Monitoring the broad market through classic technical analysis metrics.
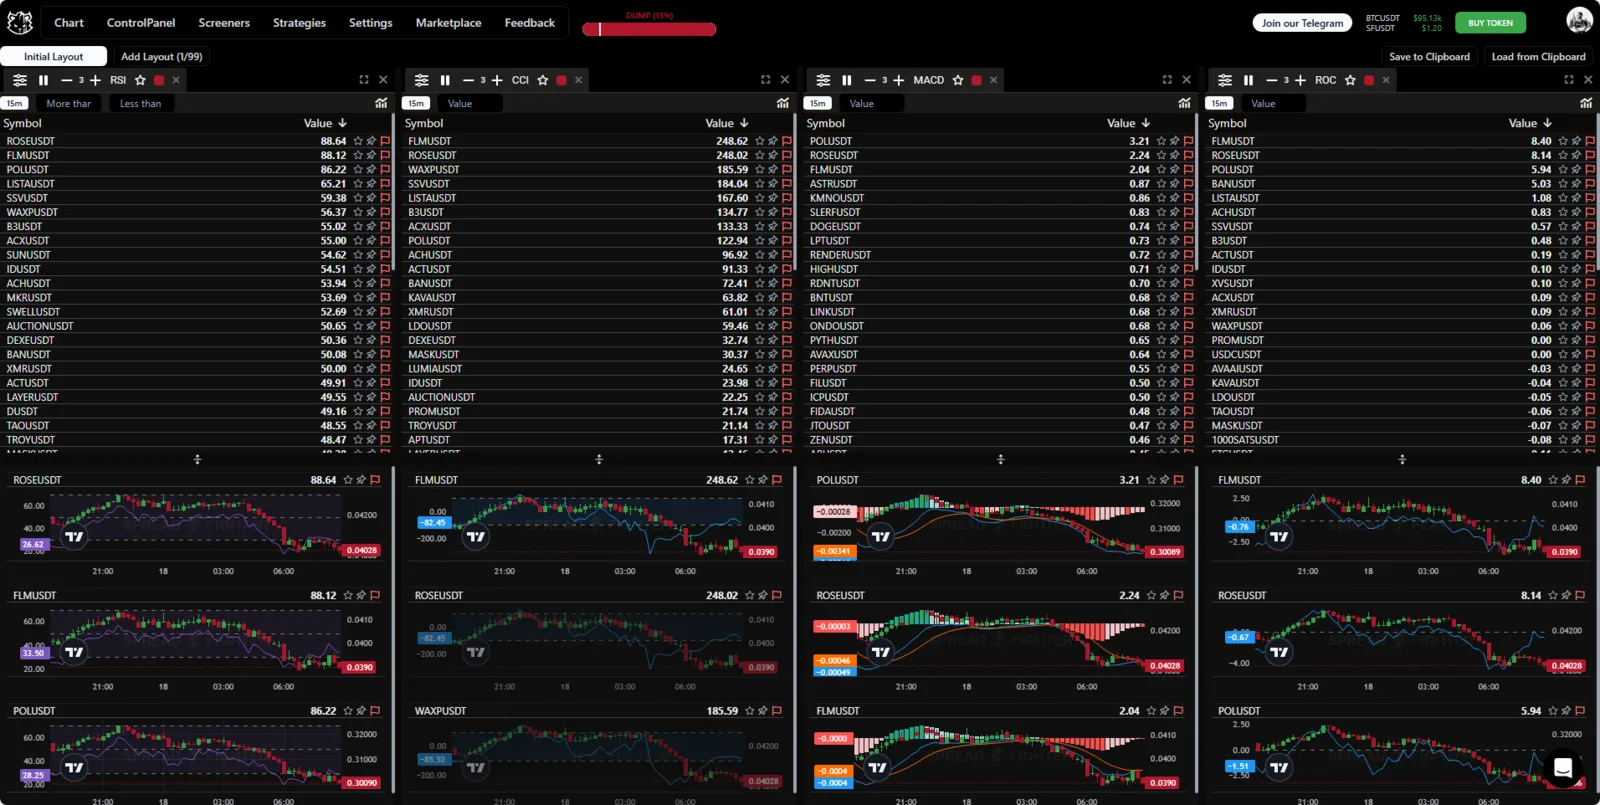
Widgets appearance.
Description
Scanners in the Technical category calculate a given technical analysis metric for the whole broad market and rank assets by the value of that metric.
Take the Rate of change (ROC) indicator as an example. ROC is a technical indicator based on the rate of change of a tracked parameter. The indicator measures the percentage change of a series between the current value and the price a given number of periods ago. ROC is plotted around a zero line. It moves up into the positive zone when prices rise, and moves into the negative zone when prices fall.
The indicator is calculated by this formula:
where: is the asset close price, is the indicator length.
A similar metric is calculated for the whole market. Assets go into the table sorted by the ROC value.
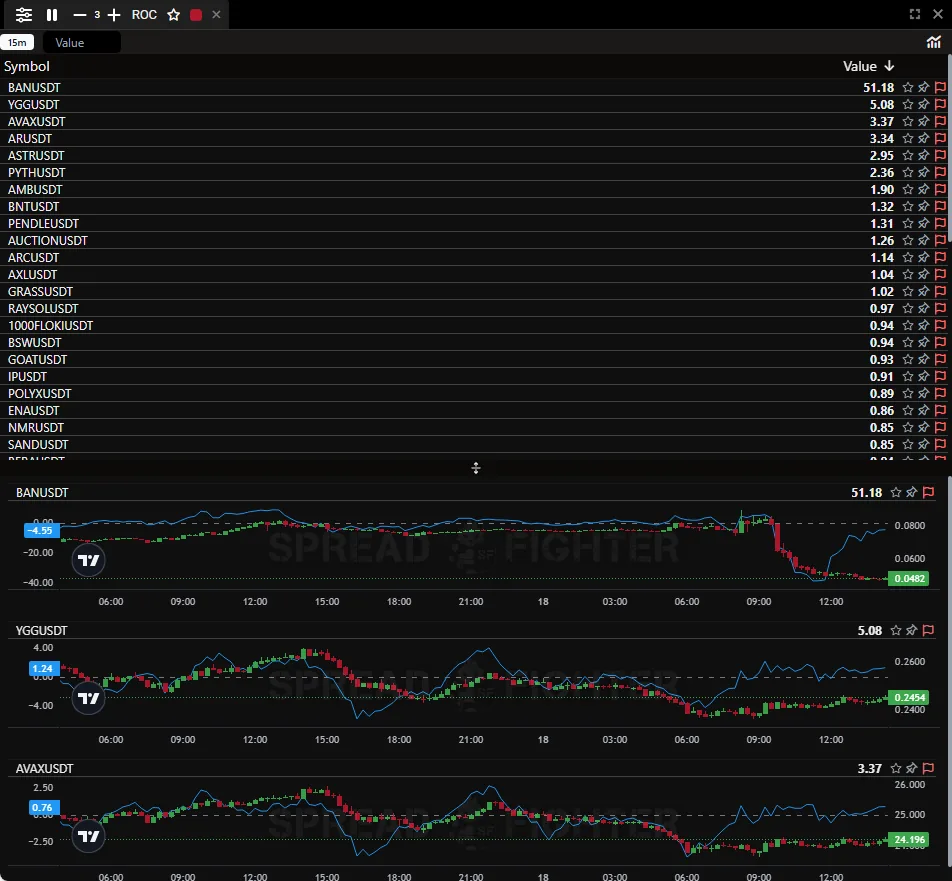
Assets with the highest ROC.
The RSI, MACD, CCI, ADX scanners and others work in the same way.
Location
Technical analysis widgets are in the category with the same name.
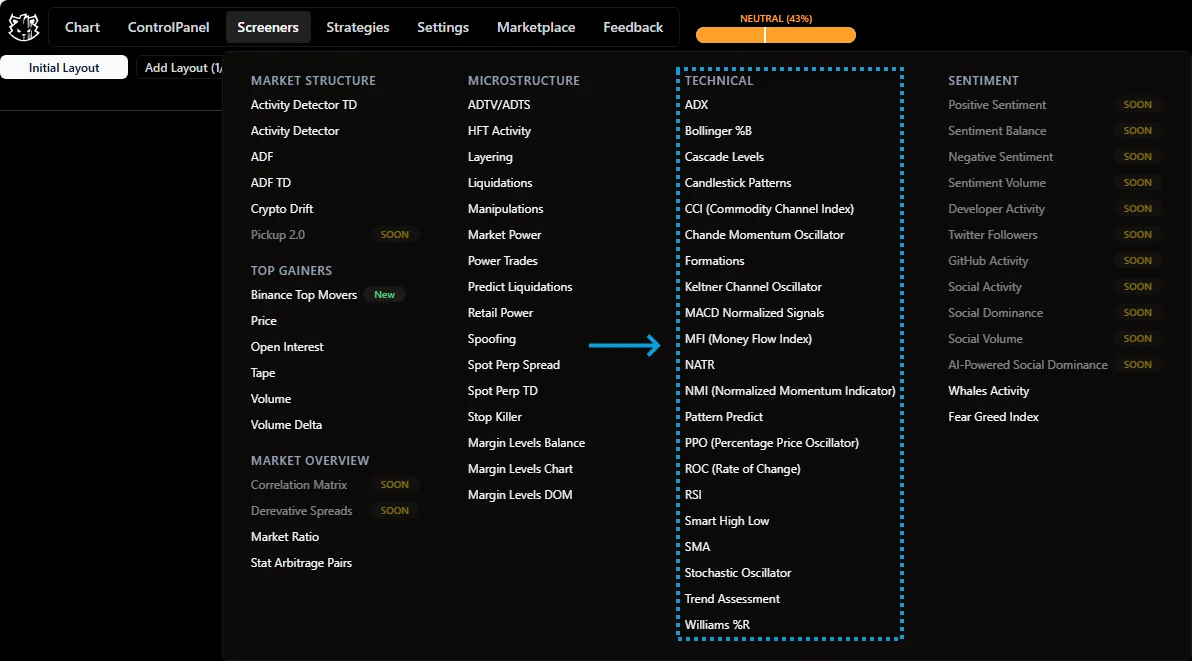
Scanners location.
Functionality
Technical analysis scanners share one look, with a single column: value. The column receives the data of the specific model. The user can filter and sort incoming signals by the value metric.
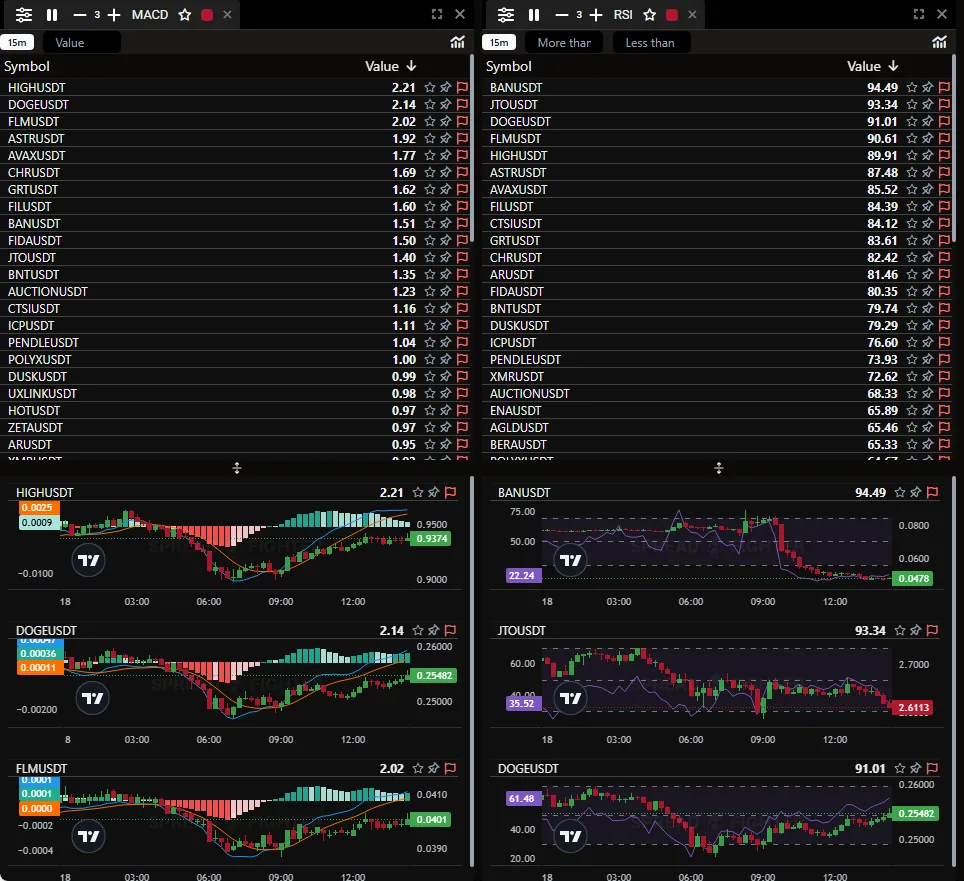
Technicals widgets.
Use cases. What does the rate of change indicator tell you?
Rate of change (ROC) is classified as a momentum or velocity indicator, because it measures the strength of momentum by the rate of change.
Positive values show a rising uptrend or momentum, and negative values below zero show downward momentum. Values growing in either direction, positive or negative, show growing momentum. A move back toward zero shows fading momentum.
Crossovers of the zero line can signal a trend change. Depending on the indicator length used, these signals can come early in a trend change (short length) or very late (longer length).
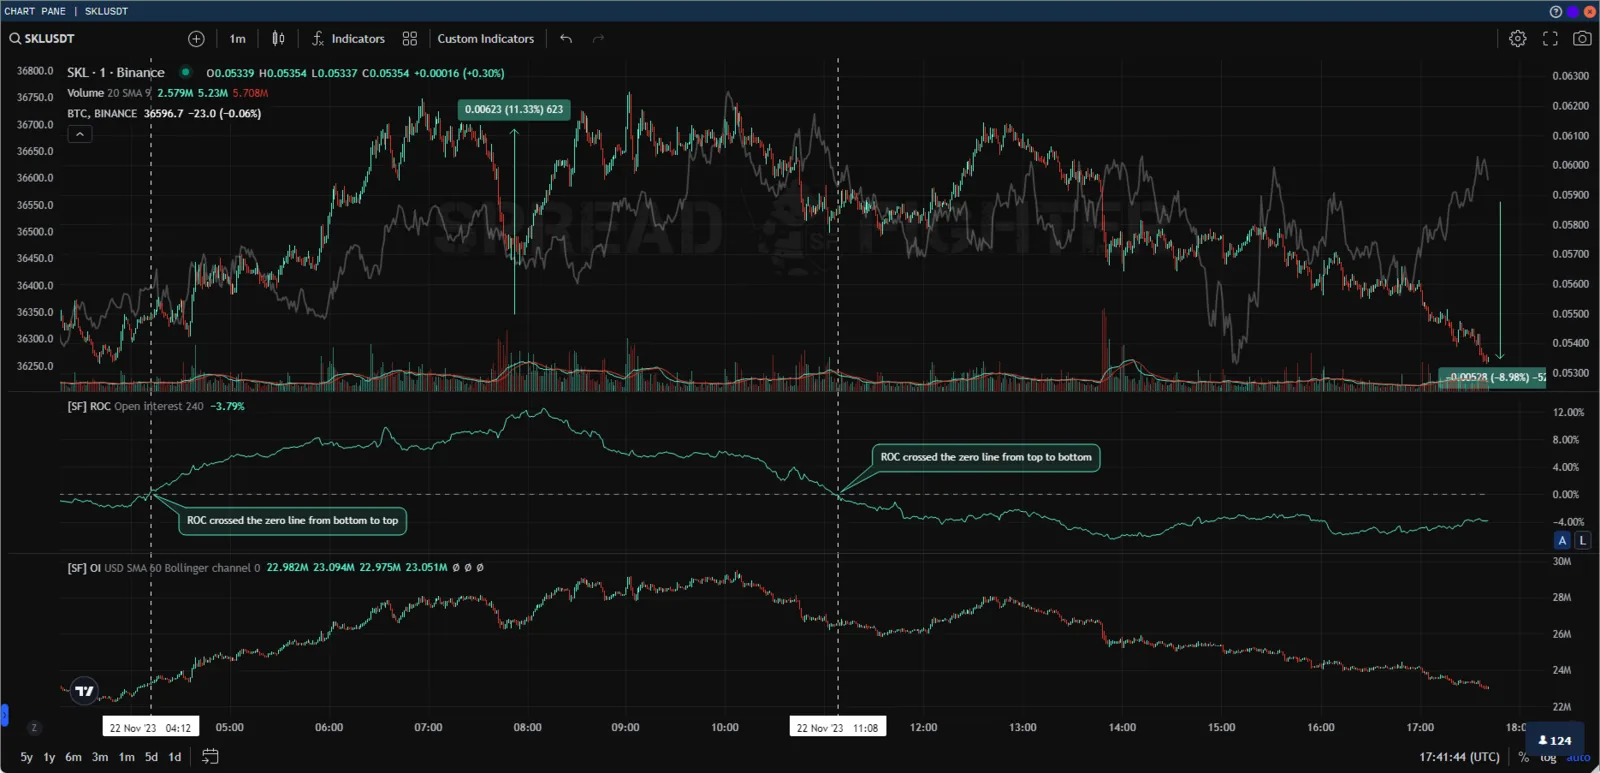
Trend trades.
ROC is prone to whipsaws, especially around the zero line. So this signal is usually not used for trading. It simply warns traders of a possible trend change.
Overbought and oversold levels are also used. These levels are not fixed and vary with the traded asset. Traders often find both positive and negative values where price reverses with some regularity.
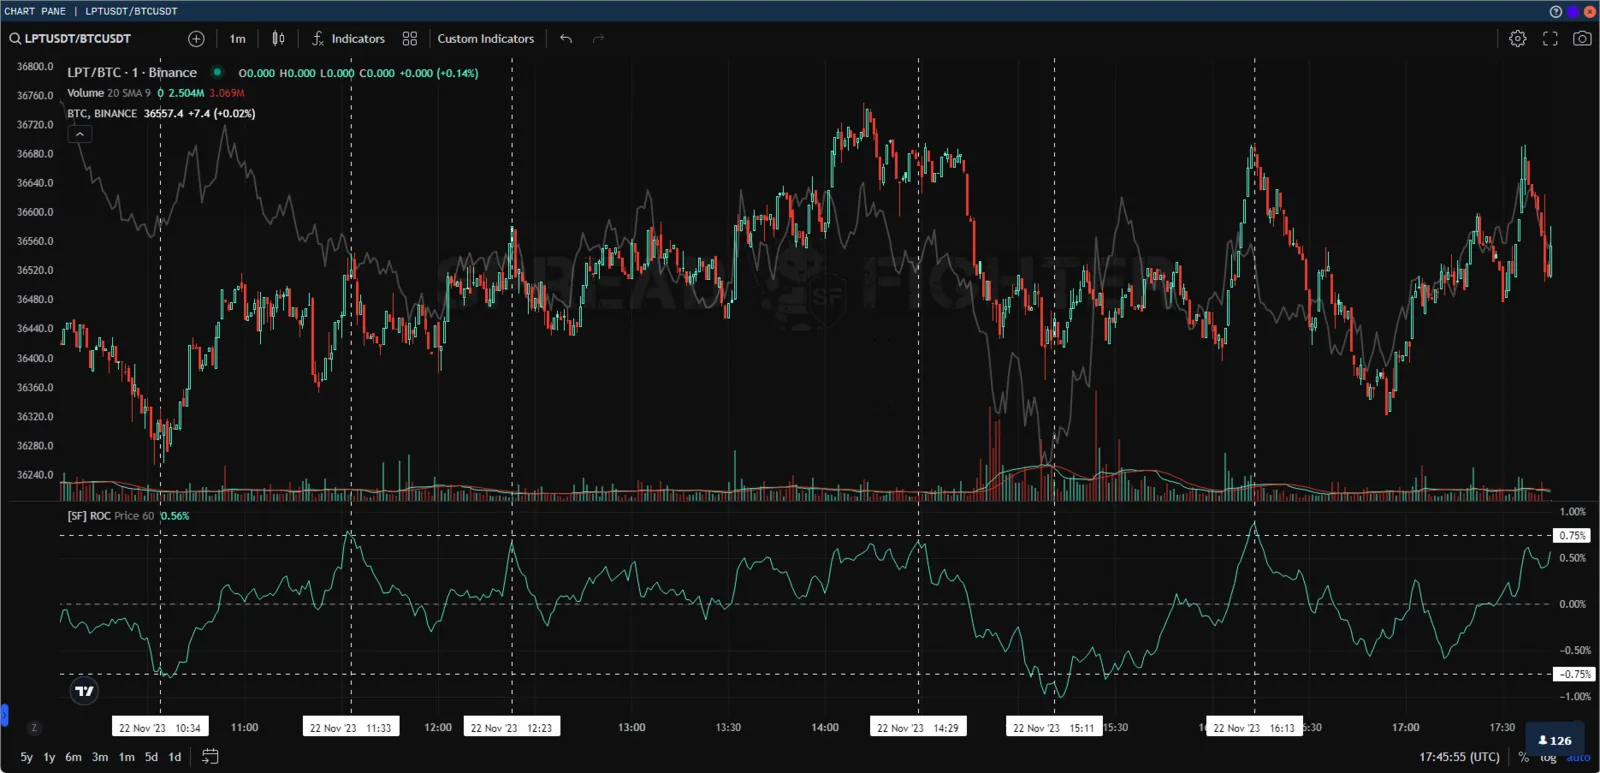
Reversal points.
ROC is also often used as a divergence indicator, which signals a possible upcoming trend change. Divergence occurs when the price of a stock or other asset moves in one direction while its ROC moves in the opposite direction. For example, if the price rises over a period while ROC gradually falls, ROC shows a bearish divergence from price, which signals a possible trend change to the downside. The same idea applies if price falls while ROC rises. That can signal an upward price move. Divergence is known to be a poor timing signal, because it can last a long time and does not always lead to a reversal.
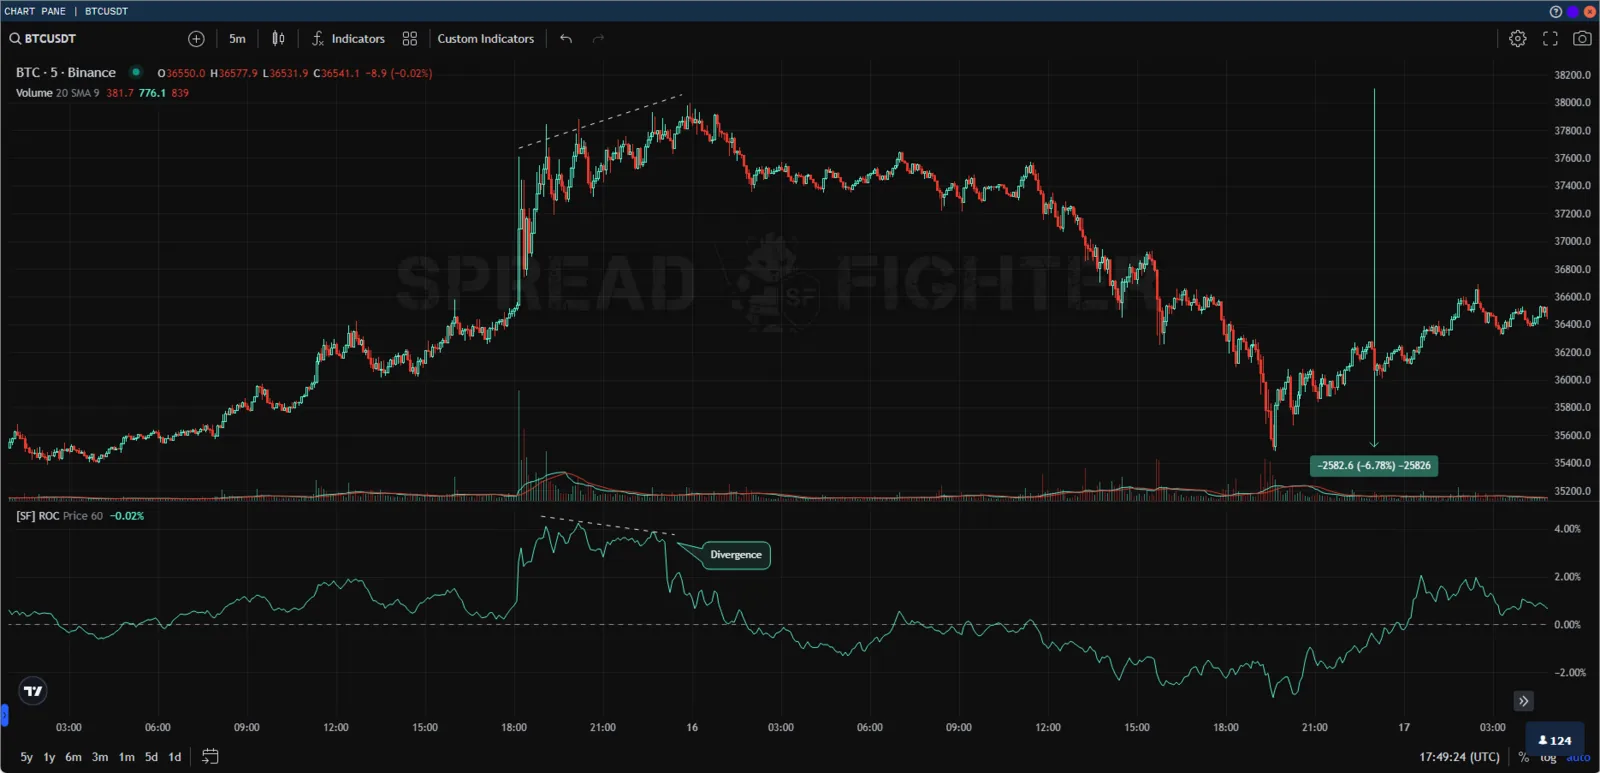
Divergence.
Limitations of the ROC indicator
One potential problem with ROC is that its calculation gives equal weight to the latest price and the price n periods ago, even though more recent price action matters more for the likely future price.
The indicator is also prone to sharp swings, especially near the zero line. This happens because when price consolidates, its changes shrink and move the indicator toward zero.
Although the indicator can be used for divergence signals, the signals often appear too early. When ROC starts to diverge, price can keep moving in the trend direction for some time. So divergence should not be treated as a trading signal. It can be used to confirm a trade if other reversal signals from other indicators are present and analysis methods.
Source: investopedia