Cumulative volume delta, Volume delta
Classic volume analysis indicators
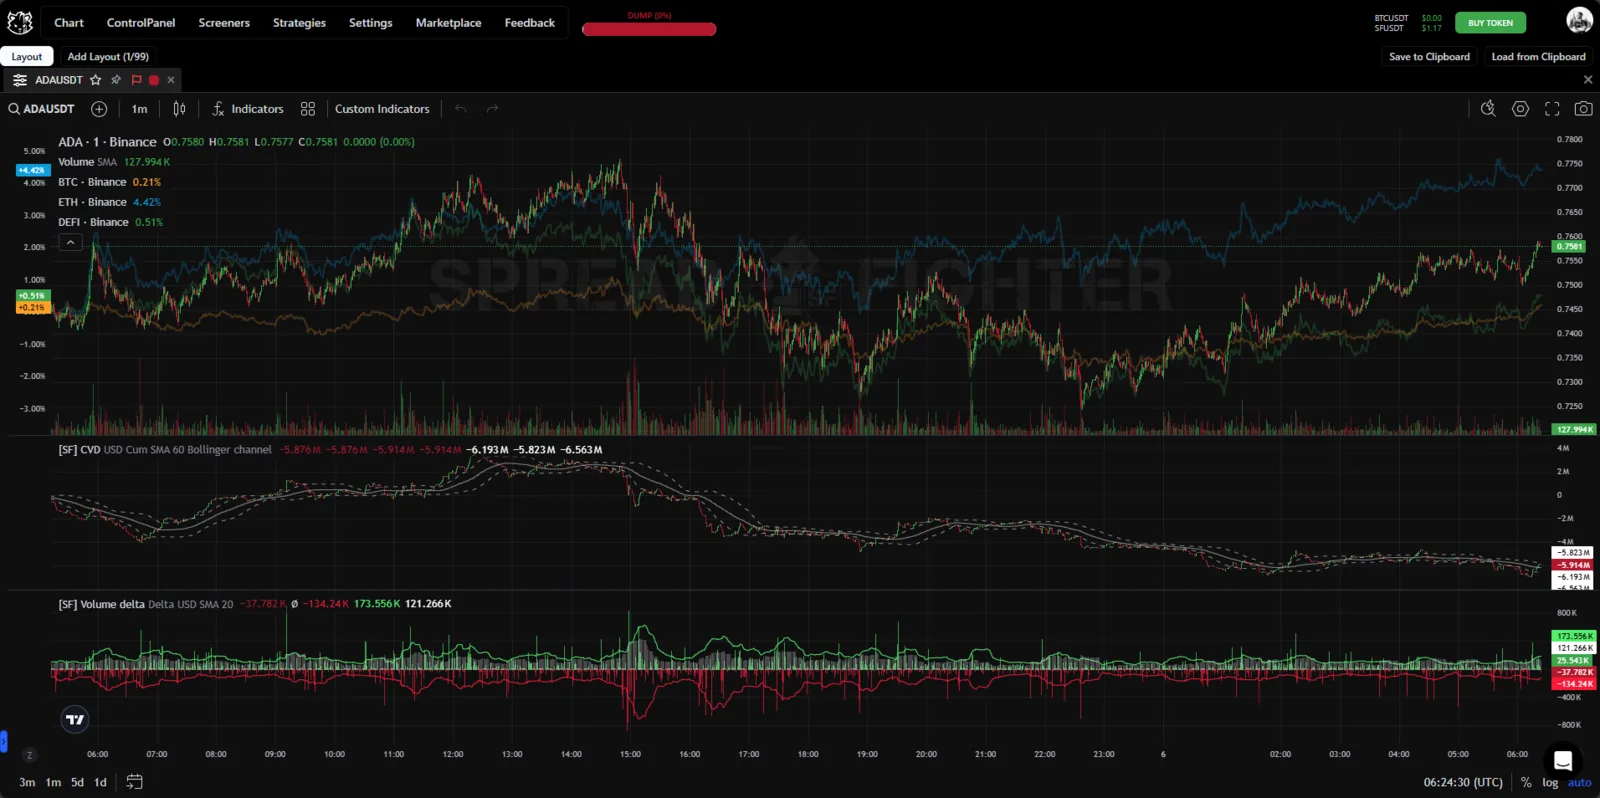
Indicator appearance.
Description
Volume delta is an indicator that shows the difference between taker buy volume and taker sell volume. It also calculates derived metrics: moving averages for buys and sells and the standard deviation of the delta.
Cumulative volume delta is a classic volume analysis indicator that calculates the difference between taker buy and sell volume as a running total.
Features
Volume delta has 2 display forms: a candlestick chart and a histogram.
Cumulative volume delta
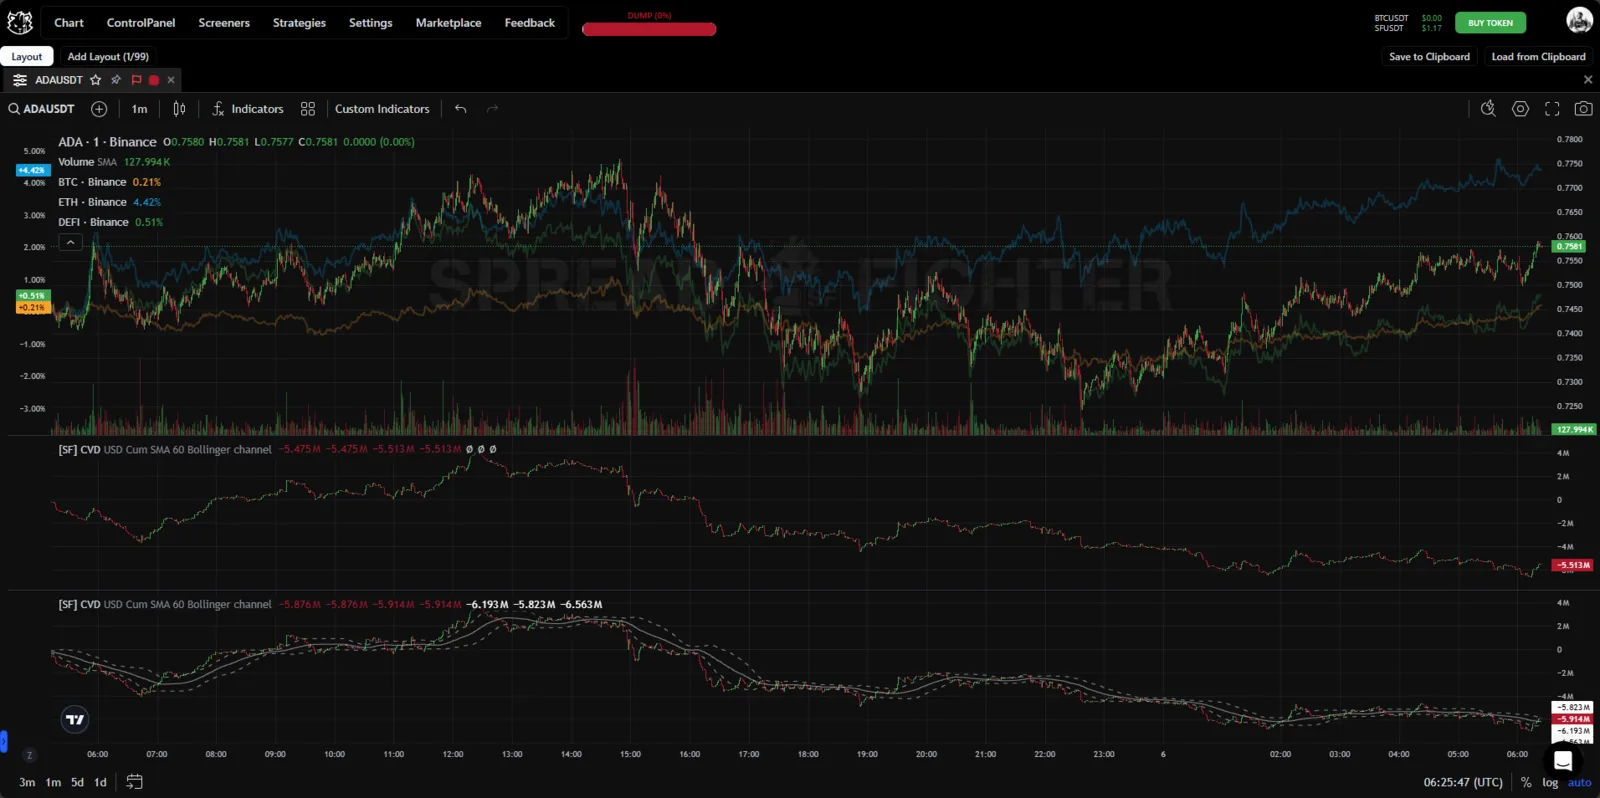
Cumulative volume delta.
The indicator is a candlestick chart in which the open, high, low and close take the corresponding values of the cumulative volume delta.
Volume delta
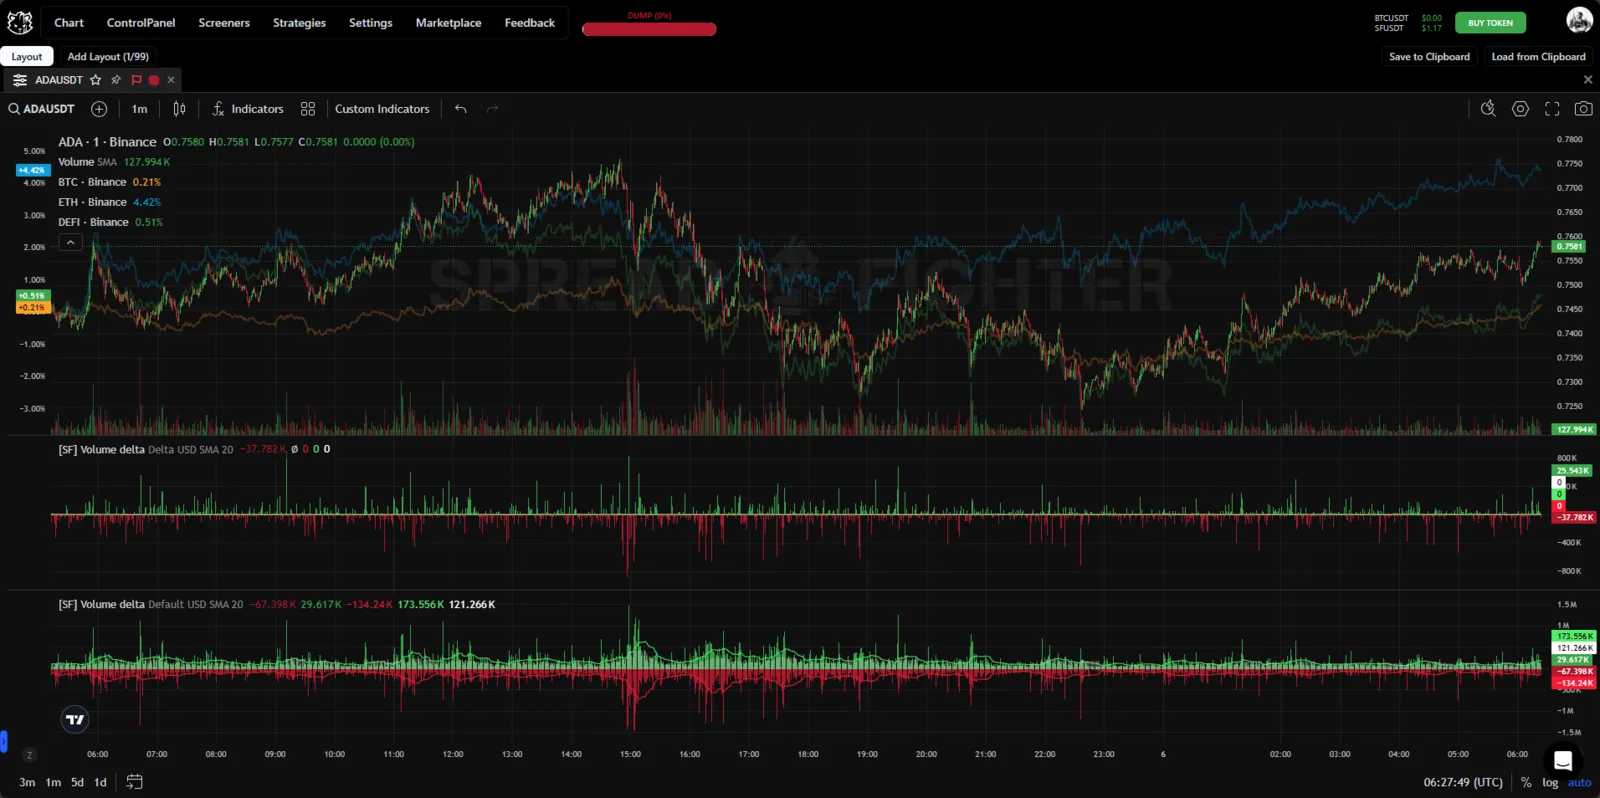
Volume delta.
The indicator is a histogram that shows taker buy and sell volume bar by bar.
Use cases
Volume delta is a powerful volume analysis tool for financial markets. It gives traders information about the difference between buy volume and sell volume over a given period. The indicator helps identify the dominant side of the market and track changes in trader sentiment.
Volume Delta
The main patterns for using the Volume Delta tool:
- Absorption is a market situation in which the price move runs into resistance in the form of limit orders, which absorb the aggression of market orders.
- Exhaustion is a market situation in which, as the price reaches new levels, the total number of aggressors (market buyers or sellers) falls. This shows an unwillingness to trade at new price levels and the closing of positions.
- Pushing delta is a market situation in which, as the price leaves a balance, an anomalous volume appears with a delta that is anomalous for the balance phase.
We need to watch the behavior of the bar delta (VD) as price extremes form.
- To detect the "Exhaustion" pattern, we need to see a decrease in aggression in the rate of price change and a fading of the delta. It is essential to look at other extremes as well. For example, to see sell exhaustion, look at the other lows and see aggression decrease with each new VD candle. To see buy exhaustion, look at the other highs with aggression decreasing with each new VD candle.
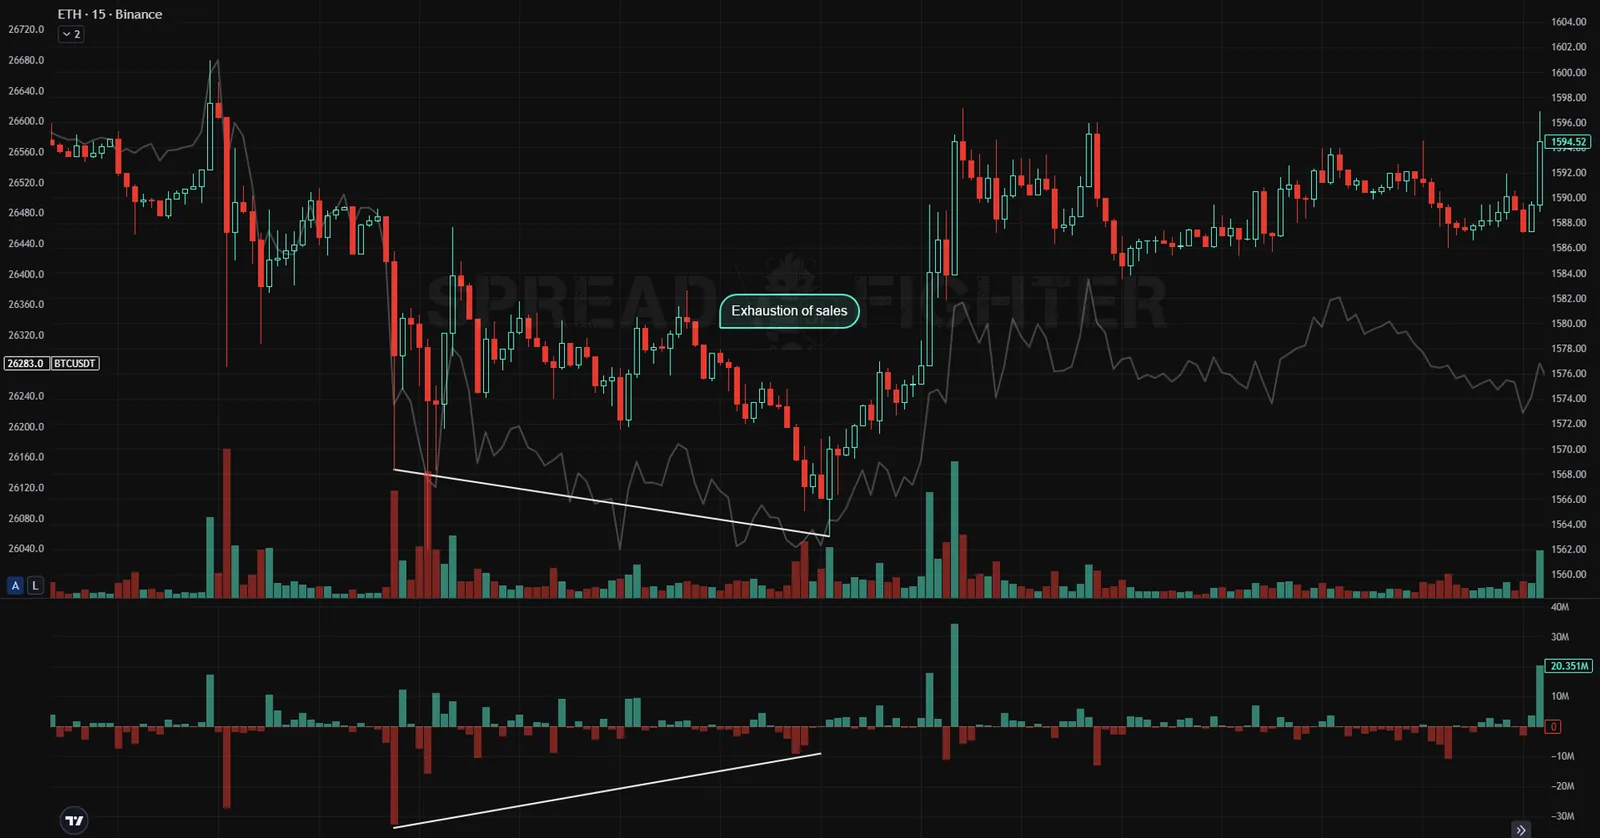
Sell exhaustion on the bar delta.
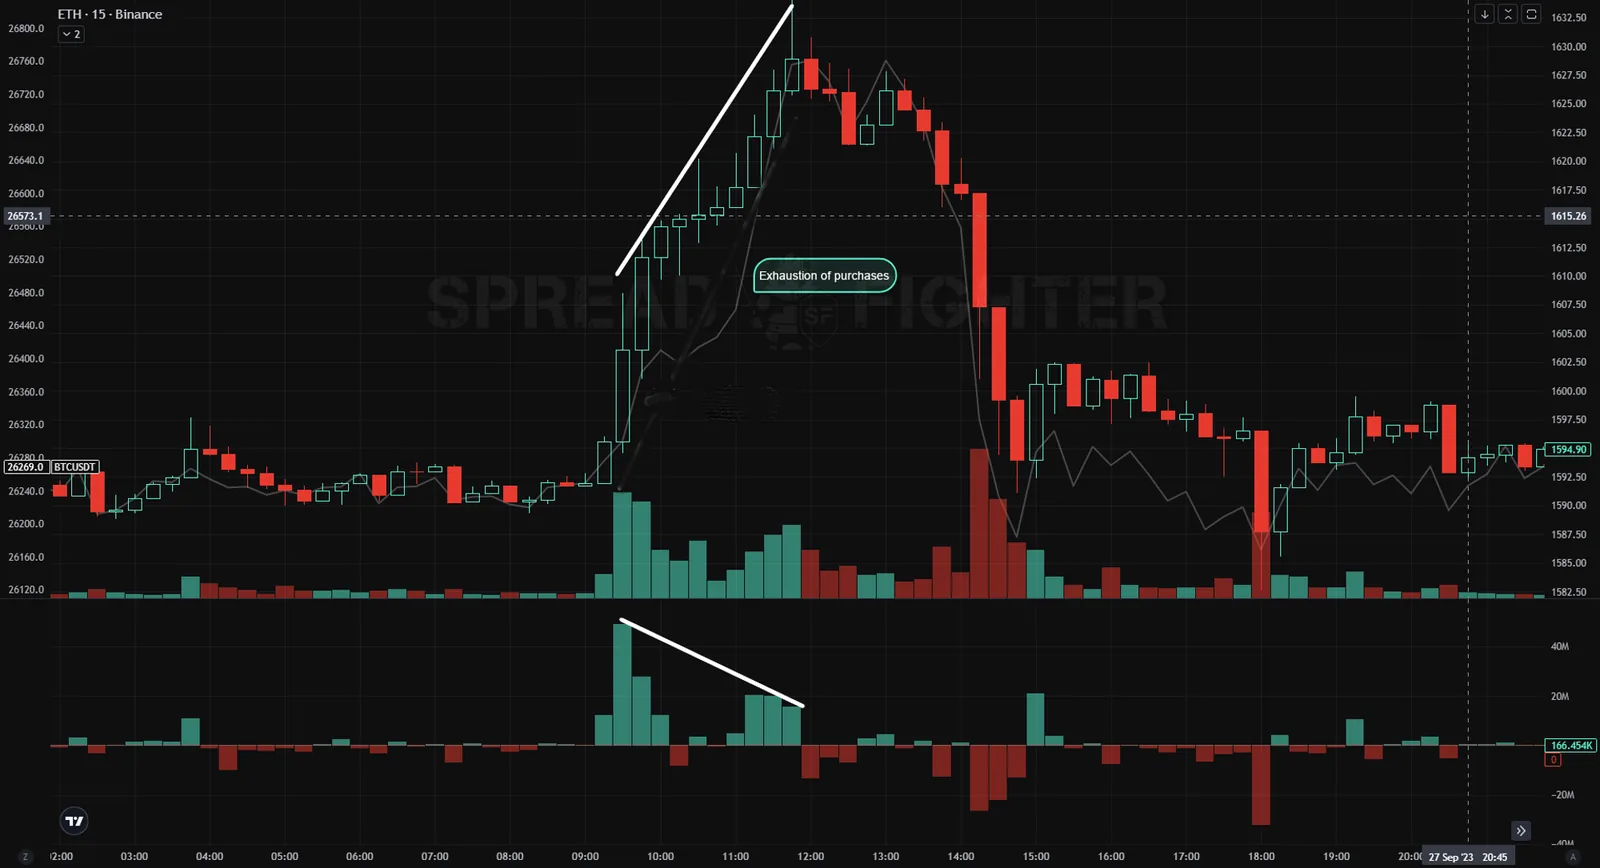
Buy exhaustion on the bar delta.
- To detect the "Absorption" pattern, on the contrary, we need to see excessive aggression that is out of proportion to the price move. That is, a large positive or negative delta together with a relatively small price candle. What matters is the ratio of the delta size to the price candle size compared with previous average ratios. The trend of the delta before the absorption forms is not as important as with exhaustion, but the price reaction after the anomalous delta appears is important. It is not enough to see a formal extreme form: the price must react in the opposite direction. An additional confirmation of absorption is a "tail" on the candle with the anomalous delta. The "Absorption" pattern can appear several times before a price reversal.
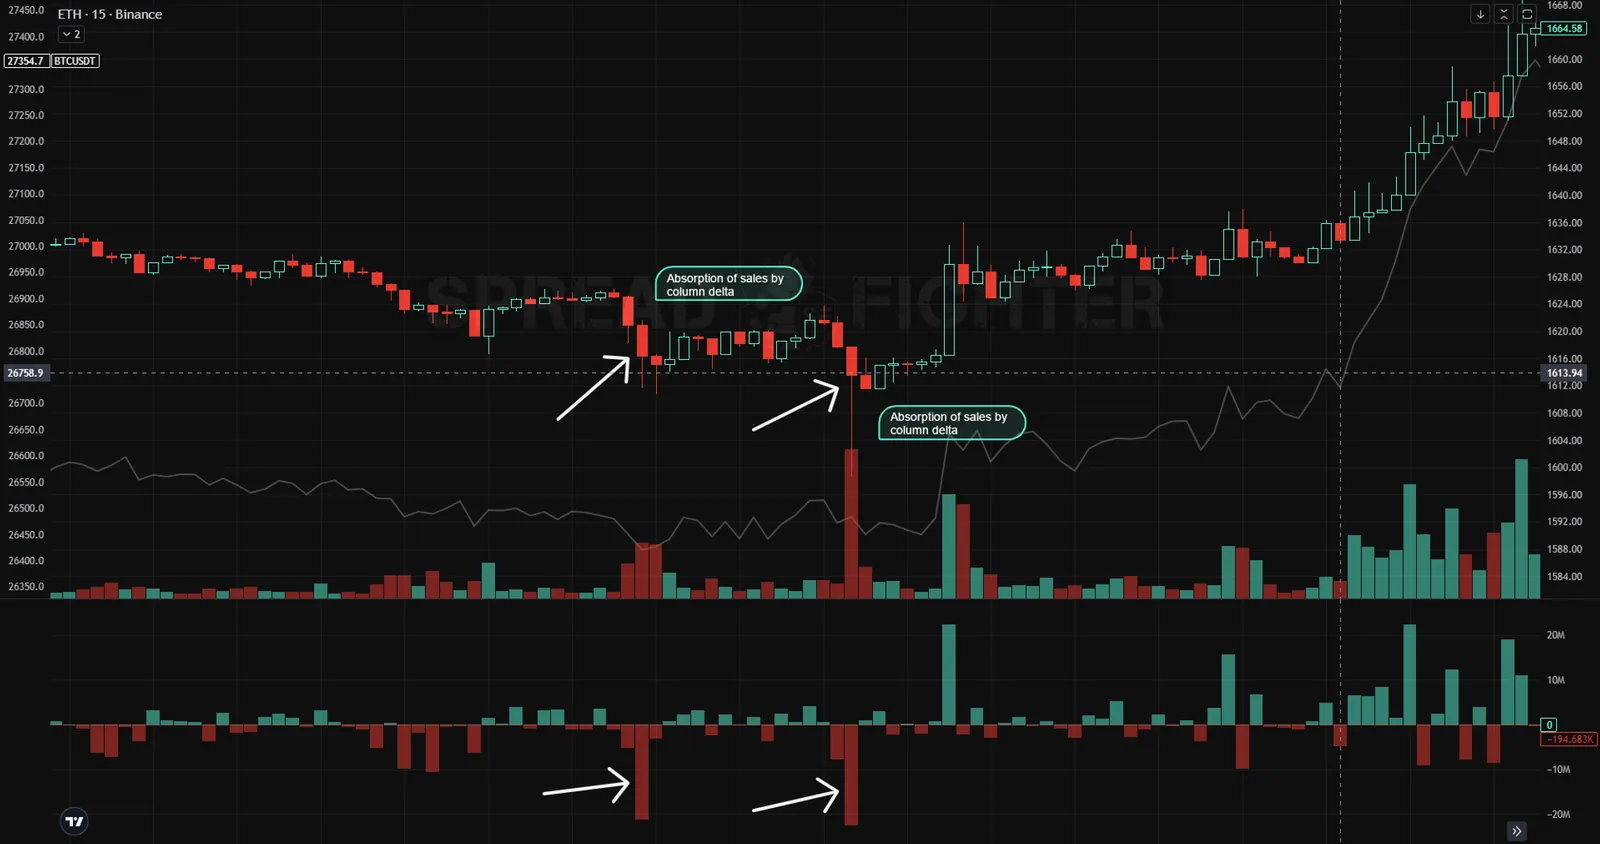
Sell absorption on the bar delta.
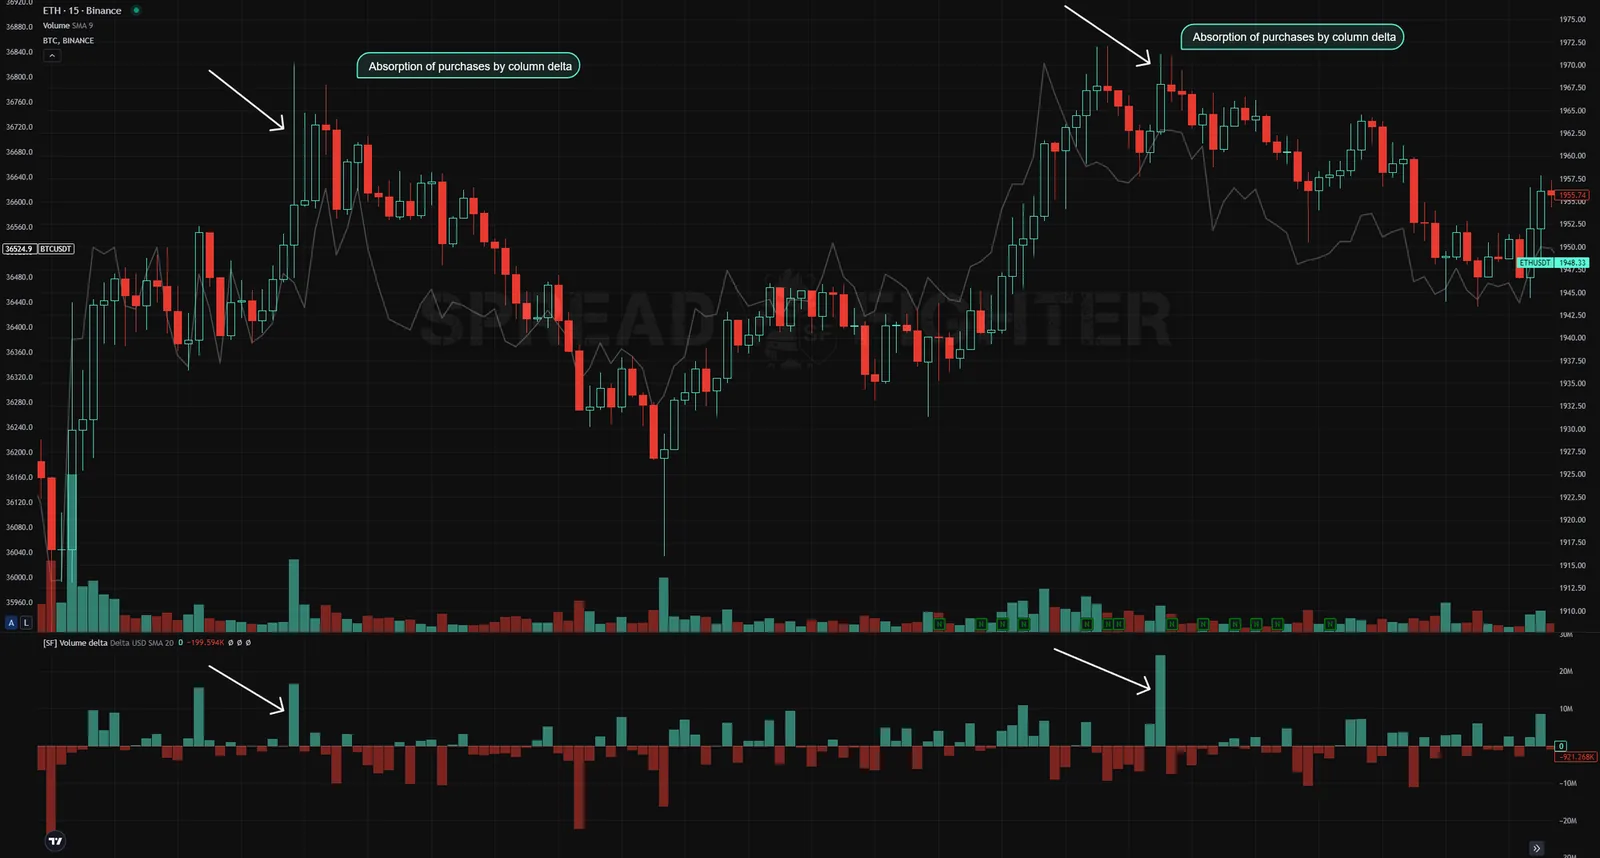
Buy absorption on the bar delta.
- Pushing delta is another pattern that characterizes the intentions of aggressive informed market participants. Increased volume combined with a positive delta that is anomalous for the balance phase at the top of a balance structure shows that aggressive buyers want to push the price to a new, higher level.
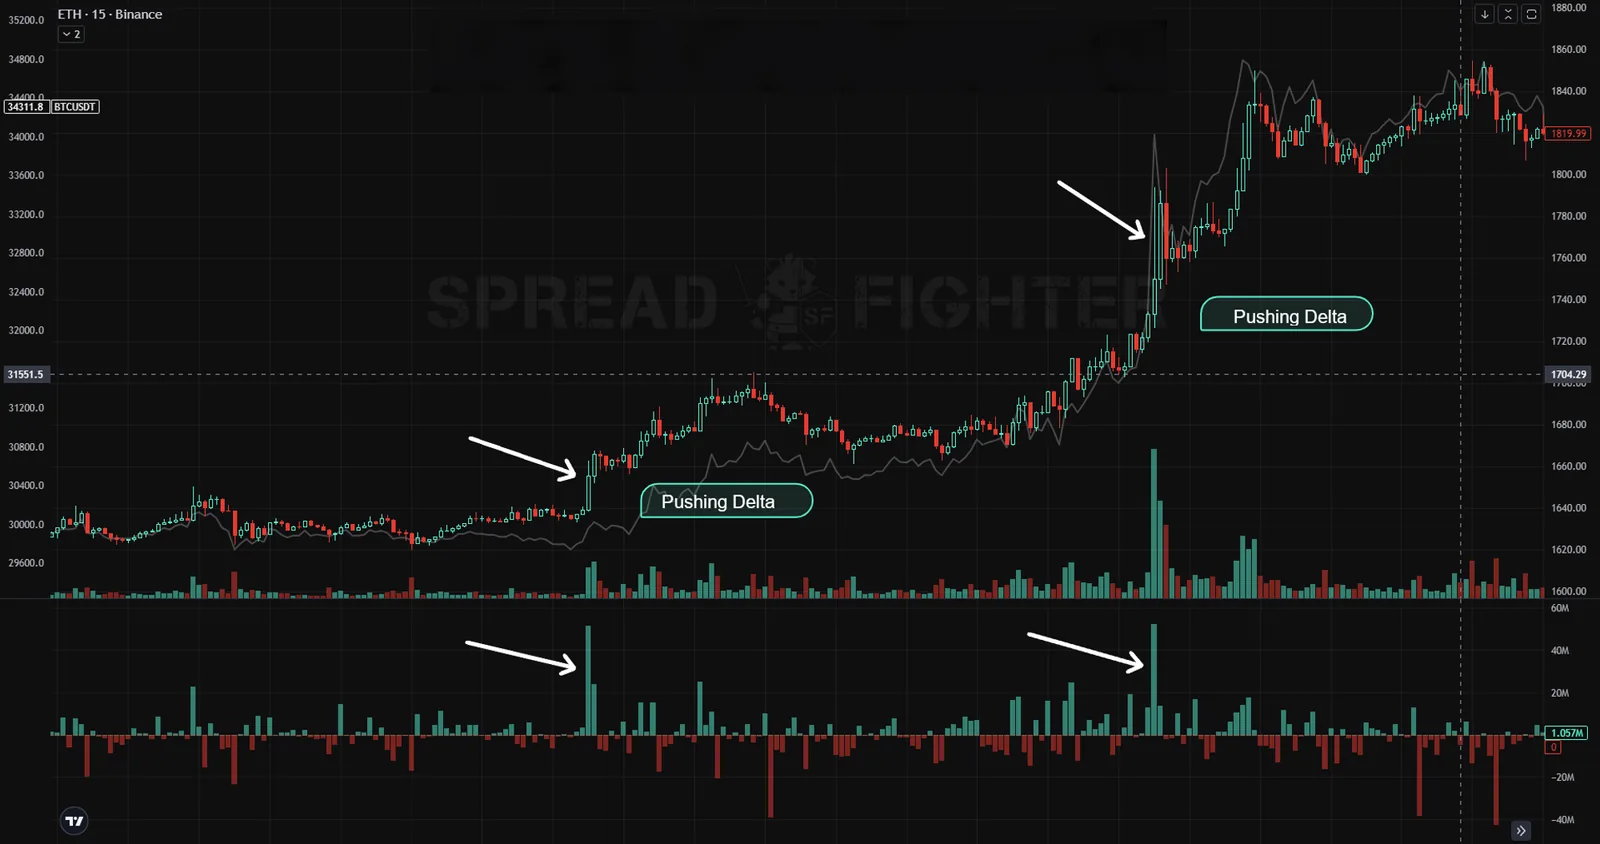
Pushing delta.
The lower the timeframe, the more effective the bar delta is. The recommended timeframes are 15 minutes and below. On timeframes higher than 15 minutes, the reaction to the Exhaustion and Absorption patterns will be much weaker.
Cumulative Volume Delta
Cumulative delta (CVD) is another way to visualize delta. This indicator sums up the delta values of individual candles and reflects the combined dynamics of the delta over a given period. As with the Delta (VD) indicator, you need to analyze the change in cumulative delta in relation to the change in price. When analyzing cumulative delta, you also need to look for the "Exhaustion" and "Absorption" patterns to find significant extremes and price reversals. But unlike the bar delta, with cumulative delta you need to look for not one extreme but two, for both exhaustion and absorption.
- The essence of the buy "Exhaustion" pattern on cumulative delta is as follows. During an upward price move, when a new high is reached, that is, the price has updated the previous extreme, we see that the cumulative delta does not follow the price: the highs of the cumulative delta are not updated. That is, buyers no longer want to buy the asset at the current price levels and take their positions off, which eventually lowers the asset price.
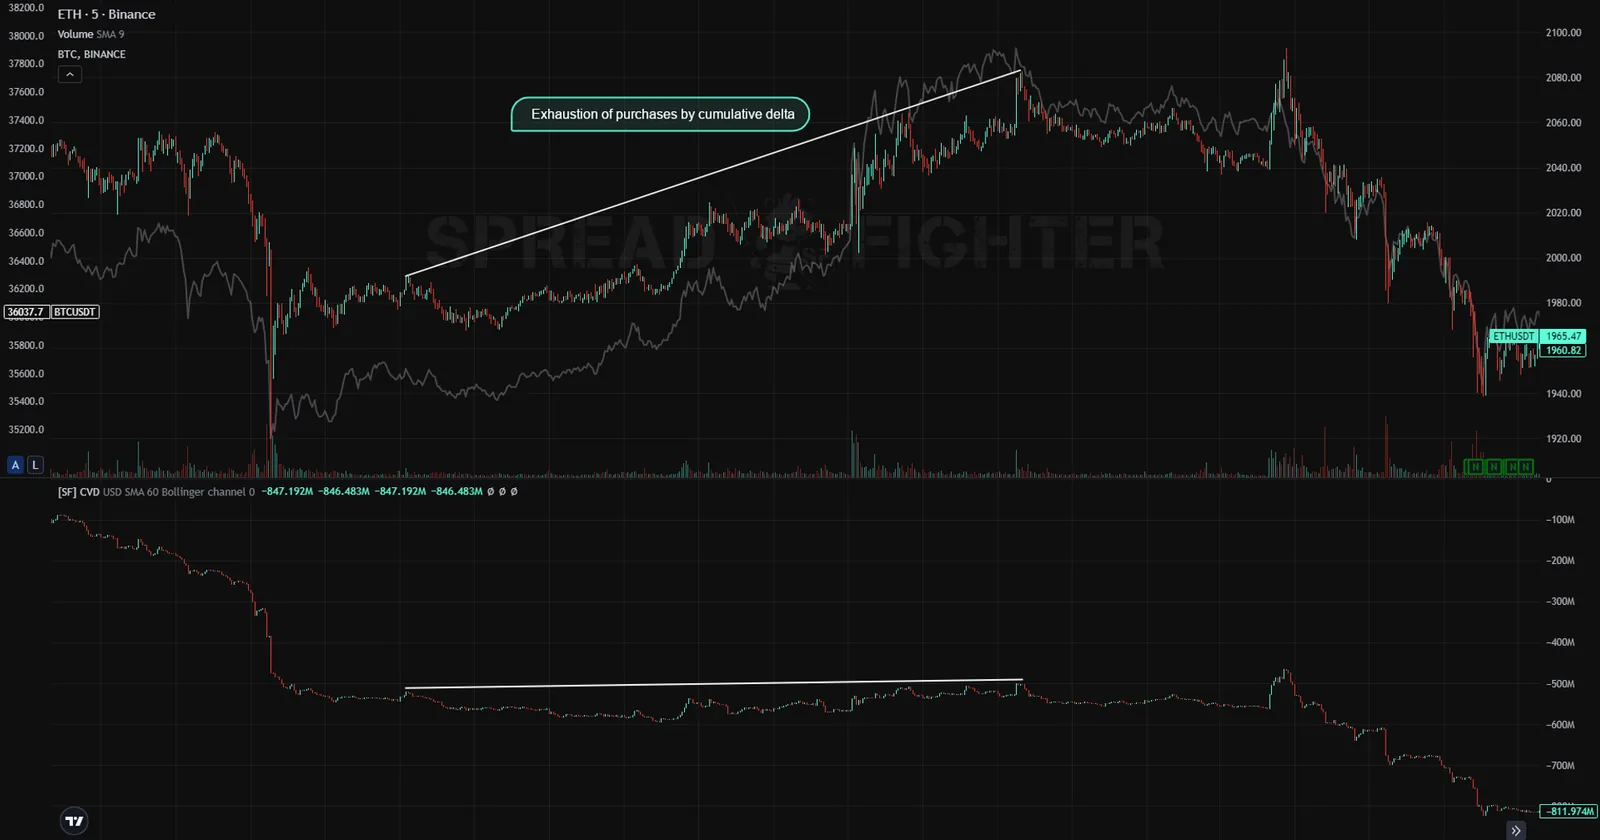
Buy exhaustion on cumulative delta.
- The sell "Exhaustion" pattern means that when the previous price low is updated, the cumulative delta low is not updated. The Exhaustion pattern points to a lack of aggression from the dominant side, which weakens the trend move of the price. Within cumulative delta, the "Exhaustion" pattern points to aggressive participants closing positions and the trend turning up.
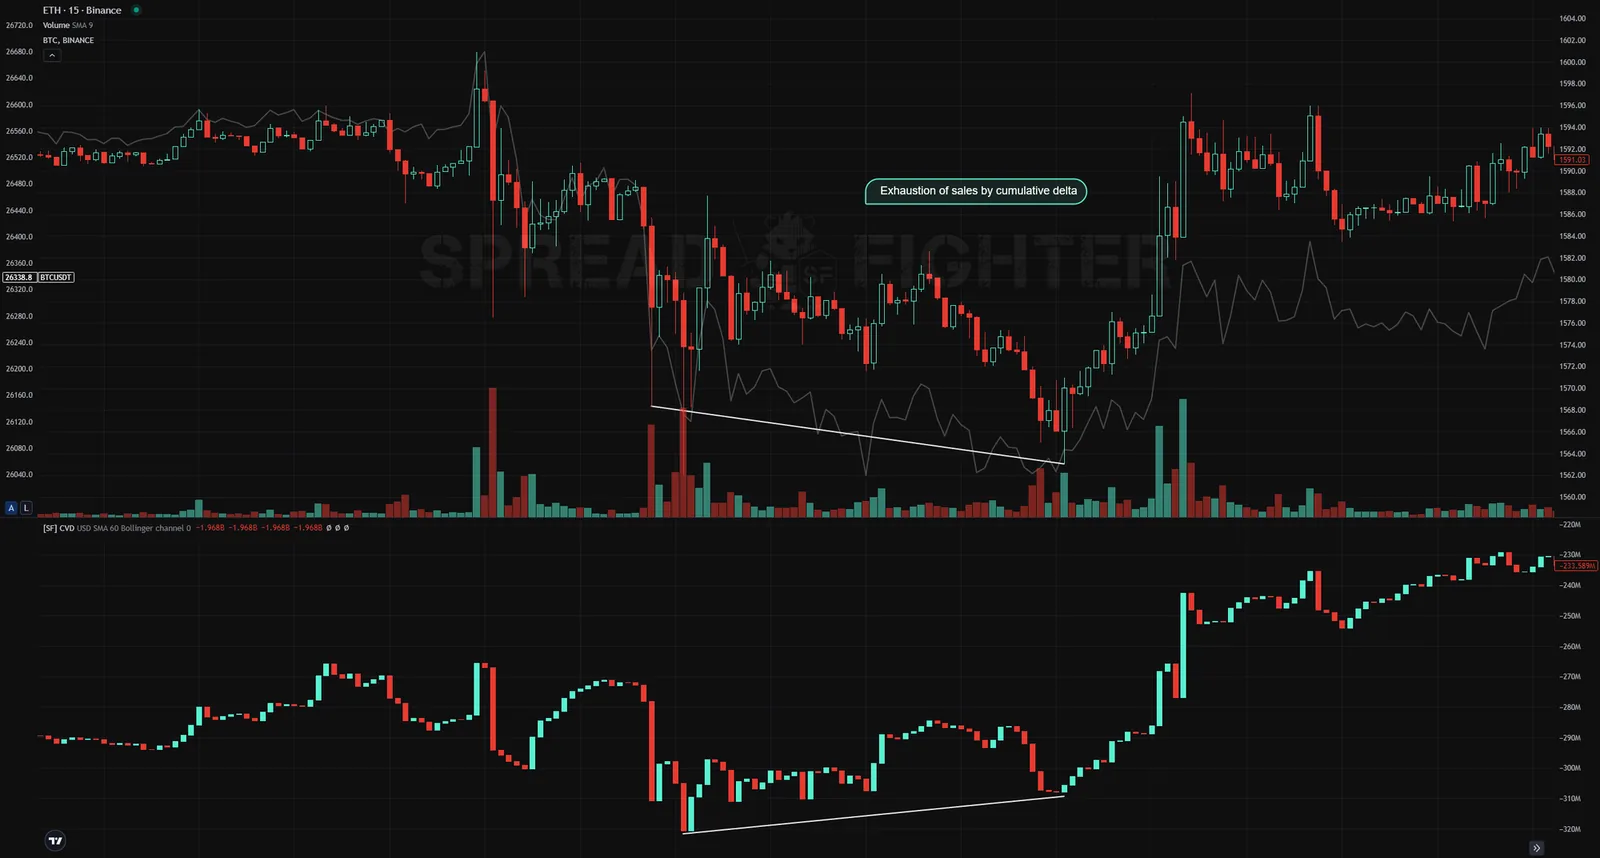
Sell exhaustion on cumulative delta.
When looking for the "Absorption" pattern, you also need to watch two extremes. Cumulative delta has two kinds of the "Absorption" pattern: classic and hidden.
- In classic absorption, the price extremes are barely updated while the cumulative delta extremes are updated. This means that market aggression brings no result because it is absorbed by limit orders.
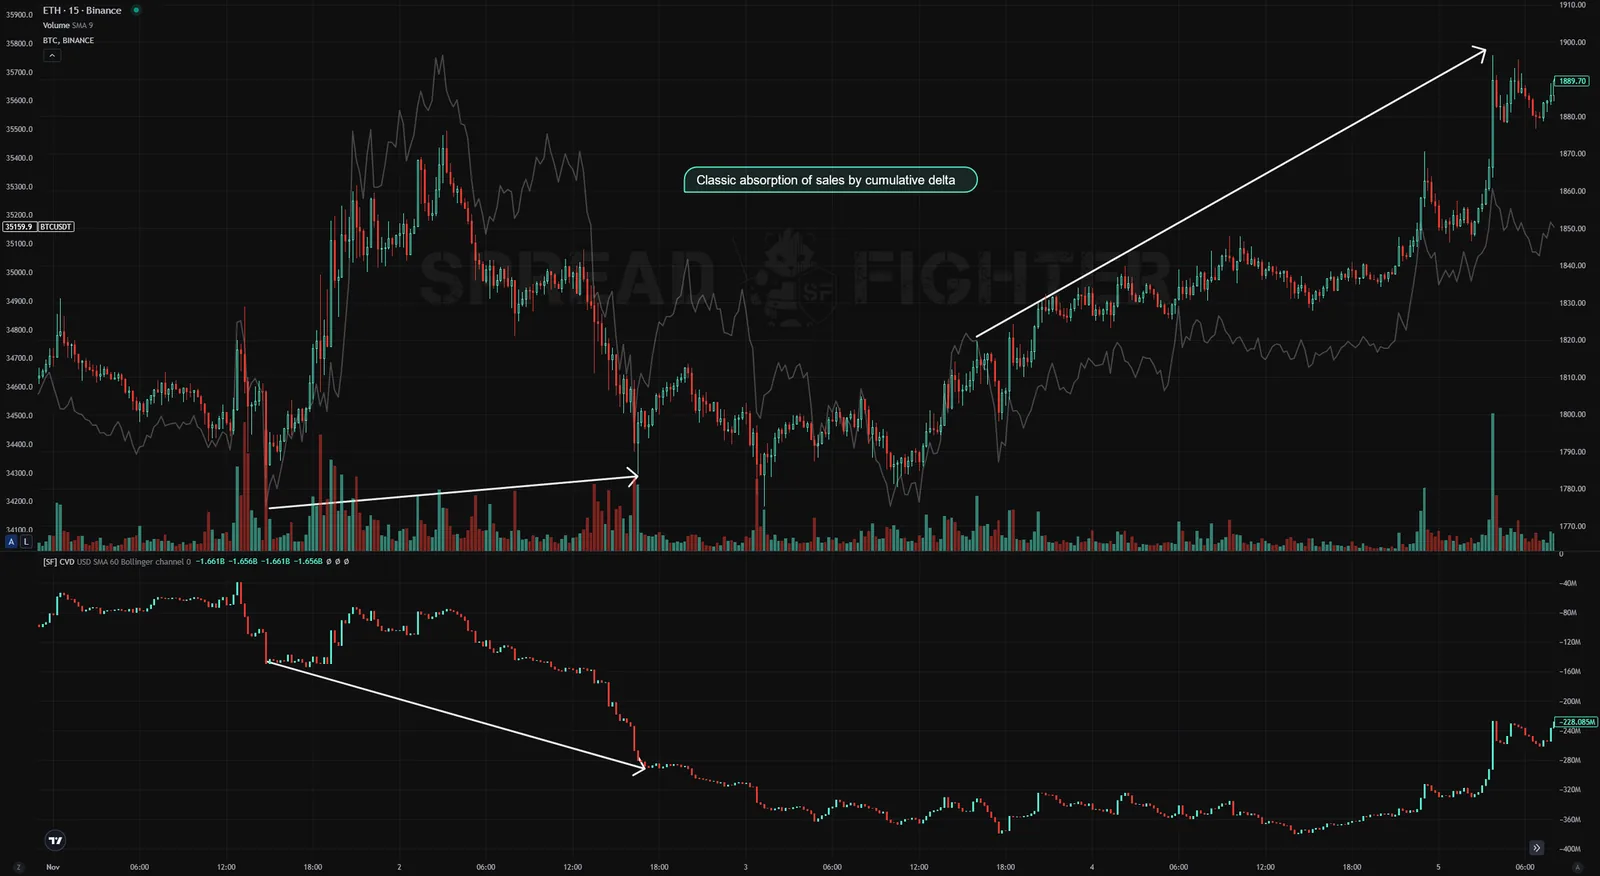
Classic sell absorption.
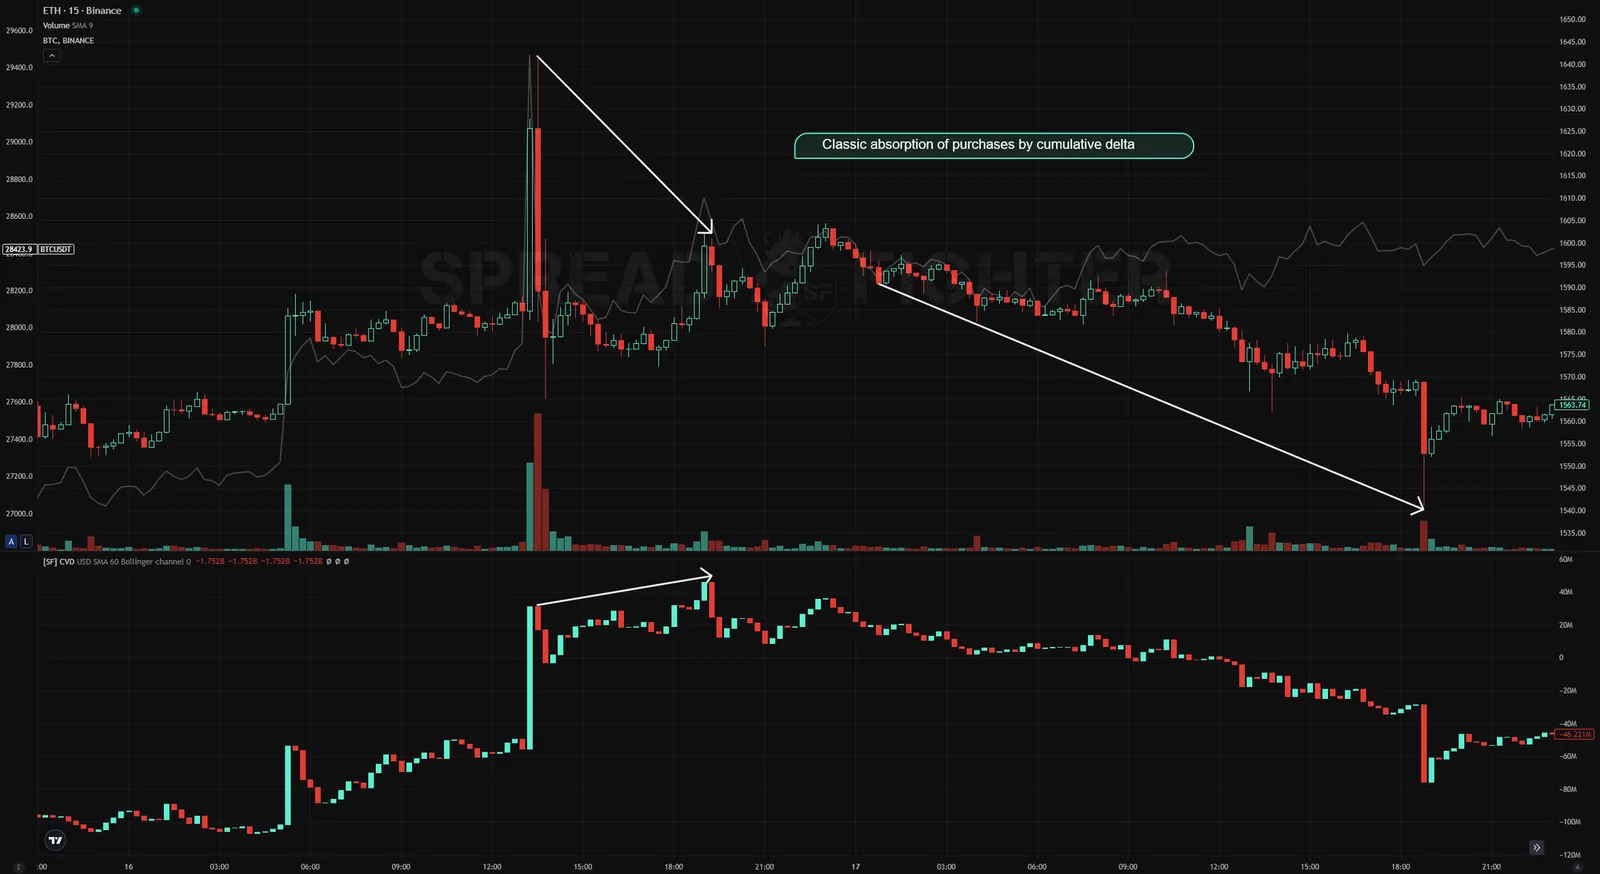
Classic buy absorption.
- In hidden absorption, the extremes of both the price and the cumulative delta are updated, but the change in the cumulative delta extremes is larger than the change in the price extremes. That is, significant market pressure has little effect on the price because the market aggression is absorbed by limit orders.
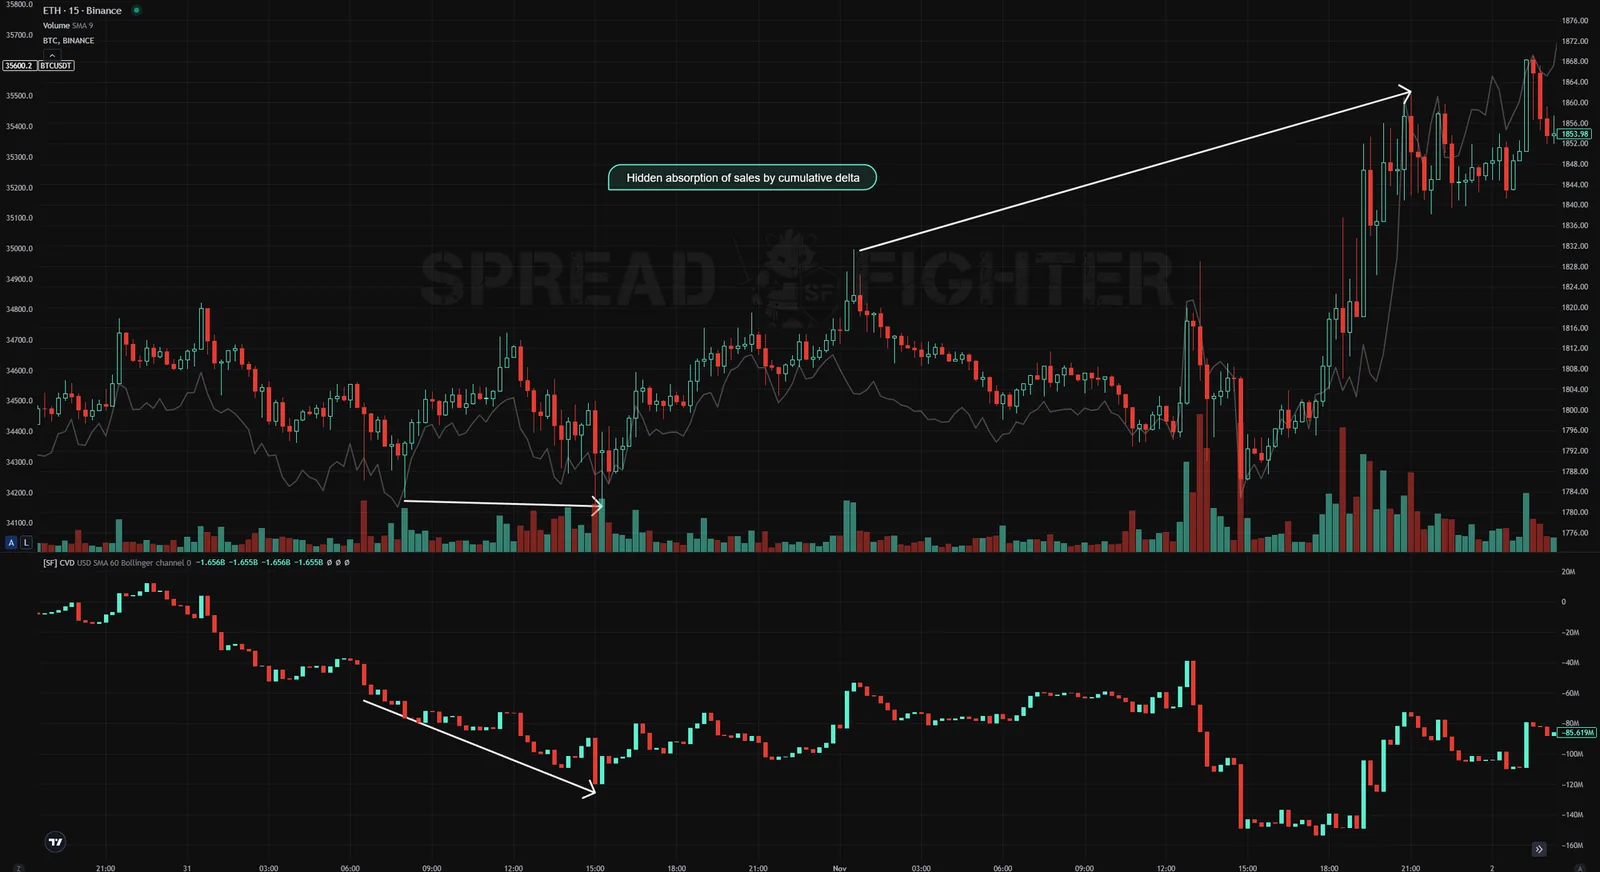
Hidden sell absorption.
- In a price balance phase, you evaluate not the extremes of the cumulative delta but its overall direction. For example, an overall decline of the cumulative delta while the price forms a balance structure over the period under review shows that market sells are ineffective and that the price is likely to leave the balance upward. If the cumulative delta grows noticeably while the price stays broadly unchanged over the period, market buys are being absorbed by limit sellers, which with a high probability will lead to a price decline.
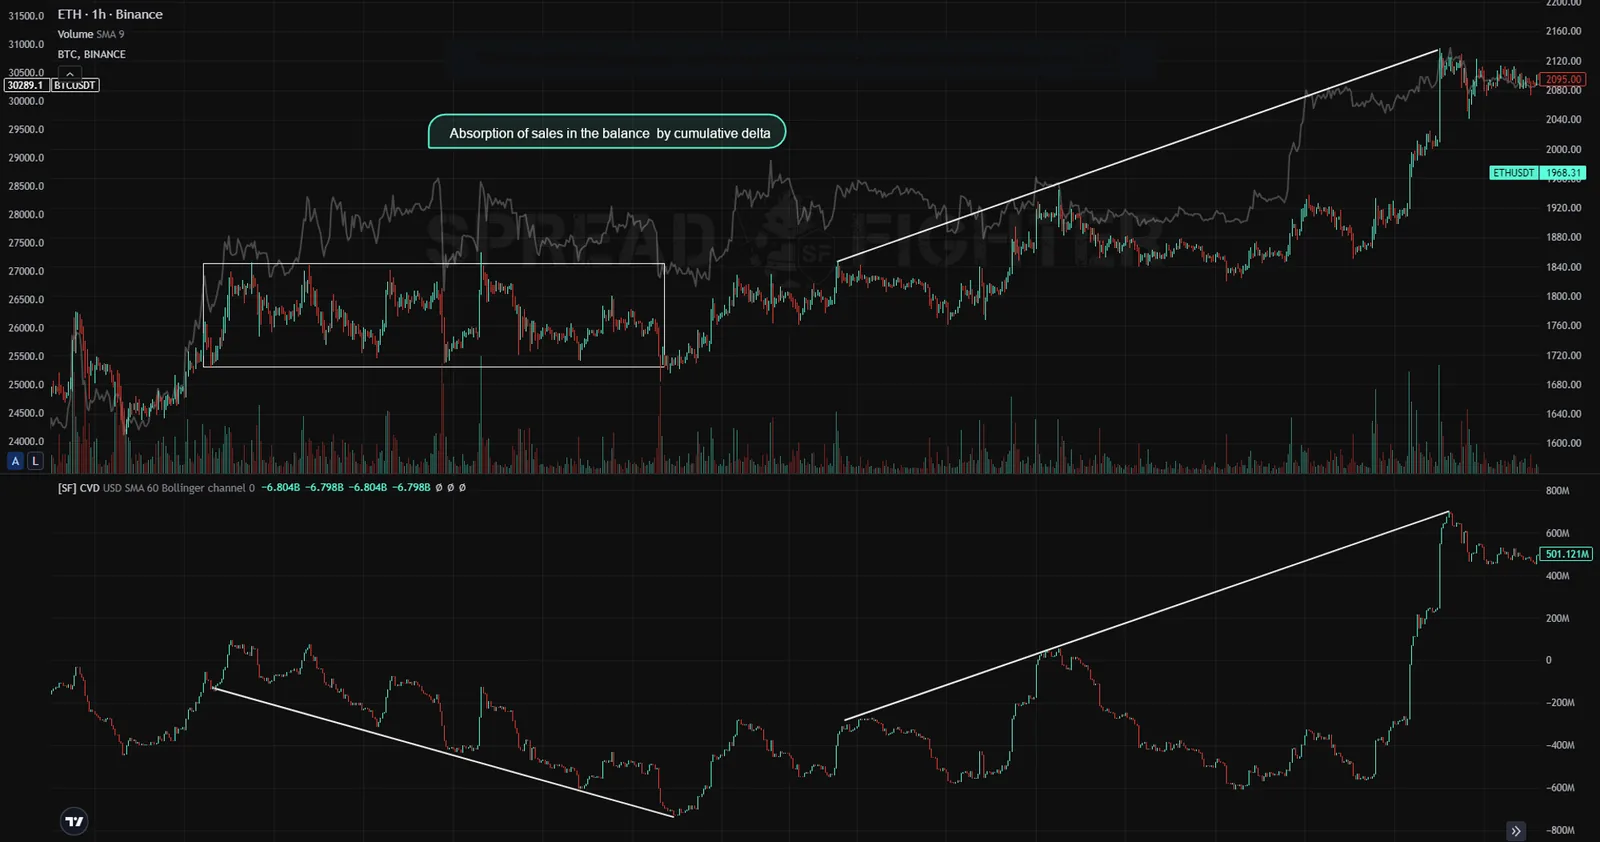
Sell absorption in balance on cumulative delta.
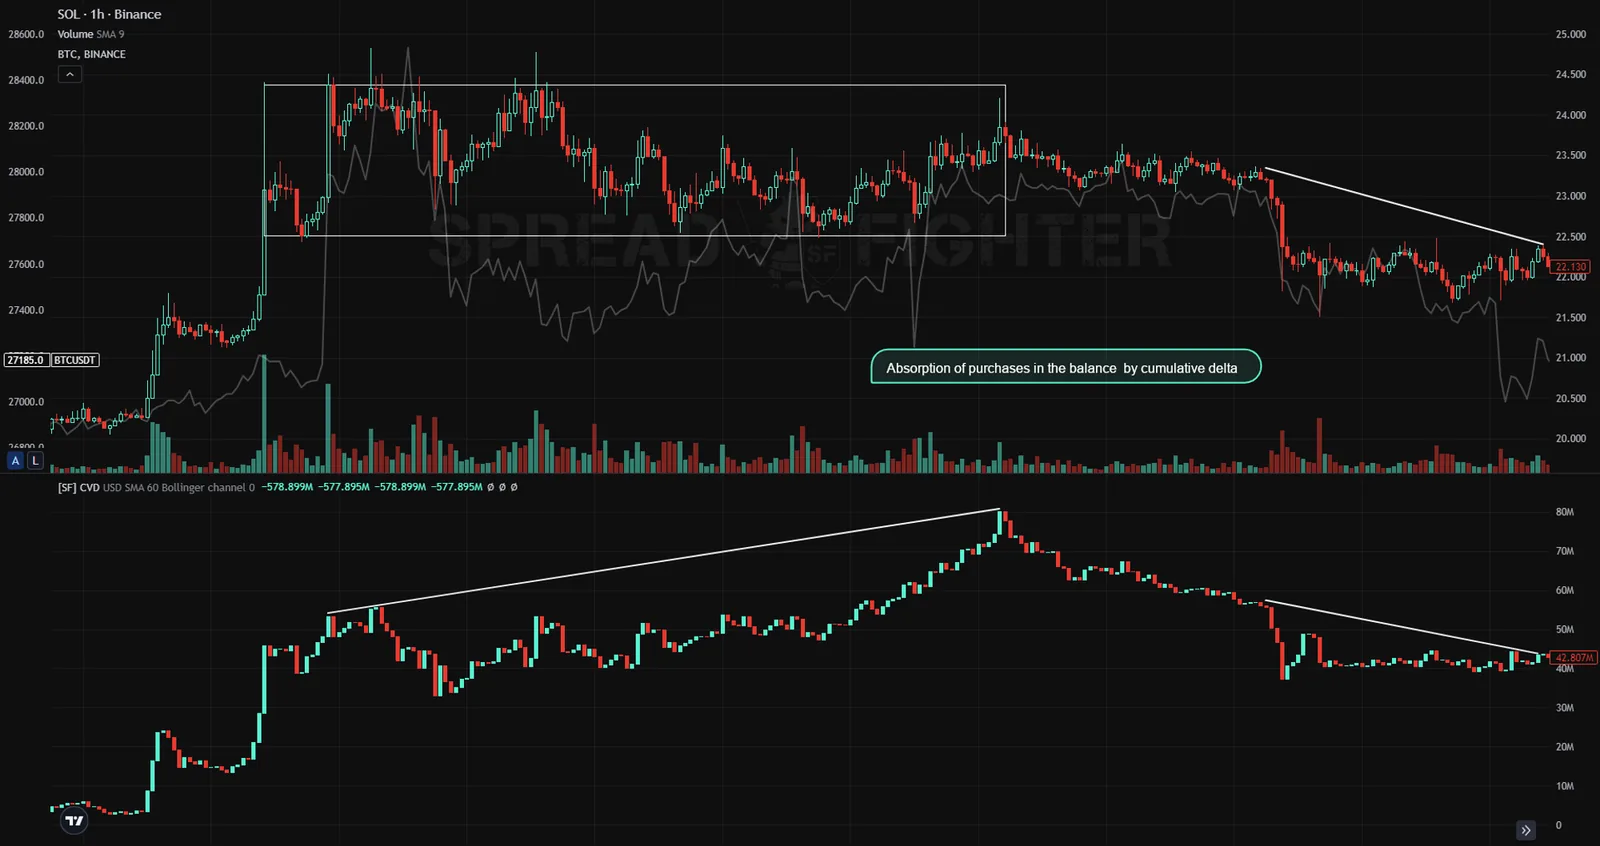
Buy absorption in balance on cumulative delta.
Notes:
-
It is important to look for the "Exhaustion" and "Absorption" patterns at significant price highs and significant cumulative delta highs during an upward price move. During a downward price move, look at significant price lows and significant cumulative delta lows. When searching for patterns, do not use the wicks of cumulative delta candles, only the bodies. The wicks of price candles can be used on full-body candles.
-
The CVD indicator is applicable only to highly liquid assets: BTC, ETH, AAPL, NG. On low-liquidity assets CVD is of little use, because most of the time their price is moved not by real market participants but by HFT algorithms that create moves that are insignificant for analysis.
-
The CVD indicator is applicable to all timeframes. But its effectiveness decreases as the timeframe grows. The recommended timeframes are from 1 hour to 5 minutes.
The described usage patterns of the Volume Delta and Cumulative Volume Delta indicators let a trader determine the reversal points (Pivot point) of the analyzed asset's price predictively, with a fairly high degree of probability. These patterns can be seen as a kind of "insight" from informed market participants, who mostly determine the subsequent direction of the asset price.
A retail trader who has this information about the actions of informed traders can join them and get a profit comparable to that of the informed participants.
By analyzing not one asset but several with these patterns, a retail trader can build a portfolio for trading over a chosen time interval that can outperform the Benchmark (BTC for the crypto market). The CARM and SARM tools, described in the SpreadFighter Wiki, let you estimate the likely return of the portfolio you build.